. 2021 Jul 15;131(14):e150175.
doi: 10.1172/JCI150175.

Impaired humoral and cellular immunity after SARS-CoV-2 BNT162b2 (tozinameran) prime-boost vaccination in kidney transplant recipients

Affiliations

Impaired humoral and cellular immunity after SARS-CoV-2 BNT162b2 (tozinameran) prime-boost vaccination in kidney transplant recipients

Arne Sattler et al. J Clin Invest. .

Abstract

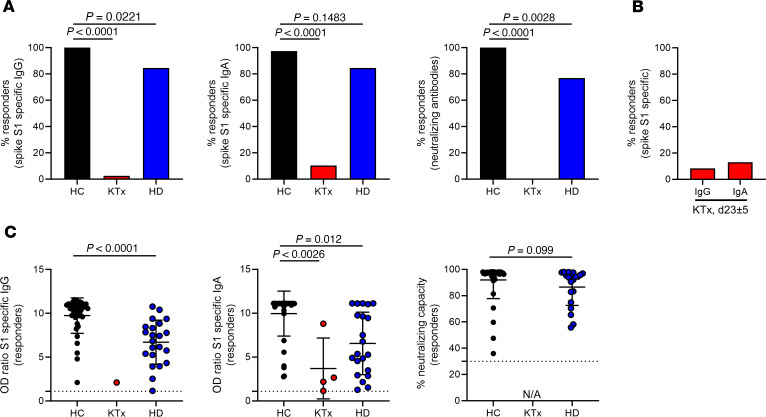
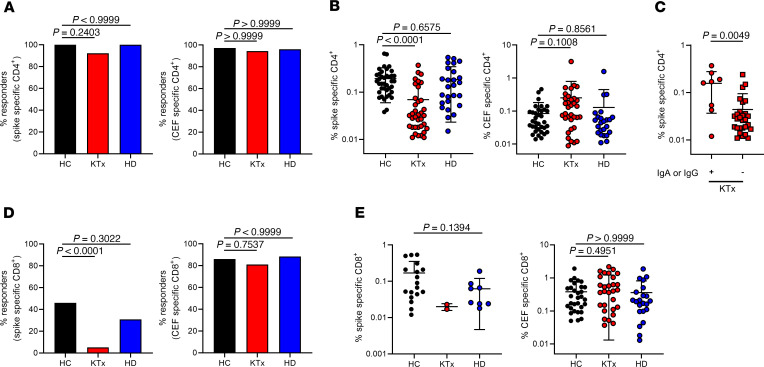
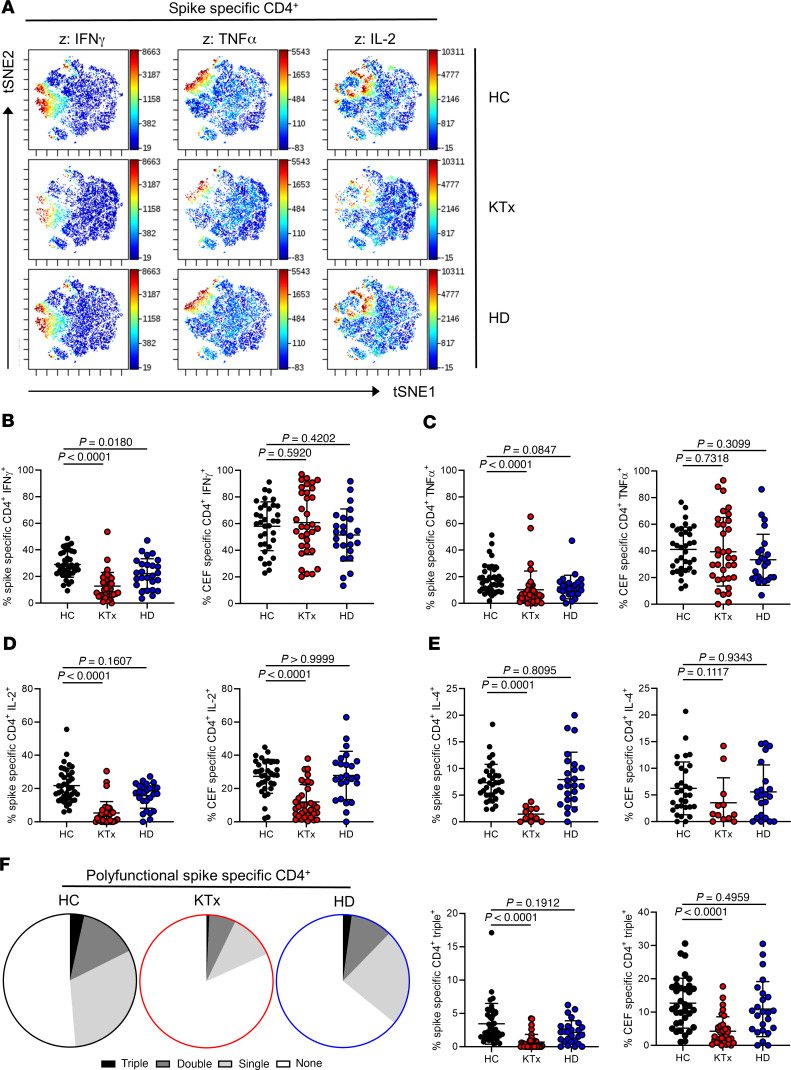
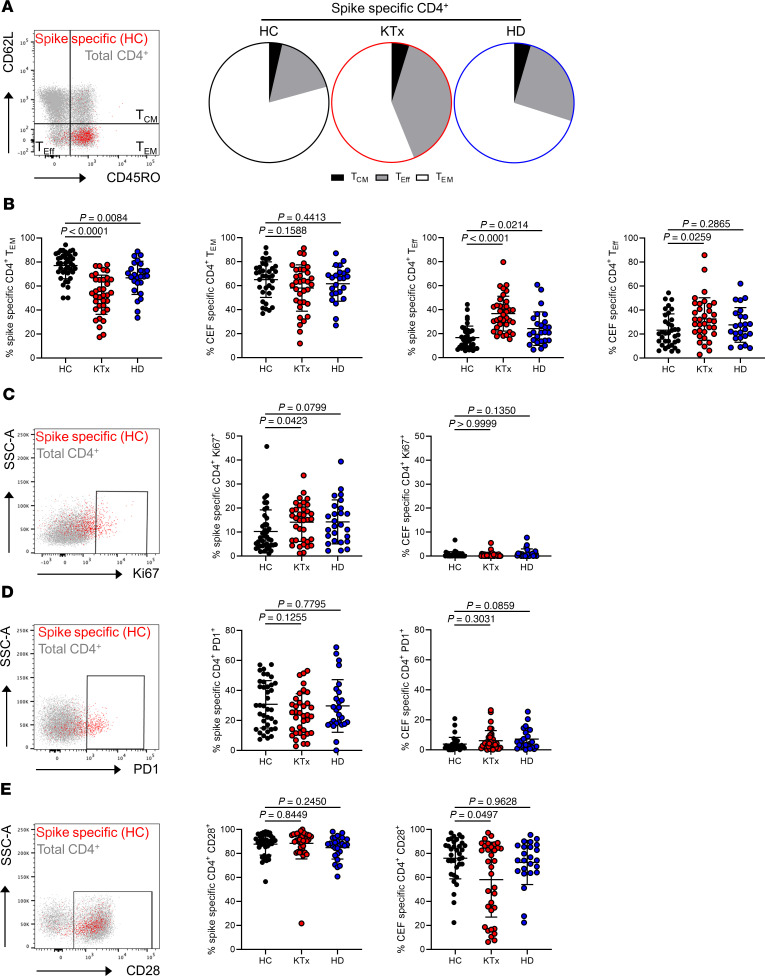
Novel mRNA-based vaccines have been proven to be powerful tools in combating the global pandemic caused by SARS-CoV-2, with BNT162b2 (trade name: Comirnaty) efficiently protecting individuals from COVID-19 across a broad age range. Still, it remains largely unknown how renal insufficiency and immunosuppressive medication affect development of vaccine-induced immunity. We therefore comprehensively analyzed humoral and cellular responses in kidney transplant recipients after the standard second vaccination dose. As opposed to all healthy vaccinees and the majority of hemodialysis patients, only 4 of 39 and 1 of 39 transplanted individuals showed IgA and IgG seroconversion at day 8 ± 1 after booster immunization, with minor changes until day 23 ± 5, respectively. Although most transplanted patients mounted spike-specific T helper cell responses, frequencies were significantly reduced compared with those in controls and dialysis patients and this was accompanied by a broad impairment in effector cytokine production, memory differentiation, and activation-related signatures. Spike-specific CD8+ T cell responses were less abundant than their CD4+ counterparts in healthy controls and hemodialysis patients and almost undetectable in transplant patients. Promotion of anti-HLA antibodies or acute rejection was not detected after vaccination. In summary, our data strongly suggest revised vaccination approaches in immunosuppressed patients, including individual immune monitoring for protection of this vulnerable group at risk of developing severe COVID-19.

Keywords: Adaptive immunity; Immunology; Organ transplantation; T cells; Transplantation.


Conflict of interest statement

Conflict of interest: The authors have declared that no conflict of interest exists.

Figures

Figure 1
Figure 1. Humoral reactivity of vaccinees against SARS-CoV-2 spike protein.
(A) Humoral responder rates were determined based on serum samples collected on day 8 ± 1 after boost being analyzed for spike S1 domain–specific IgG (left, Fisher’s exact test) and IgA (middle, Fisher’s exact test) by ELISA. Surrogate virus neutralization capacity was assessed by a blocking ELISA (right, Fisher’s exact test) with HC (n = 39), KTx (n = 39), and HD (n = 26). (B) Sera of KTx patients available from day 23 ± 5 after boost immunization were retested for reactivity as in A with n = 24. (C) Serological reactivity was quantified only in responding individuals on day 8 ± 1 after boost. IgG, Mann-Whitney U test: HC, n = 39; KTx, n = 1; HD, n = 22. IgA, Kruskal-Wallis test: HC, n = 38; KTx, n = 0; HD, n = 21. Neutralization, Mann-Whitney U test: HC, n = 39; KTx, n = 0; HD, n = 20). NA, not applicable due to nonresponsiveness. Graphs show mean ± SD.
Figure 2
Figure 2. Quantitative features of spike-reactive T cells.
(A) PBMCs were stimulated with spike (left) or CEF (right) peptide mix for 16 hours, as indicated. Specific CD4+ T cells were identified and quantified by FACS based on coexpression of CD154 and CD137. Depicted are percentages of HCs (n = 39), KTx recipients (n = 39), and HD patients (n = 26) with positive CD4+ T cell responses (responders: Fisher’s exact test, respectively). (B) Frequencies of specific Th cells within responders. HC: spike, n = 39; CEF, n = 35; KTx: spike, n = 36; CEF, n = 34; HD: spike, n = 26; CEF, n = 24. Kruskal-Wallis test. (C) Portions of spike-specific Th cells in KTx patients showing IgA and/or IgG responses (+, n = 8) or not (–, n = 31; Mann-Whitney U test) until day 23 ± 5. (D) Antigen-specific CD8+ T cells were identified within PBMCs based on coexpression of CD137 and IFN-γ. Depicted are percentages within HCs (n = 39), KTx recipients (n = 39), and HD patients (n = 26) with positive CD8+ T cell responses (responders) toward spike (left, Fisher’s exact test) or CEF (right, Fisher’s exact test) stimulation. (E) Frequencies of spike-specific (left, Mann-Whitney U test) or CEF-specific CD8+ T cells (right, Kruskal-Wallis test) within responders. HC: spike, n = 18; CEF, n = 31; KTx: spike, n = 2. CEF, n = 30; HD: spike, n = 8; CEF, n = 22. Graphs show mean ± SD.
Figure 3
Figure 3. Functional assessment of vaccine-specific CD4+ Th cells.
(A) Spike-specific CD154+CD137+ Th cells from all groups were concatenated and subjected to unsupervised analysis using tSNE; highlighted (z dimension) are areas with IFN-γ+, TNF-α+, or IL-2+ cells. Spike- or CEF-specific CD154+CD137+ Th cells were further examined after manual gating for expression of (B) IFN-γ (spike/CEF: ANOVA), (C) TNF-α (spike: Kruskal-Wallis test; CEF: ANOVA), (D) IL-2 (spike/CEF: Kruskal-Wallis test) with n as in Figure 2B, respectively, or (E) IL-4 (spike: ANOVA; CEF: Kruskal-Wallis test; HC: spike, n = 35; CEF: n = 31; KTx: spike, n = 11; CEF, n = 12; HD: spike, n = 24; CEF: n = 22). (F) Portions (left) of spike-specific T cells expressing 3, 2, 1, or 0 cytokines at a time based on the respective mean values of each group or (right) frequencies of spike- or CEF-specific Th cells staining triple positive for IFN-γ, TNF-α, and IL-2 with n as in Figure 2B and Kruskal-Wallis testing, respectively. IL-4 was excluded from polyfunctionality analyses due to the limited sample size in the KTx group. Graphs show mean ± SD.
Figure 4
Figure 4. Characteristics of the spike-specific Th cell response with respect to memory formation and ex vivo proliferation/activation.
Spike- or CEF-specific CD154+CD137+ Th cells were assessed for their memory or effector phenotype with CD45RO+CD62L identifying TEM, CD45RO+CD62L+ central memory (TCM), and CD45ROCD62L effector-like T cells (TEff). (A) Exemplary staining of spike-specific vs. total Th cells from a healthy donor (left) and subset comparison based on the respective mean values for each group (right). (B) Data of spike- and CEF-specific TEM (left panels; spike/CEF: ANOVA) and TEff (right panels; spike/CEF: ANOVA) with n as in Figure 2B. Antigen-specific Th cells were further characterized for (C) ex vivo proliferation based on Ki67 expression (spike/CEF: Kruskal-Wallis test), (D) expression of the activation/exhaustion marker PD1 (spike: ANOVA, CEF: Kruskal-Wallis test), or (E) costimulatory receptor CD28 (spike/CEF: Kruskal-Wallis test) with exemplary overlays of spike-specific vs. total T cells (left) and summarized data for all groups (right) with n as in Figure 2B. SSC-A, side scatter area. Graphs show mean ± SD.
Figure 5
Figure 5. Analysis of differentially expressed genes in vaccine-specific Th cells.
(A) Volcano plots depicting the –log10 FDR value and log2 fold changes of all expressed genes for comparisons of KTx patients vs. HCs (left) and HD patients vs. HCs (right). Thresholds for the FDR of 0.01 (P) and for the absolute log2 fold change of 1 are indicated by dotted lines; genes passing 0 (NS – not significant), 1, or both filters are color coded. Exemplary genes involved in cellular activation are annotated. (B) Enrichment scores and FDR values for different hallmark gene sets. Direction of the enrichment scores indicates up- or downregulation in the respective comparison. KTx, n = 3; HD, n = 4; HCs, n = 4.

Comment in

References

    1. Kato S, et al. Aspects of immune dysfunction in end-stage renal disease. Clin J Am Soc Nephrol. 2008;3(5):1526–1533. doi: 10.2215/CJN.00950208. - DOI - PMC - PubMed
    1. Blazquez-Navarro A, et al. BKV, CMV, and EBV interactions and their effect on graft function one year post-renal transplantation: results from a large multi-centre study. EBioMedicine. 2018;34:113–121. doi: 10.1016/j.ebiom.2018.07.017. - DOI - PMC - PubMed
    1. Ravanan R, et al. SARS-CoV-2 infection and early mortality of waitlisted and solid organ transplant recipients in England: A national cohort study. Am J Transplant. 2020;20(11):3008–3018. doi: 10.1111/ajt.16247. - DOI - PMC - PubMed
    1. Ng JH, et al. Outcomes of patients with end-stage kidney disease hospitalized with COVID-19. Kidney Int. 2020;98(6):1530–1539. doi: 10.1016/j.kint.2020.07.030. - DOI - PMC - PubMed
    1. Jager KJ, et al. Results from the ERA-EDTA Registry indicate a high mortality due to COVID-19 in dialysis patients and kidney transplant recipients across Europe. Kidney Int. 2020;98(6):1540–1548. doi: 10.1016/j.kint.2020.09.006. - DOI - PMC - PubMed

Publication types

MeSH terms