. 2021 Jul 15;131(14):e147025.
doi: 10.1172/JCI147025.

FOXA1 overexpression suppresses interferon signaling and immune response in cancer

Affiliations

FOXA1 overexpression suppresses interferon signaling and immune response in cancer

Yundong He et al. J Clin Invest. .

Abstract

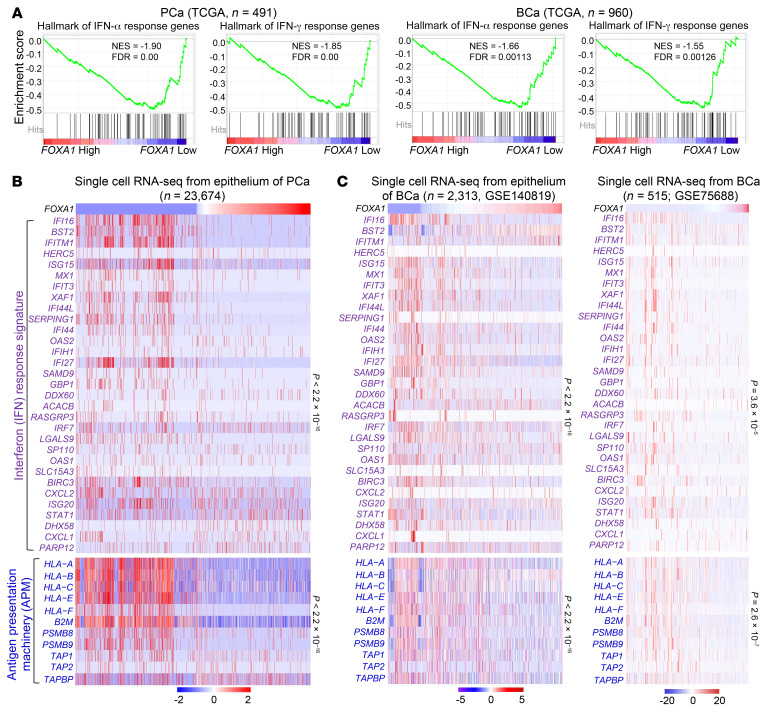
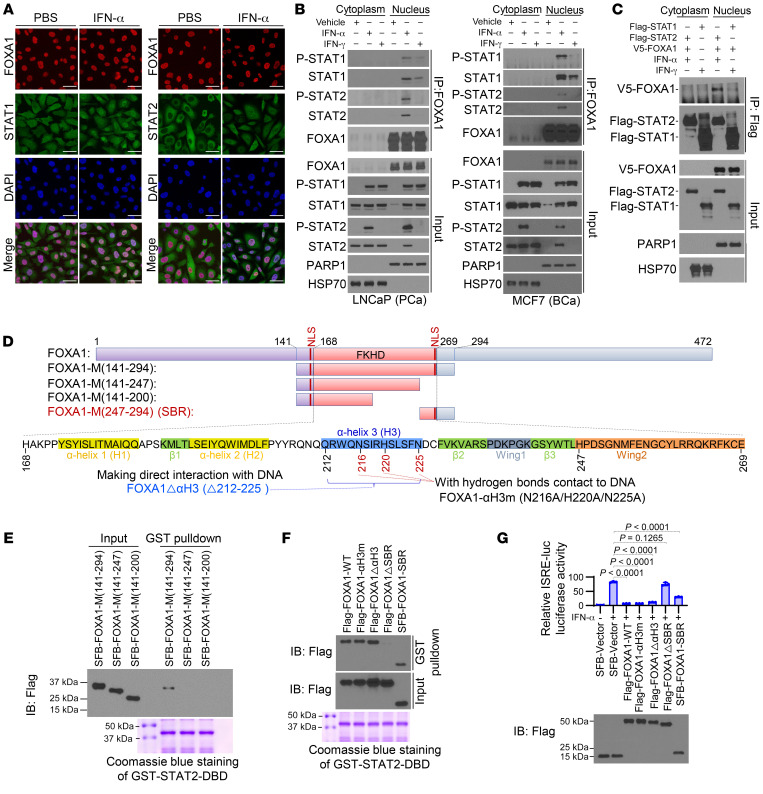
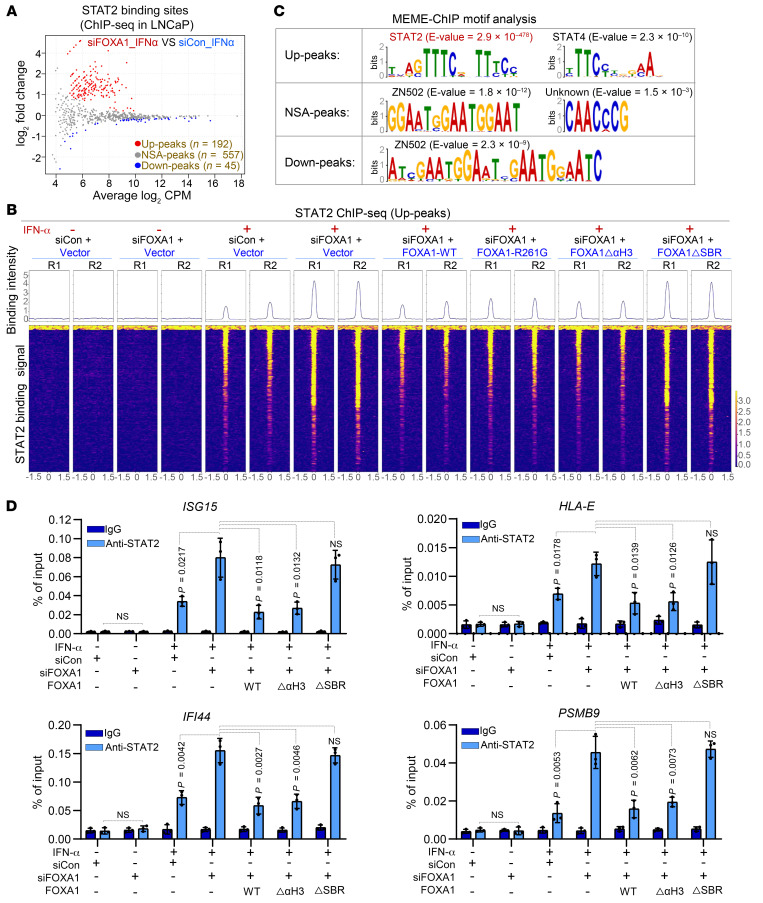
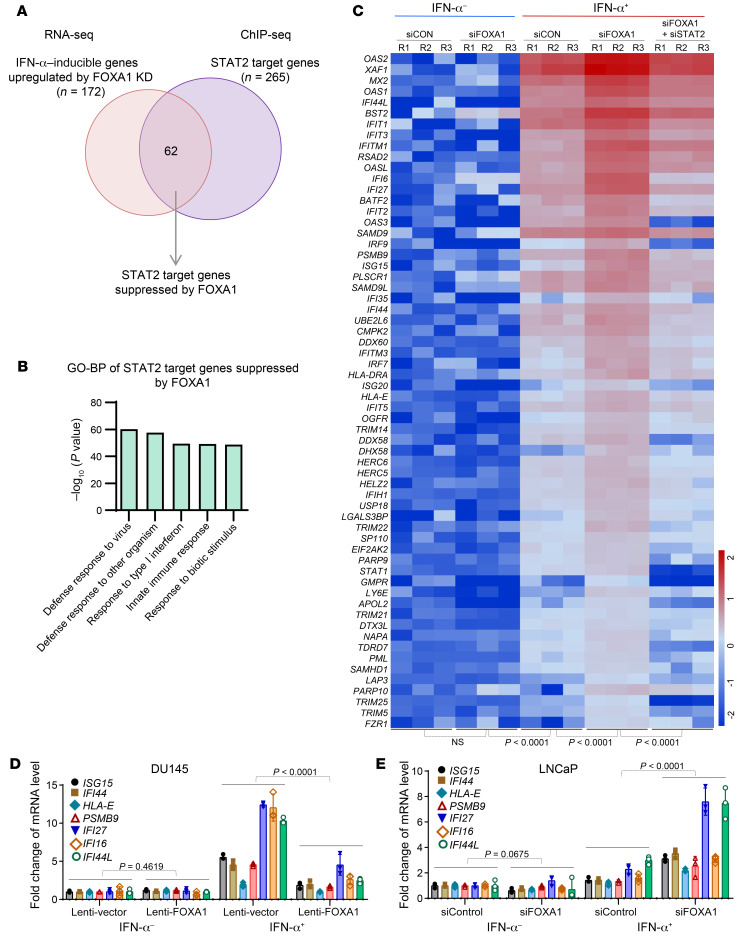
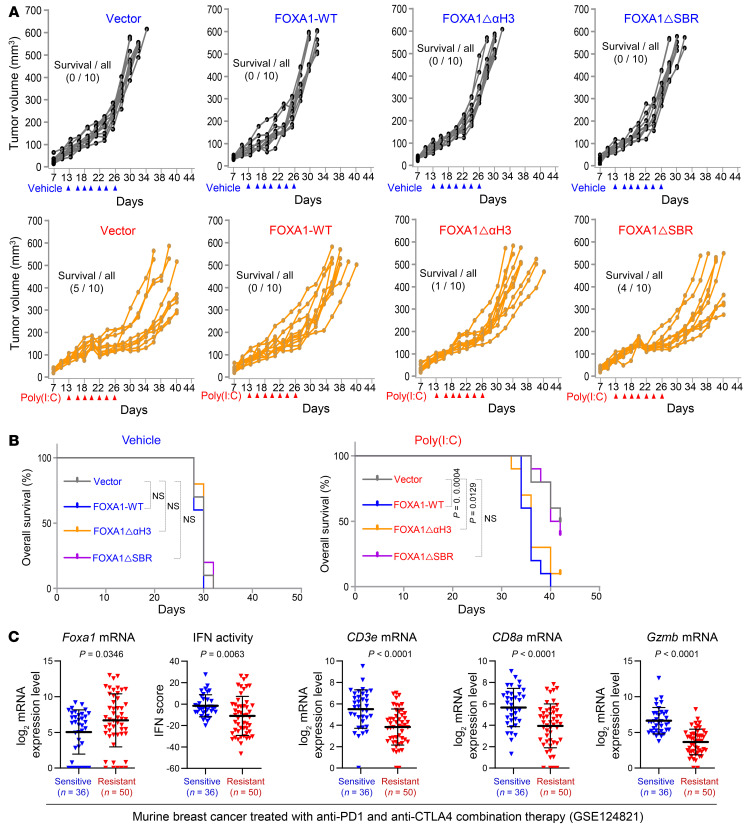
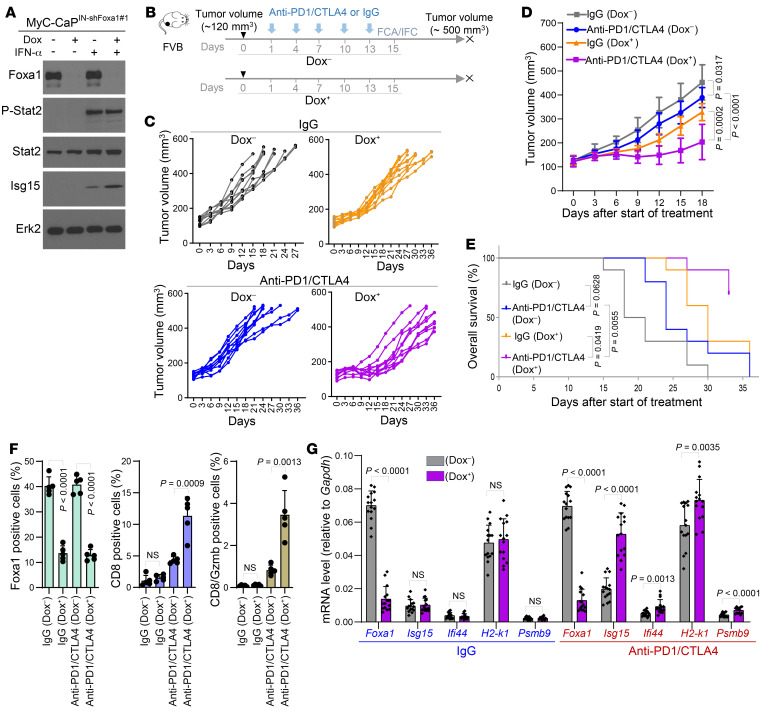
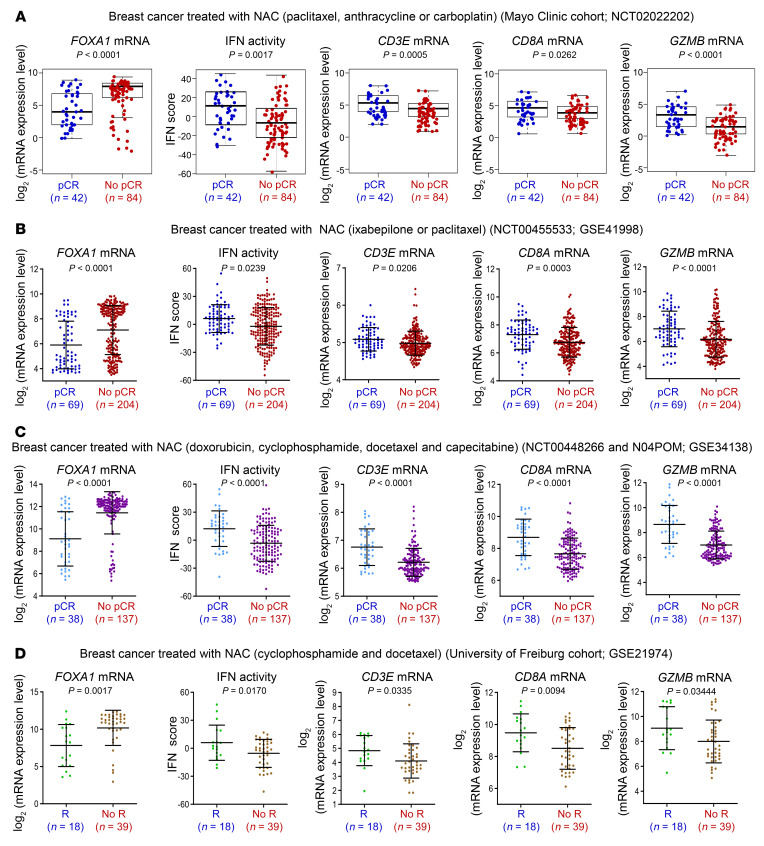
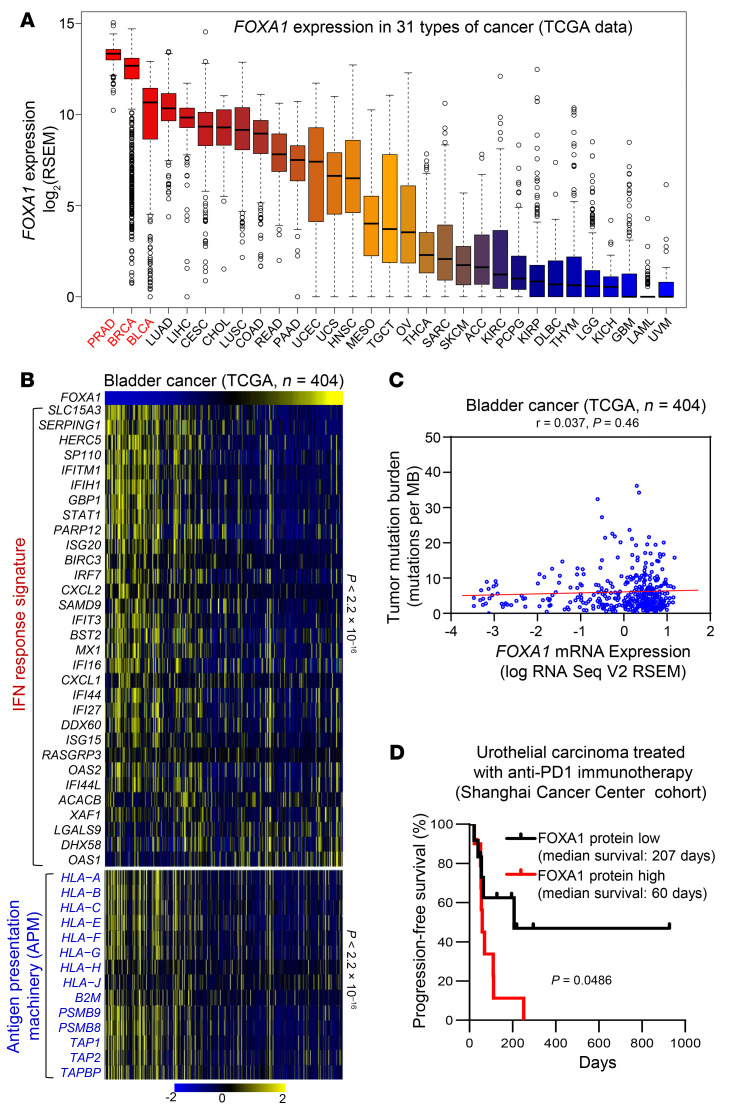
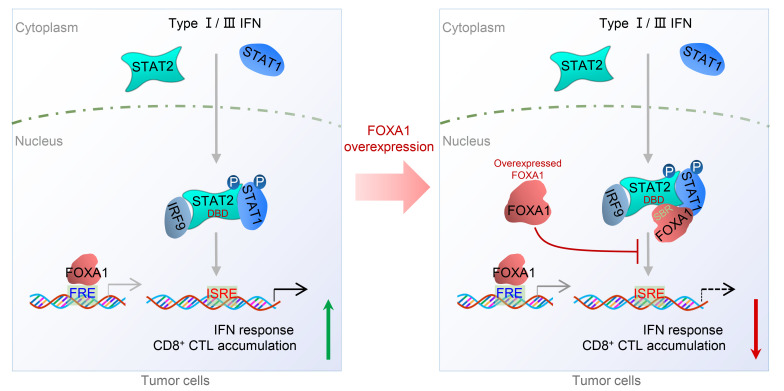
Androgen receptor-positive prostate cancer (PCa) and estrogen receptor-positive luminal breast cancer (BCa) are generally less responsive to immunotherapy compared with certain tumor types such as melanoma. However, the underlying mechanisms are not fully elucidated. In this study, we found that FOXA1 overexpression inversely correlated with interferon (IFN) signature and antigen presentation gene expression in PCa and BCa patients. FOXA1 bound the STAT2 DNA-binding domain and suppressed STAT2 DNA-binding activity, IFN signaling gene expression, and cancer immune response independently of the transactivation activity of FOXA1 and its mutations detected in PCa and BCa. Increased FOXA1 expression promoted cancer immuno- and chemotherapy resistance in mice and PCa and BCa patients. These findings were also validated in bladder cancer expressing high levels of FOXA1. FOXA1 overexpression could be a prognostic factor to predict therapy resistance and a viable target to sensitize luminal PCa, BCa, and bladder cancer to immuno- and chemotherapy.

Keywords: Cancer; Cancer immunotherapy; Cell Biology; Molecular biology; Therapeutics.


Conflict of interest statement

Conflict of interest: The authors have declared that no conflict of interest exists.

Figures

Figure 1
Figure 1. FOXA1 levels inversely correlate with IFN signaling gene expression in prostate (PCa) and breast cancer (BCa).
(A) GSEA enrichment plots show the inverse correlation between FOXA1 expression and IFN response hallmark genes in PCa and BCa from TCGA database. The FOXA1-high and -low groups were defined using the median as the cutoff. (B and C) Heatmaps show the inverse correlation of FOXA1 expression with IFN response signature genes and APM genes in single-cell RNA-seq data of PCa (B) and BCa (C) samples. Statistical significance was determined by Pearson’s correlation test.
Figure 2
Figure 2. FOXA1 binds the STAT2 DBD and impedes STAT2 DNA-binding ability.
(A) Immunofluorescent cytochemical analysis of STAT1, STAT2, and FOXA1 in LNCaP cells treated with vehicle (PBS) or IFN-α. (B) Co-IP shows the interaction of FOXA1 with STAT1 and STAT2 at endogenous levels in LNCaP and MCF7 cells treated with IFN-α or IFN-γ. See complete unedited blots in the supplemental material. (C) Co-IP analysis of interaction among ectopically expressed FOXA1, STAT1, and STAT2 proteins in 293T cells. (D) Diagram shows the domain structure of the FOXA1 forkhead (FKHD) DNA-binding domain (DBD) and FOXA1 truncation and missense mutation expression constructs. NLS, nuclear localization signal; SBR, STAT2-binding region. (E and F) GST pulldown assay shows the interaction of GST-tagged STAT2 DBD with the indicated FOXA1 mutants expressed in 293T cells. ΔαH3, deletion of α-helix 3; ΔSBR, deletion of STAT2-binding region. (G) Luciferase reporter assay shows the inhibitory effect of the indicated WT FOXA1 or mutants on ISRE-luc reporter gene activity in DU145 cells. Data shown as mean ± SD (n = 3). Statistical significance was determined by 1-way ANOVA with Bonferroni’s correction for multiple tests.
Figure 3
Figure 3. The effect of FOXA1 on STAT2 cistrome in PCa cells.
(A) MA plot of STAT2 ChIP-seq data in LNCaP cells transfected with control (siCon) or FOXA1-specific siRNAs in the presence or absence of IFN-α treatment. Red dots (Up-peaks) and blue dots (Down-peaks) represent increased and decreased peaks (FDR < 0.05), respectively, and gray dots indicate peaks with no significant alterations (NSAs) (FDR > 0.05) after FOXA1 KD. (B) Heatmaps show the signaling intensity of 192 STAT2 ChIP-seq Up-peaks in LNCaP cells under the indicated cellular conditions. (C) MEME-ChIP DNA motif analysis in 192 STAT2 ChIP-seq Up-peaks, 557 NSA-peaks, and 45 Down-peaks caused by FOXA1 KD in LNCaP cells. (D) ChIP-qPCR analysis of STAT2 occupancy at genomic loci of STAT2 target genes ISG15, IFI44, HLA-E, and PSMB9 under the indicated cellular conditions. Data shown as mean ± SD (n = 3). Statistical significance was determined by 1-way ANOVA with Bonferroni’s correction for multiple tests.
Figure 4
Figure 4. Identification of IFN-α response genes suppressed by FOXA1.
(A) Venn diagram showing the overlap of IFN-α–stimulated genes upregulated by FOXA1 KD with the STAT2 target genes identified by STAT2 ChIP-seq. (B) GO-BP pathway analysis of the 62 STAT2 target genes suppressed by FOXA1. (C) Heatmap shows the differential expression of the 62 STAT2 target genes suppressed by FOXA1 in LNCaP cells under the indicated cellular conditions. (D and E) RT-qPCR analysis of expression of STAT2 target genes ISG15, IFI44, HLA-E, PSMB9, IFI27, IFI16, and IFI44L in FOXA1-negative DU145 cells infected with lentivirus expressing vector or FOXA1 (D) and in FOXA1-high LNCaP cells transfected control or FOXA1-specific siRNAs (E). Data shown as mean ± SD (n = 3). Statistical significance was determined by 1-way ANOVA.
Figure 5
Figure 5. FOXA1 overexpression suppresses PCa immune response in mice.
(A) Growth of TRAMP-C2 prostate tumors stably expressing vector, WT FOXA1, FOXA1ΔαH3, or FOXA1ΔSBR treated with vehicle or poly(I:C) at the indicated time points (arrowheads) in C57BL/6 mice. (B) Tumor-free survival of syngeneic mice bearing TRAMP-C2 tumors stably expressing vector, WT FOXA1, FOXA1ΔαH3, or FOXA1ΔSBR treated with vehicle or poly(I:C). Statistical significance was determined by log-rank (Mantel-Cox) test. (C) Analysis of RNA-seq data from a cohort of murine BCa (GSE124821) showing the association of high expression of Foxa1 and low expression of IFN response genes (IFN activity) and CD3e, CD8a, and Gzmb T cell marker genes with the responsiveness to anti–PD-1 and anti-CTLA4 combination therapy (resistant versus sensitive). Statistical comparison was done using Mann-Whitney U test.
Figure 6
Figure 6. Foxa1 knockdown sensitizes murine PCa to anti–PD-1 and anti-CTLA4 combination therapy.
(A) Western blot analysis of indicated proteins in MyC-CaP murine PCa cells stably expressing doxycycline-inducible lentiviral shFoxa1#1 (MyC-CaPIN-shFoxa1#1) and treated with or without doxycycline (Dox) or/and IFN-α. Erk2 served as a loading control. (B) Schematic diagram of generation and anti–PD-1/anti-CTLA4 treatment of MyC-CaPIN-shFoxa1#1 prostate tumors in syngeneic mice. Dox, without doxycycline treatment; Dox+, with doxycycline treatment; FCA, flow cytometric analysis; IFC, immunofluorescent cytochemistry. (C and D) Growth of MyC-CaPIN-shFoxa1#1 prostate tumors treated with IgG or combination of anti–PD-1/anti-CTLA4 at the indicated time points (arrowheads) in FVB mice (n = 10 mice/group). Statistical significance was determined by 2-way ANOVA. (E) Tumor-free survival of syngeneic mice bearing MyC-CaPIN-shFoxa1#1 prostate tumors treated with IgG or anti–PD-1/anti-CTLA4 (n = 10 mice/group). Statistical significance was determined by log-rank (Mantel-Cox) test. (F) Flow cytometric analysis of Foxa1-, CD8-, and Gzmb-positive cells in MyC-CaPIN-shFoxa1#1 tumors from mice 2 days after the last administration of IgG or anti–PD-1/anti-CTLA4. Data are shown in the bar graphs as mean ± SD (n = 5 mice/group). Statistical significance was determined by 1-way ANOVA with Bonferroni’s correction for multiple tests. (G) RT-qPCR analysis of Foxa1 and murine Stat2 target genes Isg15, Ifi44, H2-k1, and Psmb9 in MyC-CaPIN-shFoxa1#1 tumors from mice 2 days after the last administration of IgG or anti–PD-1/anti-CTLA4. The data are presented as the mean ± SD (n = 5 mice/group). Statistical significance was determined by 1-way ANOVA with Bonferroni’s correction for multiple tests.
Figure 7
Figure 7. FOXA1 overexpression associates with resistance of neoadjuvant chemotherapy (NAC) in cancer.
(AC) Analysis of RNA-seq data from a cohort of 126 BCa patients at the Mayo Clinic (A) and microarray data from 2 independent cohorts of BCa (GSE41998 and GSE34138) (B and C) showing the association of high expression of FOXA1 and low expression of IFN response genes (IFN activity) and CD3E, CD8A, and GZMB T cell marker genes with the responsiveness to NAC (No-pCR versus pCR). pCR, pathological complete response; No-pCR, no pathological complete response. Statistical comparison was done using Mann-Whitney U test. (D) Analysis of microarray data from a cohort of BCa (GSE21974) showing the association of high expression of FOXA1 and low expression of IFN response genes (IFN activity) and CD3E, CD8A, and GZMB T cell marker genes with the responsiveness to NAC (No-R versus R). R, response; No-R, no response. Statistical comparison was done using Mann-Whitney U test.
Figure 8
Figure 8. FOXA1 confers immunotherapy resistance in bladder cancer.
(A) Comparison of FOXA1 mRNA level among 31 cancer types in TCGA database, including PRAD (prostate adenocarcinoma), BRCA (breast invasive carcinoma), BLCA (bladder urothelial carcinoma), LUAD (lung adenocarcinoma), LIHC (liver hepatocellular carcinoma), CESC (cervical squamous cell carcinoma and endocervical adenocarcinoma), CHOL (cholangiocarcinoma), LUSC (lung squamous cell carcinoma), COAD (colon adenocarcinoma), READ (rectum adenocarcinoma), PAAD (pancreatic adenocarcinoma), UCEC (uterine corpus endometrial carcinoma), UCS (uterine carcinosarcoma), HNSC (head and neck squamous cell carcinoma), MESO (mesothelioma), TGCT (testicular germ cell tumors), OV (ovarian serous cystadenocarcinoma), THCA (thyroid carcinoma), SARC (sarcoma), SKCM (skin cutaneous melanoma), ACC (adrenocortical carcinoma), KIRC (kidney renal clear cell carcinoma), PCPG (pheochromocytoma and paraganglioma), KIRP (kidney renal papillary cell carcinoma), DLBC (lymphoid neoplasm diffuse large B-cell lymphoma), THYM (thymoma), LGG (brain lower grade glioma), KICH (kidney chromophobe), GBM (glioblastoma multiforme), LAML (acute myeloid leukemia), and UVM (uveal melanoma). (B) Heatmaps show the negative correlation of FOXA1 expression with the expression levels of IFN response signature genes and APM genes in TCGA cohort of bladder cancers. Samples are ranked based on FOXA1 transcript levels. Statistical significance was determined by Pearson’s correlation test. (C) The correlation between FOXA1 level and TMB in TCGA cohort of bladder cancers. Statistical significance was determined by Pearson’s correlation test. (D) Progression-free survival of patients with FOXA1-low or -high urothelial carcinomas treated with anti–PD-1 immunotherapy. Statistical significance was determined by log-rank (Mantel-Cox) test. See also Supplemental Figure 18 and Supplemental Table 3 for FOXA1 IHC staining and patient clinical information, respectively.
Figure 9
Figure 9. A hypothetical model deciphering FOXA1 overexpression–mediated suppression of IFN signaling and cancer immune response.
Upon stimulation of cells with type I/III IFNs, STAT1 and STAT2 proteins are phosphorylated, dimerize (STAT2-STAT1 heterodimer), and translocate into the nucleus to initiate the transcription of IFN-stimulated genes (ISGs) by binding to the ISRE and ultimately promote cancer immune response (left). However, in FOXA1-overexpressing tumor cells, the overexpressed FOXA1 protein, in a manner independent of its binding to chromatin DNA, reduces the accessibility of the STAT protein complex and impairs ISG expression, thereby suppressing cancer immune response (right). FRE, forkhead response element; ISRE, IFN stimulation response element; CTL, cytotoxic T lymphocyte; DBD, DNA-binding domain; SBR, STAT2-binding region; P, phosphorylation.

References

    1. Wei SC, et al. Fundamental mechanisms of immune checkpoint blockade therapy. Cancer Discov. 2018;8(9):1069–1086. doi: 10.1158/2159-8290.CD-18-0367. - DOI - PubMed
    1. Rescigno P, de Bono JS. Immunotherapy for lethal prostate cancer. Nat Rev Urol. 2019;16(2):69–70. doi: 10.1038/s41585-018-0121-y. - DOI - PubMed
    1. Esteva FJ, et al. Immunotherapy and targeted therapy combinations in metastatic breast cancer. Lancet Oncol. 2019;20(3):e175–e186. doi: 10.1016/S1470-2045(19)30026-9. - DOI - PubMed
    1. Samstein RM, et al. Tumor mutational load predicts survival after immunotherapy across multiple cancer types. Nat Genet. 2019;51(2):202–206. doi: 10.1038/s41588-018-0312-8. - DOI - PMC - PubMed
    1. Liu D, et al. Integrative molecular and clinical modeling of clinical outcomes to PD1 blockade in patients with metastatic melanoma. Nat Med. 2019;25(12):1916–1927. doi: 10.1038/s41591-019-0654-5. - DOI - PMC - PubMed

Publication types