. 2021 Jun 8;16(6):e0252036.
doi: 10.1371/journal.pone.0252036. eCollection 2021.

Age-related changes in diffuse optical tomography sensitivity profiles in infancy

Affiliations

Age-related changes in diffuse optical tomography sensitivity profiles in infancy

Xiaoxue Fu et al. PLoS One. .

Abstract

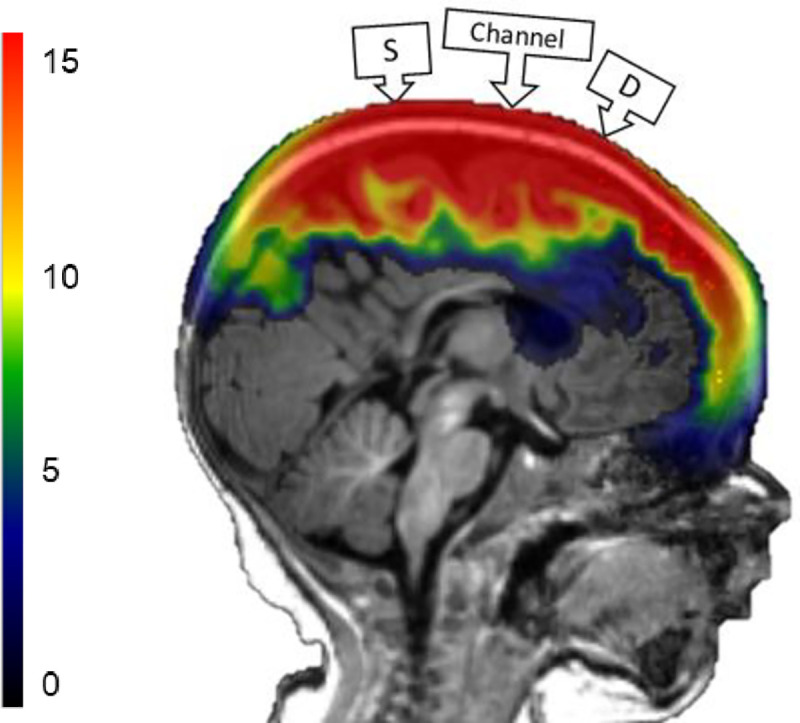
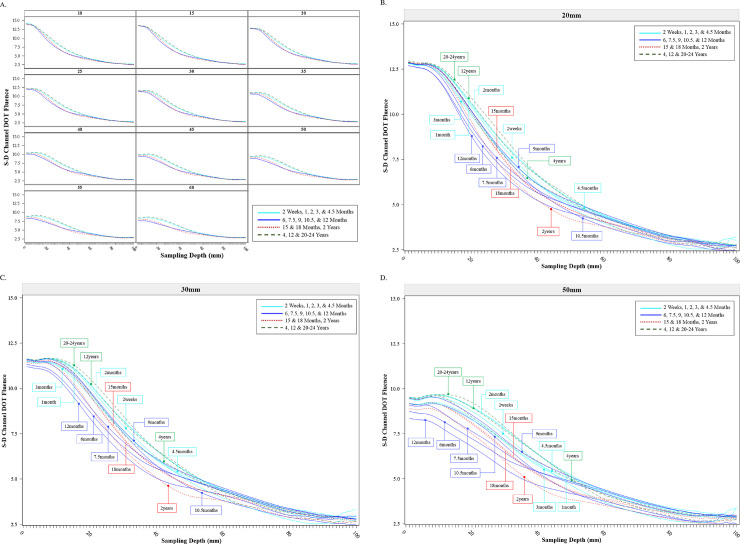
Diffuse optical tomography uses near-infrared light spectroscopy to measure changes in cerebral hemoglobin concentration. Anatomical interpretations of the location that generates the hemodynamic signal requires accurate descriptions of diffuse optical tomography sensitivity to the underlying cortical structures. Such information is limited for pediatric populations because they undergo rapid head and brain development. The present study used photon propagation simulation methods to examine diffuse optical tomography sensitivity profiles in realistic head models among infants ranging from 2 weeks to 24 months with narrow age bins, children (4 and 12 years) and adults (20 to 24 years). The sensitivity profiles changed systematically with the source-detector separation distance. The peak of the sensitivity function in the head was largest at the smallest separation distance and decreased as separation distance increased. The fluence value dissipated more quickly with sampling depth at the shorter source-detector separations than the longer separation distances. There were age-related differences in the shape and variance of sensitivity profiles across a wide range of source-detector separation distances. Our findings have important implications in the design of sensor placement and diffuse optical tomography image reconstruction in (functional) near-infrared light spectroscopy research. Age-appropriate realistic head models should be used to provide anatomical guidance for standalone near-infrared light spectroscopy data in infants.


Conflict of interest statement

The authors have declared that no competing interests exist.

Figures

Fig 1
Fig 1. Segmented head MRI volumes.
The examples were taken from the same 3-month-old infant MRI. A. The segmented head model. Aqua is the scalp, green is the non-bone structure (muscle, sinew, fat), gold is the nasal and mouth air cavities, turquoise is the skull, light blue is the dura, orange is the cerebrospinal fluid, dark blue is the gray matter, and purple is the white matter. B. The segmented head model with dense finite element (FE) mesh.
Fig 2
Fig 2. Virtual optodes placement.
A. Virtual optodes placement on the standard 10–10 electrode system. From left to right: a three-month individual head model, an average template for three-month-old’s, and a two-dimensional layout of the 10–10 system). Ten-ten electrodes were divided into six groups for visualization purposes. The six groups were color-coded on the two-dimensional schematic of the 10–10 system. Group 1: electrodes on the central curve (Nz-Cz-Iz). Group 2: electrodes on the left curve between Nz and Iz (N1-LPA/T9-I1). Group 3: electrodes on the right curve between Nz and Iz (N2-RPA/T10-I2). Group 4: electrodes on the left curve between Fpz and Oz (Fp1-T7-O1). Group 5: electrodes on the right curve between Fpz and Oz (Fp2-T8-O2). Group 6: the remaining electrodes enclosed by the central curve, the left and right curves between Fpz and Oz. B. Virtual optodes placement on the 10–5 electrode system. From left to right: the same three-month individual head model and the three-month average template.
Fig 3
Fig 3. Source-detector (S-D) channel DOT fluence distribution.
Monte Carlo photon migration simulations were used to estimate fluence distributions. The red area represents greater fluence.
Fig 4
Fig 4. Source-detector (S-D) channel DOT fluence sensitivity profile by channels.
Four example individuals were selected, one from each age category. The S-D Channel DOT fluence value was plotted as a function of the sampling depth separately for channels at the source-detector separation distances for 20 mm and 50 mm for everyone. For each participant and each channel with the target separation distance, we computed the S-D Channel DOT fluence and the distance from the channel location to the voxel with the fluence estimation (“sampling depth”).
Fig 5
Fig 5. Source-detector (S-D) channel DOT fluence sensitivity profile by age groups.
The S-D Channel DOT fluence value was plotted as a function of the sampling depth, defined as the distance (depth) from the channel location to the voxel location in the head model where the S-D channel DOT fluence was measured. A. S-D Channel DOT fluence sensitivity function at each target source-detector separation distances. For visualization, we created four age categories: 2 weeks to 4.5 months, 6 months to 12 months, 15 months to 2 years, and 4 years to 20–24 years. Mean values by each age category are displayed. B. S-D Channel DOT fluence sensitivity function by individual age categories at 20 mm source-detector separation distance. C. S-D Channel DOT fluence sensitivity function by individual age categories at 30 mm separation distance. D. S-D Channel DOT fluence sensitivity function by individual age categories at 50 mm separation distance.
Fig 6
Fig 6. Variance of source-detector (S-D) channel DOT fluence sensitivity profile.
This is the standard error of the S-D Channel DOT fluence value as a function of the sampling depth, defined as the distance (depth) from the channel location to the voxel location in the head model where the S-D channel DOT fluence was measured. A. Standard error of the S-D Channel DOT fluence sensitivity function averaged by the age categories. B. Standard error of the S-D Channel DOT fluence sensitivity function by individual age groups at 20 mm source-detector separation distance.
Fig 7
Fig 7. Half-width half-maximum (HWHM) locations of source-detector (S-D) channel fluence as a function of source-detector separation distances.
The figure shows age-related differences in how the shape of the S-D Channel DOT sensitivity profile changes with separation distances. The HWHM location was defined as the point in the fluence distribution at which the fluence first dropped below half of the maximum value. A. HWHM locations by source-detector separation distances for individual age groups. B. Mean HWHM locations by source-detector separation distances for the four age categories: 2 weeks to 4.5 months, 6 months to 12 months, 15 months to 2 years, and 4 years to 24 years.

References

    1. Huppert T. J., Franceschini M. A., & Boas D. A. (2009). Noninvasive Imaging of Cerebral Activation with Diffuse Optical Tomography. In Frostig R. D. (Ed.), In Vivo Optical Imaging of Brain Function (2nd ed.). CRC Press/Taylor & Francis. - PubMed
    1. Custo A., Boas D. A., Tsuzuki D., Dan I., Mesquita R., Fischl B., et al.. (2010). Anatomical atlas-guided diffuse optical tomography of brain activation. Neuroimage, 49(1), 561–567. doi: 10.1016/j.neuroimage.2009.07.033 - DOI - PMC - PubMed
    1. Strangman G., Li Z., & Zhang Q. (2013). Depth Sensitivity and Source-Detector Separations for Near Infrared Spectroscopy Based on the Colin27 Brain Template. PLOS ONE, 8(8), e66319. doi: 10.1371/journal.pone.0066319 - DOI - PMC - PubMed
    1. Boas D. A., Culver J. P., Stott J. J., & Dunn A. K. (2002). Three dimensional Monte Carlo code for photon migration through complex heterogeneous media including the adult human head. Opt Express, 10, 159–170. doi: 10.1364/oe.10.000159 - DOI - PubMed
    1. Cooper R. J., Caffini M., Dubb J., Fang Q., Custo A., Tsuzuki D., et al.. (2012). Validating atlas-guided DOT: a comparison of diffuse optical tomography informed by atlas and subject-specific anatomies. Neuroimage, 62(3), 1999–2006. doi: 10.1016/j.neuroimage.2012.05.031 - DOI - PMC - PubMed

Publication types