

Relationship of transitional regulatory B and regulatory T cells and immunosuppressive drug doses in stable renal transplant recipients
- PMID: 34102006
- PMCID: PMC8589411
- DOI: 10.1002/iid3.473
Relationship of transitional regulatory B and regulatory T cells and immunosuppressive drug doses in stable renal transplant recipients
Abstract
Objectives: Regulatory B cells (Bregs) and T cells (Tregs) are thought to be involved in the regulation of graft acceptance in renal transplant recipients. However, mechanisms that affect Breg differentiation and interaction with Tregs are rather unclear.
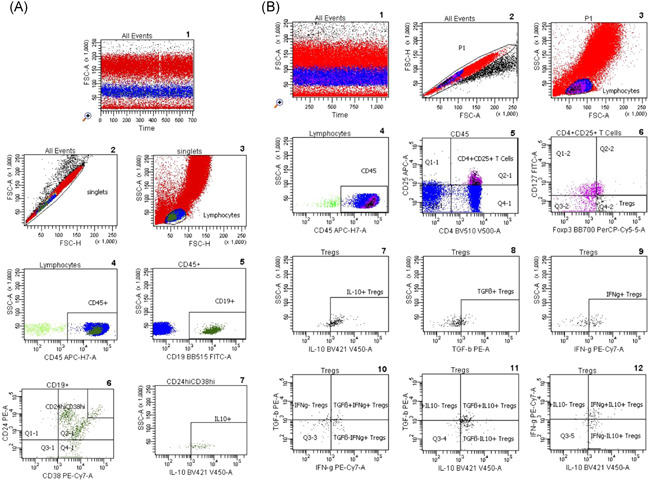
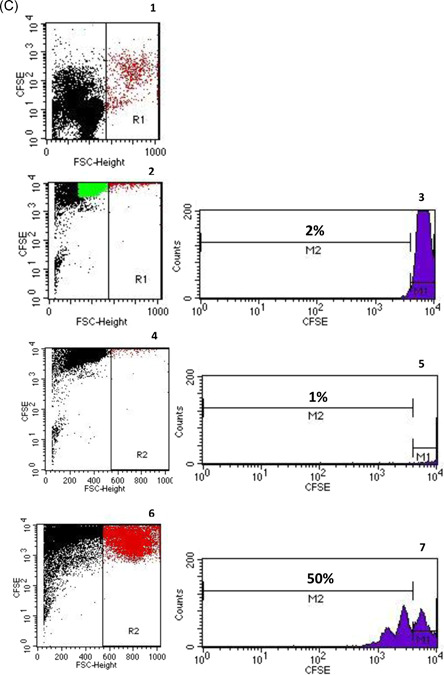
Methods: Using eight-color-fluorescence flow cytometry, Tregs and CD19+ CD24hiCD38hi Bregs were analyzed in whole blood samples of 80 stable kidney transplant recipients, 20 end-stage renal disease (ESRD) patients and 32 healthy controls (HC). In addition, differentiation of Bregs and Tregs was studied in different micromilieus using cocultures with strongly enriched B-lymphocytes and autologous peripheral blood mononuclear cells stimulated with CpG and phytohemagglutinin.
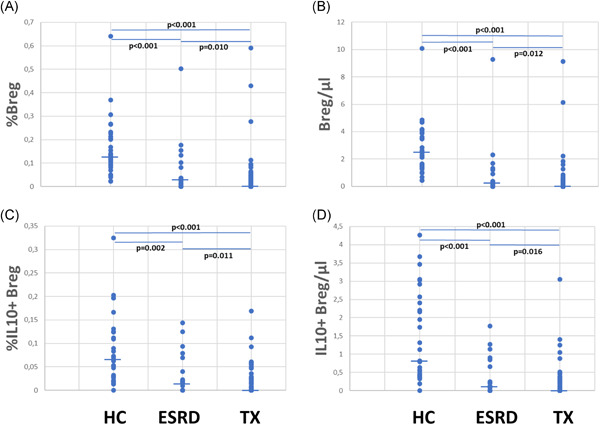
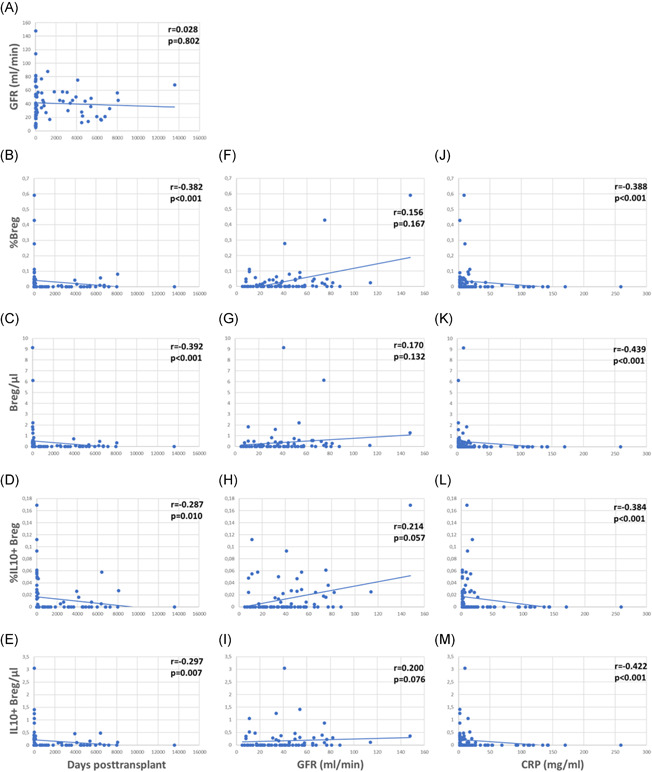
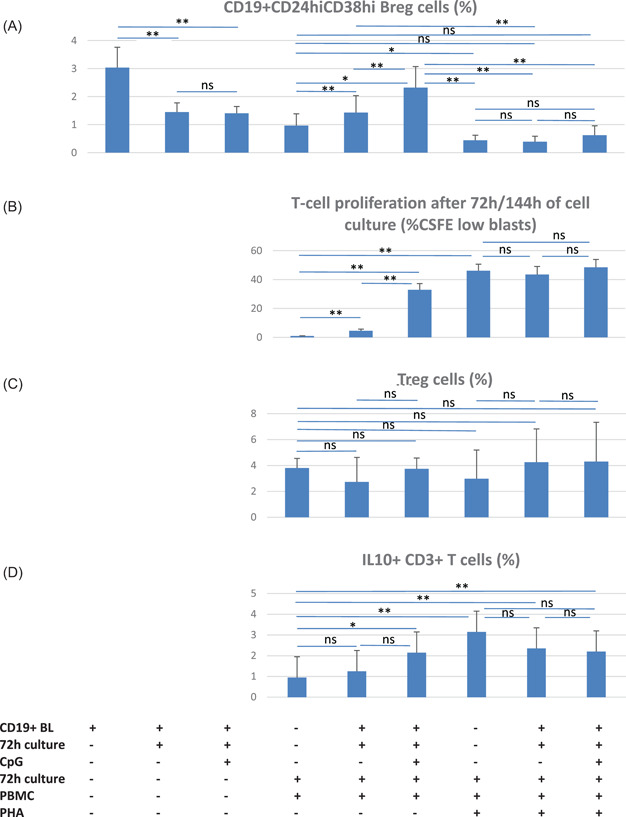
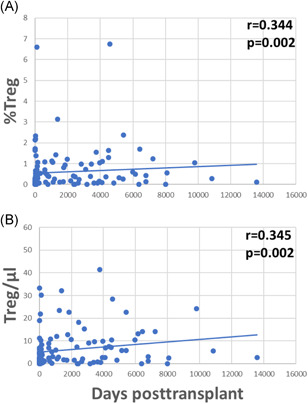
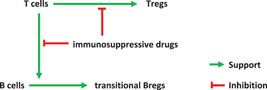
Results: Bregs were higher in HC than in ESRD patients and lowest in transplant recipients. Bregs were higher early as compared to late posttransplant. Posttransplant, high Bregs were associated with higher glomerular filtration rate (GFR) and lower C-reactive protein (CRP). Higher doses and blood levels of ciclosporine, tacrolimus, and mycophenolate mofetil as well as higher doses of steroids were not associated with low Bregs. In contrast, most Treg subsets were lower when blood levels of ciclosporine, tacrolimus, and mycophenolate mofetil were higher. Tregs were not associated with Bregs, GFR, CRP plasma levels, and occurrence of rejection or infection. In vitro, differentiation of Bregs was strongly dependent on T cell support and was blocked by excessive or lacking T-cell help. Tregs were not associated with Breg numbers in vitro.
Conclusion: Bregs appear to be insensitive to high doses of posttransplant immunosuppressive drugs. The protracted Breg decrease posttransplant might be caused by impaired T cell support attributable to immunosuppressive drugs.
Keywords: Foxp3; IL10; Tregs; blood; cell culture; immunoregulation; immunosuppressive drug doses; renal transplant recipients; transitional Bregs.
© 2021 The Authors. Immunity, Inflammation and Disease published by John Wiley & Sons Ltd.
Conflict of interest statement
Christian Morath and Gerhard Opelz together with the University of Heidelberg, are cofounders of TolerogenixX GmbH, a biotechnology company that holds licenses for modified immune cell (MIC) treatment. Gerhard Opelz holds a patent for MIC treatment (“Immunosuppressive blood cells and methods of producing the same.” Patent no. WO 2010/000730, EP 2318020). Christian Morath, Volker Daniel, and Caner Süsal filed a patent application for MIC treatment (“MIC therapy for specific immunosuppression in transplantation.” Patent no. PCT/EP2019/062857).
Figures

Similar articles
-
CD4+CD25+CD127-Foxp3+ and CD8+CD28- Tregs in Renal Transplant Recipients: Phenotypic Patterns, Association With Immunosuppressive Drugs, and Interaction With Effector CD8+ T Cells and CD19+IL-10+ Bregs.Front Immunol. 2021 Jul 15;12:716559. doi: 10.3389/fimmu.2021.716559. eCollection 2021. Front Immunol. 2021. PMID: 34335631 Free PMC article.
-
Higher CD19+CD25+ Bregs are independently associated with better graft function in renal transplant recipients.BMC Nephrol. 2021 May 17;22(1):180. doi: 10.1186/s12882-021-02374-2. BMC Nephrol. 2021. PMID: 33993874 Free PMC article.
-
The balance between memory and regulatory cell populations in kidney transplant recipients with operational tolerance.Clin Exp Immunol. 2024 May 16;216(3):318-330. doi: 10.1093/cei/uxae018. Clin Exp Immunol. 2024. PMID: 38393856 Free PMC article.
-
Regulatory B cells: Phenotype, function and role in transplantation.Transpl Immunol. 2017 Mar;41:1-9. doi: 10.1016/j.trim.2017.02.004. Epub 2017 Mar 1. Transpl Immunol. 2017. PMID: 28257995 Review.
-
Regulatory B cells play a key role in immune system balance.Joint Bone Spine. 2013 Jan;80(1):18-22. doi: 10.1016/j.jbspin.2012.04.010. Epub 2012 Jul 31. Joint Bone Spine. 2013. PMID: 22858147 Review.
Cited by
-
Recent advances in regulatory immune cells: exploring the world beyond Tregs.Front Immunol. 2025 May 16;16:1530301. doi: 10.3389/fimmu.2025.1530301. eCollection 2025. Front Immunol. 2025. PMID: 40453084 Free PMC article. Review.
-
Immune Profiling of Peripheral Blood Mononuclear Cells at Pancreas Acute Rejection Episodes in Kidney-Pancreas Transplant Recipients.Transpl Int. 2022 Nov 18;35:10639. doi: 10.3389/ti.2022.10639. eCollection 2022. Transpl Int. 2022. PMID: 36466442 Free PMC article.
-
Evaluation of Regulatory B Cell Subpopulations CD24++CD38++, CD24++CD27+, Plasmablasts and Their Correlation with T Regs CD3+CD4+CD25+FOXP3+ in Dialysis Patients and Early Post-Transplant Rejection-Free Kidney Recipients.J Clin Med. 2024 May 24;13(11):3080. doi: 10.3390/jcm13113080. J Clin Med. 2024. PMID: 38892795 Free PMC article.
-
The immune tolerance role of Bregs in inhibiting human inflammatory diseases, with a focus on diabetes mellitus.Front Immunol. 2025 Apr 30;16:1565158. doi: 10.3389/fimmu.2025.1565158. eCollection 2025. Front Immunol. 2025. PMID: 40370441 Free PMC article. Review.
-
Molecular screening of transitional B cells as a prognostic marker of improved graft outcome and reduced rejection risk in kidney transplant.Front Immunol. 2024 Aug 12;15:1433832. doi: 10.3389/fimmu.2024.1433832. eCollection 2024. Front Immunol. 2024. PMID: 39192987 Free PMC article.
References
-
- Rosser EC, Mauri C. Regulatory B cells: origin, phenotype, and function. Immunity. 2015;42(4):607‐612. - PubMed
MeSH terms
Substances
LinkOut - more resources
Full Text Sources
Medical
Research Materials
Miscellaneous
