

Magnetic resonance imaging patterns of tumor response to chemotherapy in desmoid-type fibromatosis
- PMID: 34102009
- PMCID: PMC8267164
- DOI: 10.1002/cam4.3973
Magnetic resonance imaging patterns of tumor response to chemotherapy in desmoid-type fibromatosis
Abstract
Background: We aimed to investigate changes in volume and MRI T2-weighted intensity in desmoid-type fibromatosis (DF) receiving methotrexate plus vinca-alkaloids (MTX-VA) at Istituto Nazionale dei Tumori, Milan.
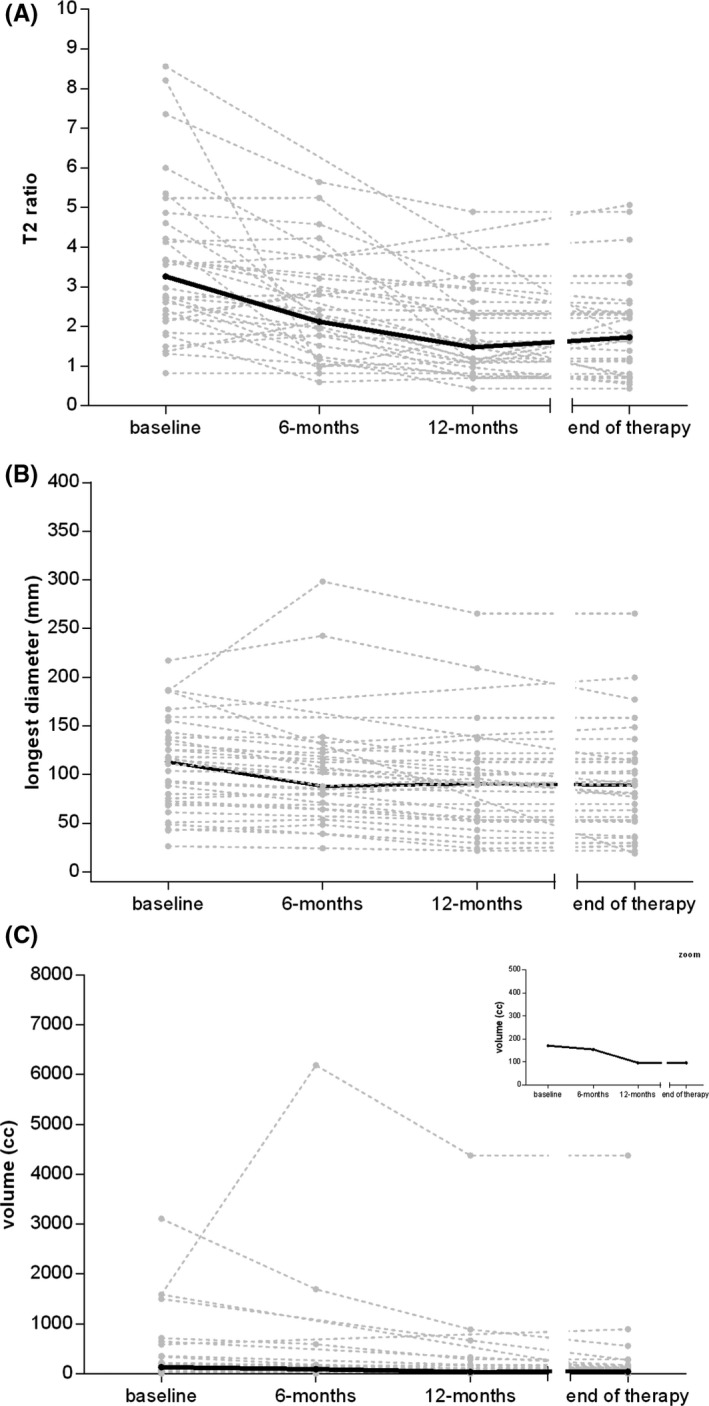
Methods: All cases of sporadic DF treated with MTX-VA from 1999 to 2019 were reviewed. MRIs at baseline, 6 and 12 months of chemotherapy and at treatment withdrawal were retrospectively reviewed, contouring the tumor lesion and measuring diameters, volume, and mean T2-signal intensity (normalized to muscle) changes. These parameters were also evaluated according to clinical variables.
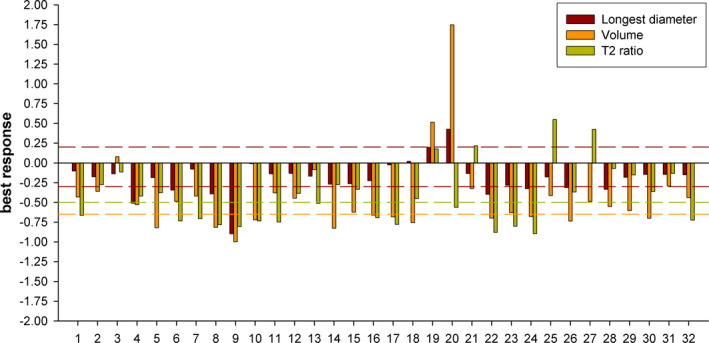
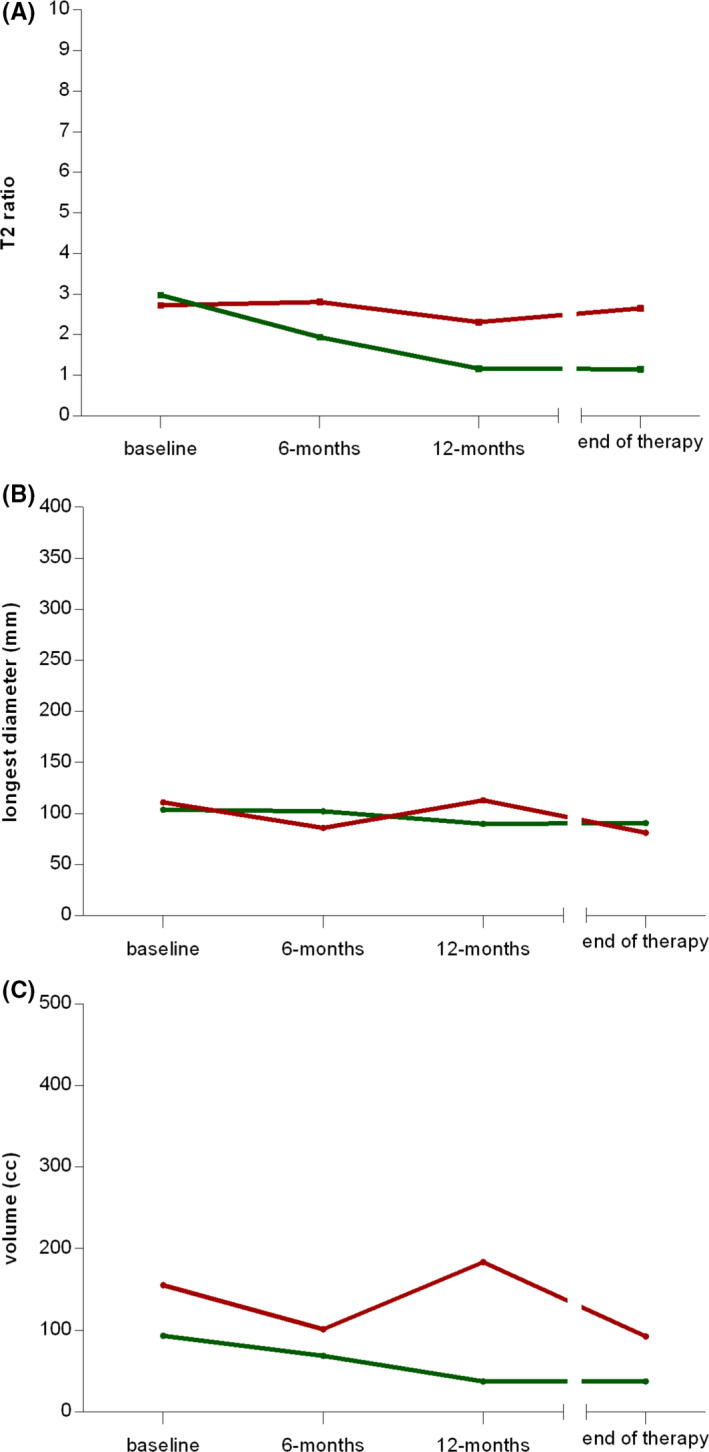
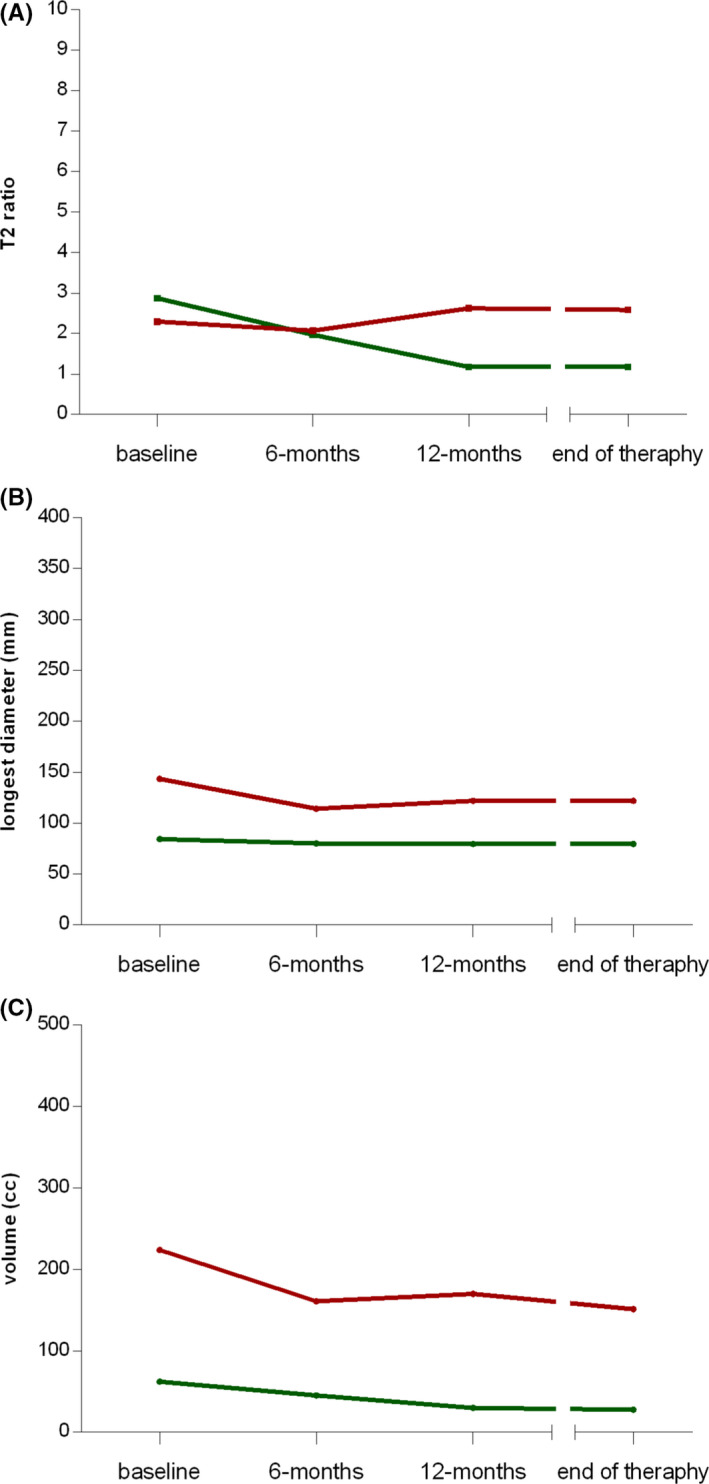
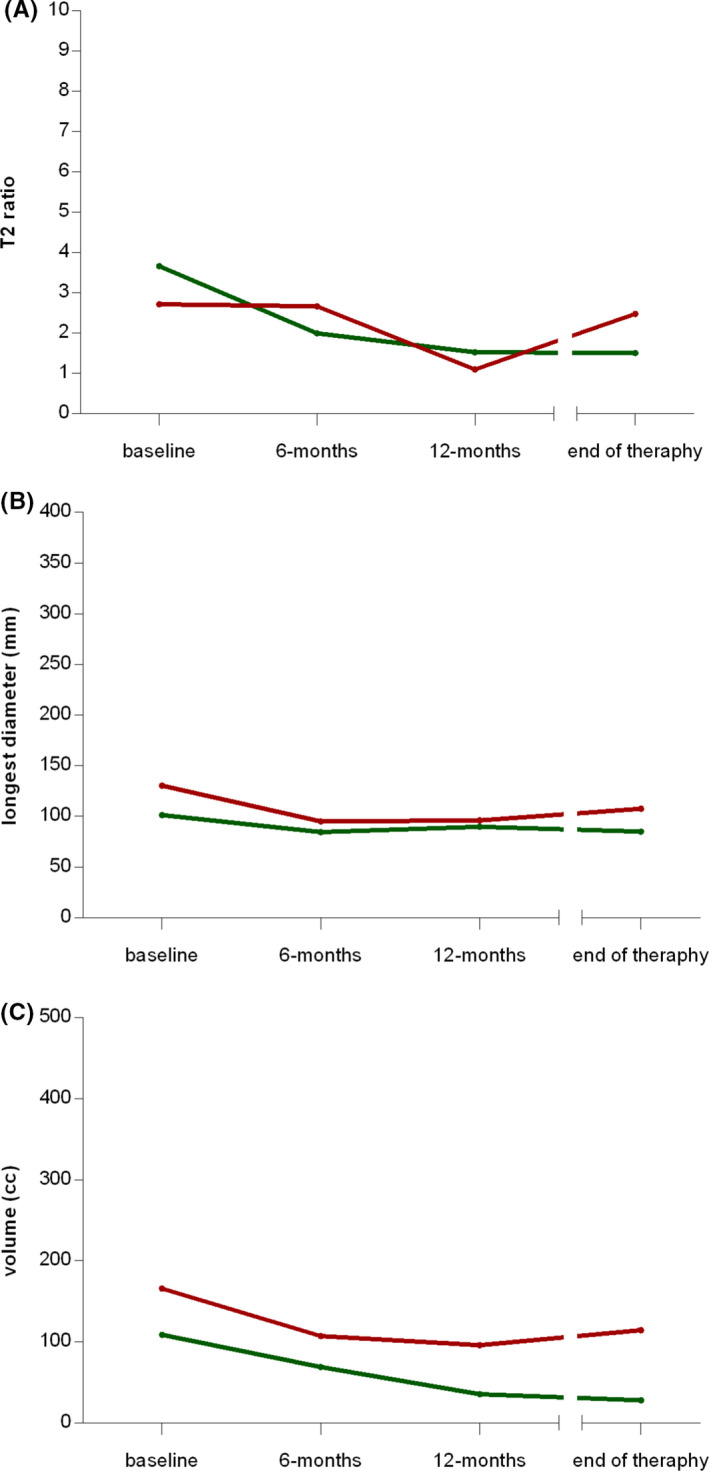
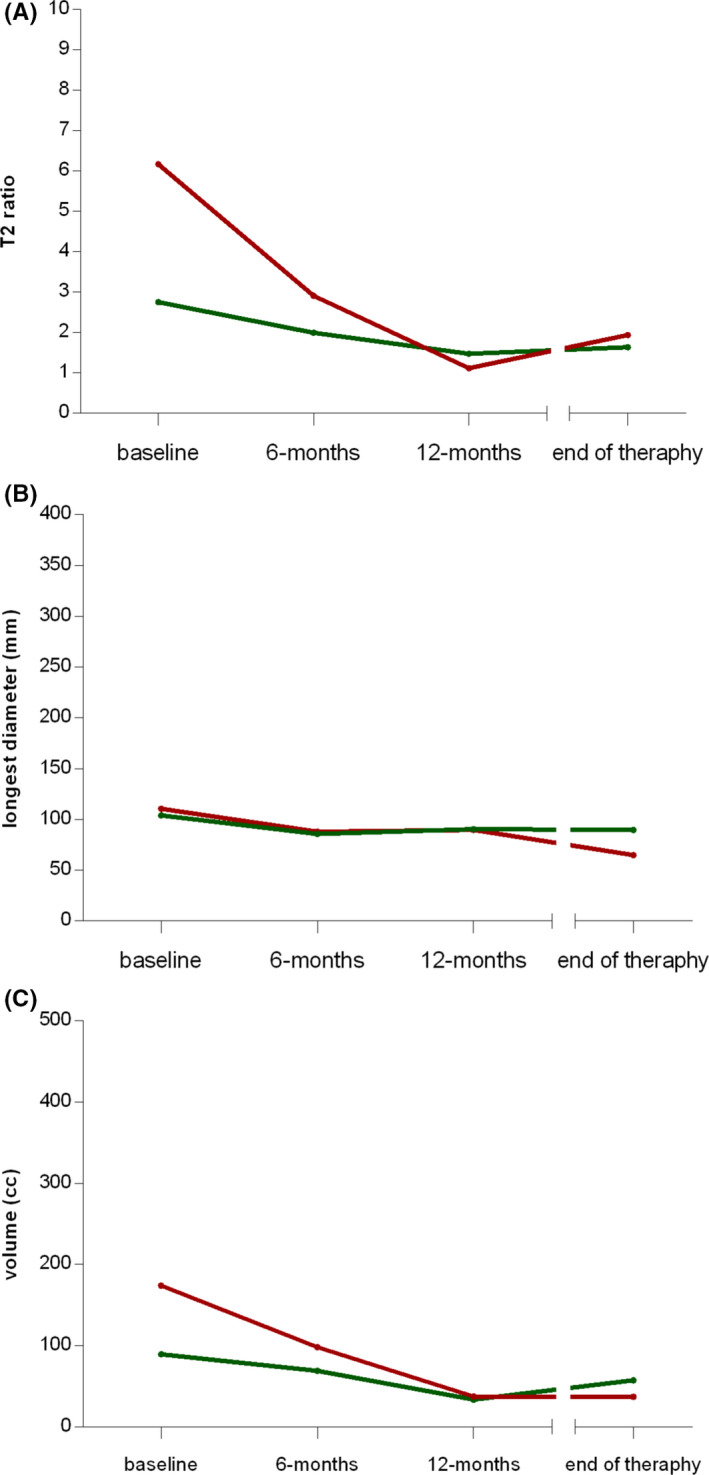
Results: Thirty-two DF patients were identified. Best RECIST response was: 25% partial response, 69% stable disease, 6% progression. A ≥65% tumor volume reduction was observed in 38%, <65% reduction in 53%, an increase in 9%. 22% had RECIST stable disease with a ≥65% tumor volume reduction. T2-signal intensity decreased by ≥50% in 47%, <50% in 41% and increased in 12%. In patients with symptomatic improvement while on therapy and in patients maintaining symptomatic improvement during follow-up, median T2-signal intensity showed a reduction along the time points (3.0, 1.9, 1.2, 1.1; 2.9, 2.0, 1.2, 1.2, respectively); in patients without symptomatic improvement and in those clinically progressing during follow-up, a reduction was not observed. High T2-signal intensity at baseline was observed in patients showing RECIST progression during follow-up.
Conclusions: In this series, RECIST detected a lower proportion of responses as compared to volumetric and T2-signal changes. T2-signal reduction seemed to better reflect symptomatic improvement. High T2-signal intensity at baseline was related to a higher proportion of further progression.
Keywords: aggressive fibromatosis; magnetic resonance imaging; methotrexate; tumor response; vinca alkaloids.
© 2021 The Authors. Cancer Medicine published by John Wiley & Sons Ltd.
Conflict of interest statement
All Authors have no potential conflicts of interest to declare.
Figures
Similar articles
-
Clinical benefit of methotrexate plus vinorelbine chemotherapy for desmoid fibromatosis (DF) and correlation of treatment response with MRI.Cancer Med. 2019 Sep;8(11):5047-5057. doi: 10.1002/cam4.2374. Epub 2019 Jul 13. Cancer Med. 2019. PMID: 31301110 Free PMC article.
-
Long-term Efficacy of Methotrexate Plus Vinblastine/Vinorelbine in a Large Series of Patients Affected by Desmoid-Type Fibromatosis.Cancer J. 2017 Mar/Apr;23(2):86-91. doi: 10.1097/PPO.0000000000000254. Cancer J. 2017. PMID: 28410293
-
Desmoid fibromatosis: MRI features of response to systemic therapy.Skeletal Radiol. 2016 Oct;45(10):1365-73. doi: 10.1007/s00256-016-2439-y. Epub 2016 Aug 9. Skeletal Radiol. 2016. PMID: 27502790
-
Efficacy of low-dose chemotherapy with methotrexate and vinblastine for patients with extra-abdominal desmoid-type fibromatosis: a systematic review.Jpn J Clin Oncol. 2020 Apr 7;50(4):419-424. doi: 10.1093/jjco/hyz204. Jpn J Clin Oncol. 2020. PMID: 31845730
-
Role of Imaging in Management of Desmoid-type Fibromatosis: A Primer for Radiologists.Radiographics. 2016 May-Jun;36(3):767-82. doi: 10.1148/rg.2016150153. Radiographics. 2016. PMID: 27163593 Review.
Cited by
-
Desmoid-type fibromatosis: imaging features and course.Skeletal Radiol. 2023 Jul;52(7):1293-1303. doi: 10.1007/s00256-023-04275-x. Epub 2023 Jan 16. Skeletal Radiol. 2023. PMID: 36646850 Review.
-
The Desmoid Dilemma: Challenges and Opportunities in Assessing Tumor Burden and Therapeutic Response.Curr Oncol. 2025 May 21;32(5):288. doi: 10.3390/curroncol32050288. Curr Oncol. 2025. PMID: 40422547 Free PMC article. Review.
-
MRI T2 mapping assessment of T2 relaxation time in desmoid tumors as a quantitative imaging biomarker of tumor response: preliminary results.Front Oncol. 2023 Dec 22;13:1286807. doi: 10.3389/fonc.2023.1286807. eCollection 2023. Front Oncol. 2023. PMID: 38188297 Free PMC article.
References
MeSH terms
Substances
LinkOut - more resources
Full Text Sources
Medical
Miscellaneous
