. 2021 Jun 25;6(6):2168-2180.
doi: 10.1021/acssensors.0c02318. Epub 2021 Jun 8.

Genetically Encoded, pH-Sensitive mTFP1 Biosensor for Probing Lysosomal pH

Affiliations

Genetically Encoded, pH-Sensitive mTFP1 Biosensor for Probing Lysosomal pH

Marcus Y Chin et al. ACS Sens. .

Abstract

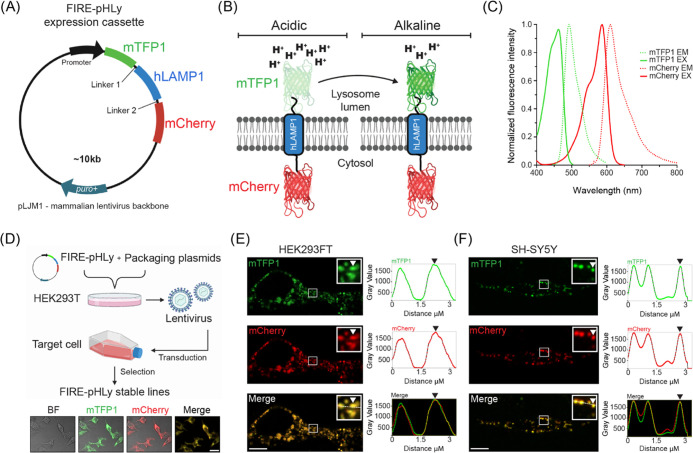
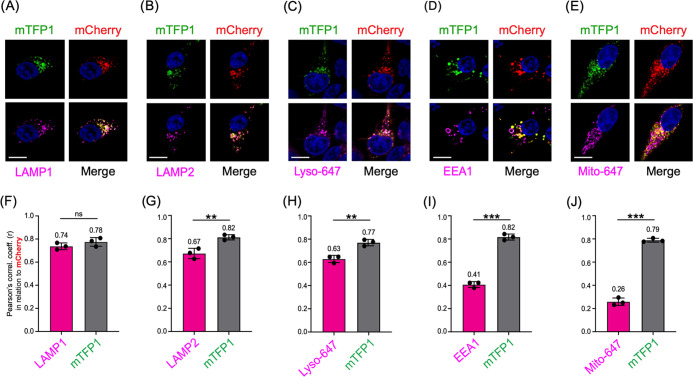
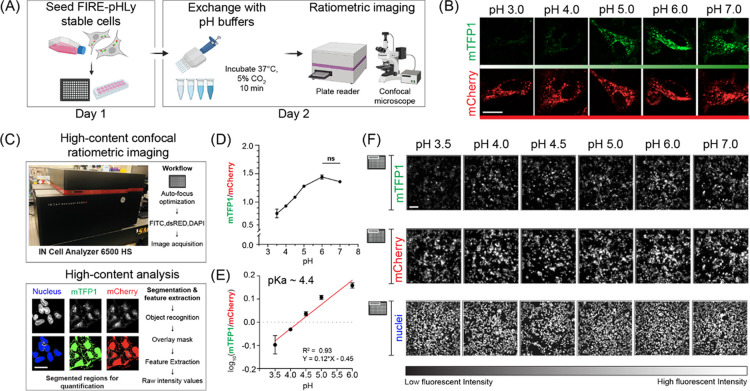
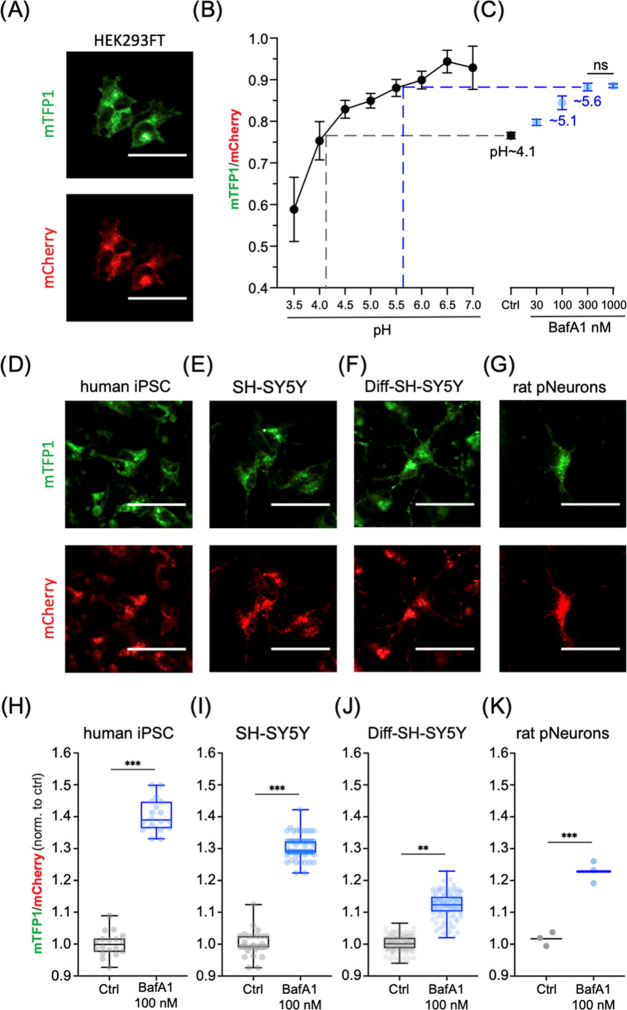
Lysosomes are important sites for macromolecular degradation, defined by an acidic lumenal pH of ∼4.5. To better understand lysosomal pH, we designed a novel, genetically encoded, fluorescent protein (FP)-based pH biosensor called Fluorescence Indicator REporting pH in Lysosomes (FIRE-pHLy). This biosensor was targeted to lysosomes with lysosomal-associated membrane protein 1 (LAMP1) and reported lumenal pH between 3.5 and 6.0 with monomeric teal fluorescent protein 1 (mTFP1), a bright cyan pH-sensitive FP variant with a pKa of 4.3. Ratiometric quantification was enabled with cytosolically oriented mCherry using high-content quantitative imaging. We expressed FIRE-pHLy in several cellular models and quantified the alkalinizing response to bafilomycin A1, a specific V-ATPase inhibitor. In summary, we have engineered FIRE-pHLy, a specific, robust, and versatile lysosomal pH biosensor, that has broad applications for investigating pH dynamics in aging- and lysosome-related diseases, as well as in lysosome-based drug discovery.

Keywords: high-content analysis; lysosomes; neurons; pH biosensor; ratiometric imaging.


Conflict of interest statement

The authors declare no competing financial interest.

Figures

Figure 1
Figure 1
Design of FIRE-pHLy, a ratiometric lysosomal pH biosensor. (A) Design of FIRE-pHLy expression cassette driven by the CMV promoter (in HEK293FT cells) or human UbC promoter (in SH-SY5Y cells) cloned in the lentiviral pJLM1 or FUGW plasmid, respectively. Chimeric protein (N- to C-terminus) mTFP1–hLAMP1–mCherry is targeted to lysosomes via the type-I transmembrane human LAMP1 peptide sequence. Linker regions 1 (GGSGGGSGSGGGSG) and 2 (PAPAPAP) allow proper folding and expression of each protein portion. (B) Representation of FIRE-pHLy expressed on lysosomal membranes and mTFP1 fluorescence levels in acidic and alkaline conditions. Lysosomal pH-sensitive mTFP1 located within the lumen and lysosomal pH-insensitive mCherry is located on the cytosolic side. (C) Excitation (solid lines) and emission spectra (dashed lines) for mTFP1 and mCherry. The 470 and 587 nm laser lines were used to excite mTFP1 and mCherry, respectively. Spectral values were obtained and adapted from FPbase. Refer to Table 1 for the physicochemical properties of FIRE-pHLy FPs. (D) Workflow of generating stable FIRE-pHLy cell lines using lentiviral vectors. Representative low-magnification confocal fluorescence images of bright-field (BF), mTFP1 (green), mCherry (red), and merged channels (yellow) in stable FIRE-pHLy-expressing HEK293FT cells. Scale bar = 25 μm (E,F) Live imaging frames of FIRE-pHLy expressing stable cells (E) HEK293FT and (F) SH-SY5Y with the zoomed inset highlighting mTFP1 and mCherry puncta (white arrowhead) and corresponding line scan intensity profile measured along the white line (right panel). Scale bars = 10 μm.
Figure 2
Figure 2
FIRE-pHLy localizes to lysosomal compartments. (A–E) Representative images of FIRE-pHLy-expressing HEK293FT cells stained with various markers (shown in magenta). (A) LAMP1 (lysosomal membranes), (B) LAMP2 (lysosomal membranes), (C) LysoTracker Deep Red or Lyso-647 (acidic compartments), (D) EEA1 (early endosomes), and (E) MitoTracker Deep Red or Mito-647 (mitochondria). Nuclei are shown in blue. Scale bars = 10 μm. (F–J) Pearson’s correlation coefficients (r) calculated using the ImageJ plugin JACoP (Just Another Colocalization Plugin). Each graph shows a different marker colocalized with mCherry (magenta bars) and mTFP1 colocalized with mCherry (gray bars). Data points represent mean ± standard deviation (SD) (three independent replicates; n = 15 cells/replicate. Statistical analysis was performed using two-tailed, unpaired Student’s t-test. **p ≤ 0.01; ***p ≤ 0.001; ns = not significant).
Figure 3
Figure 3
FIRE-pHLy biosensor responds to pH changes and is quantifiable with high-content analysis. (A) Workflow for pH calibration protocol. FIRE-pHLy-expressing cells were seeded into assay wells. Media was exchanged with pH buffers (at indicated values) supplemented with 10 μM nigericin and 1× monensin and was allowed to incubate for 10 min. Cells can be imaged live on either a confocal microscope or high-content plate reader. (B) Representative individual channel images of FIRE-pHLy-expressing HEK293FT cells imaged live by spinning disk confocal microscopy. Scale bar = 20 μm. (C) High-content analysis to quantify FIRE-pHLy fluorescence. Images were acquired on a plate-based confocal imager and analyzed on a custom-built segmentation protocol (see the Methods section). Masks for nucleus and FIRE-pHLy fluorescence were created, and average mTFP1/mCherry ratios were calculated. (D) Cells were analyzed according to (C), and mTFP1/mCherry ratios were plotted against pH. Data points are presented as mean ± SD from four independent replicates; n = ∼10 000 cells quantified per pH value. Tukey’s test for multiple stepwise comparisons indicated significance between all pH groups, except 6.0 and 7.0. (E) Log10(mTFP1/mCherry) values between pH 3.5 and 6.0 were fit to a linear equation (R2 = 0.93). The pKa of FIRE-pHLy (in cells) was calculated to be ∼4.4. (F) Grayscale images of mTFP1, mCherry, and nuclei taken from one random field of one representative assay well (of 96-well plate) at indicated pH values. Scale bar = 50 μm.
Figure 4
Figure 4
In vitro FIRE-pHLy models and relative pH measurements with bafilomycin A1. (A) Ratiometric images of 2% paraformaldehyde (PFA)-fixed FIRE-pHLy-expressing HEK293FT cells taken on a high-content imaging system (described in Figure 3). (B) pH calibration curve generated from cells incubated with pH buffer (pH 3.5–7.0) and fixed with 2% PFA post 10 min of treatment. Data points are presented as mean ± SD from four independent replicates; n = 10 000 quantified cells per pH value. (C) mTFP1/mCherry ratios of FIRE-pHLy-expressing HEK293FT cells treated with bafilomycin (BafA1 30–1000 nM) and 0.1% dimethyl sulfoxide (DMSO) solvent control (Ctrl) for 6 h prior to fixation and imaging. Data points are presented as mean ± SD from six independent replicates; n = 10 000 quantified cells per condition. Tukey’s test for multiple stepwise comparisons indicated significance between all groups including control, except BafA1 300 and 1000 nM. (D–G) Individual channel images (left to right) of FIRE-pHLy stably expressed in human iPSCs, SH-SY5Y, differentiated SH-SY5Y, and late embryonic rat hippocampal neuronal cells. All cells were fixed with 2% PFA prior to image acquisition. (H–K) 100 nM bafilomycin A1 was treated on cells for 6 h and compared to 0.1% DMSO. Box-and-whisker plots show median, interquartile range (25–75th percentile), and maximum/minimum values of mean ratios per well. (H) Human iPSC; 18 independent wells in 96-well format; n = ∼15 000 quantified cells per well. Three biological replicates. (I) SH-SY5Y; 76 independent wells in 384-well format; n = 2500 cells per well. Two biological replicates. (J) RA-differentiated SH-SY5Y; 120 independent wells; n = 5000 quantified cells per well. Four biological replicates. (K) Primary rat hippocampal neurons; three independent wells; n = 6500 quantified cells per well. One biological replicate. Statistical analysis was performed using two-tailed, unpaired Student’s t-test. **p ≤ 0.01; ***p ≤ 0.001; ns = not significant. All scale bars = 25 μm.

References

    1. Huynh K.; Eskelinen E. L.; Scott C. C.; Malevanets A.; Saftig P.; et al. LAMP Proteins Are Required for Fusion of Lysosomes with Phagosomes. EMBO J. 2007, 26, 313–324. 10.1038/sj.emboj.7601511. - DOI - PMC - PubMed
    1. Lawrence R. E.; Zoncu R. The Lysosome as a Cellular Centre for Signalling, Metabolism and Quality Control. Nat. Cell Biol. 2019, 21, 133–142. 10.1038/s41556-018-0244-7. - DOI - PubMed
    1. Mony V. K.; Benjamin S.; O’Rourke E. J. A Lysosome-Centered View of Nutrient Homeostasis. Autophagy 2016, 12, 619–631. 10.1080/15548627.2016.1147671. - DOI - PMC - PubMed
    1. Settembre C.; Fraldi A.; Medina D. L.; Ballabio A. Signals for the Lysosome: A Control Center for Cellular Clearance and Energy Metabolism. Nat. Rev. Mol. Cell Biol. 2013, 14, 283–296. 10.1038/nrm3565. - DOI - PMC - PubMed
    1. Ballabio A.; Bonifacino J. S. Lysosomes as Dynamic Regulators of Cell and Organismal Homeostasis. Nat. Rev. Mol. Cell Biol. 2020, 21, 101–118. 10.1038/s41580-019-0185-4. - DOI - PubMed

Publication types

Substances