. 2021 Jul 13;54(7):1561-1577.e7.
doi: 10.1016/j.immuni.2021.05.003. Epub 2021 Jun 7.

Uptake of oxidized lipids by the scavenger receptor CD36 promotes lipid peroxidation and dysfunction in CD8+ T cells in tumors

Affiliations

Uptake of oxidized lipids by the scavenger receptor CD36 promotes lipid peroxidation and dysfunction in CD8+ T cells in tumors

Shihao Xu et al. Immunity. .

Abstract

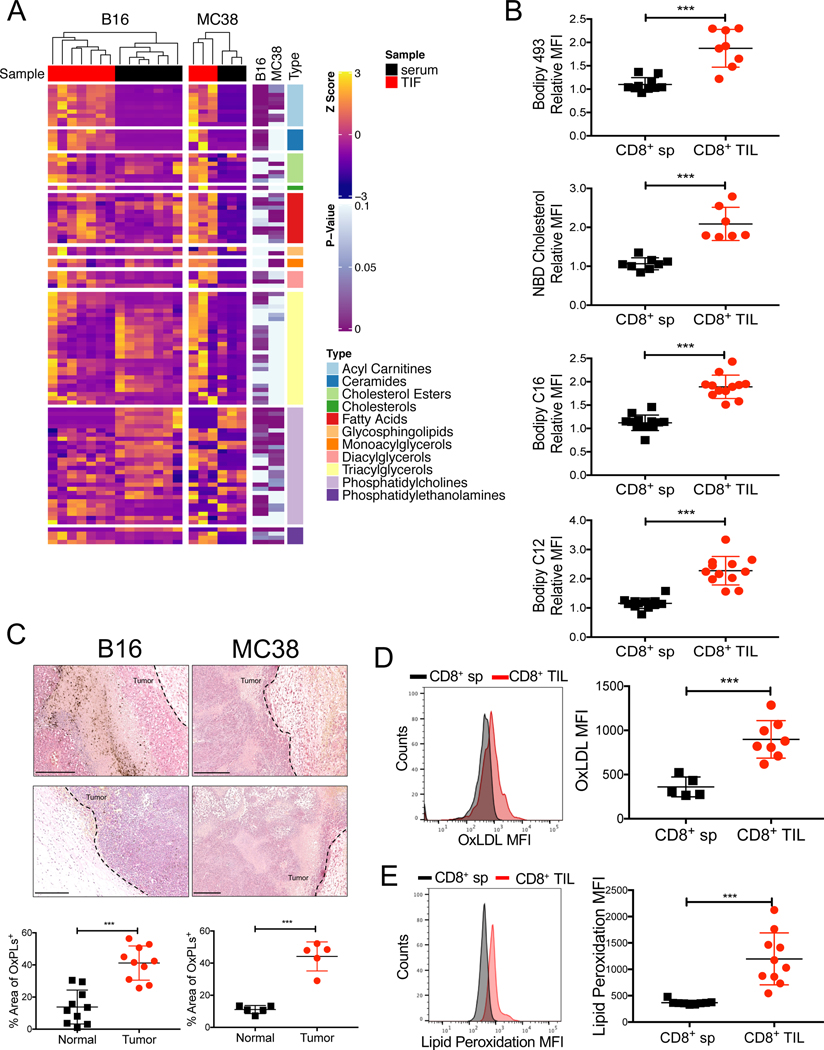
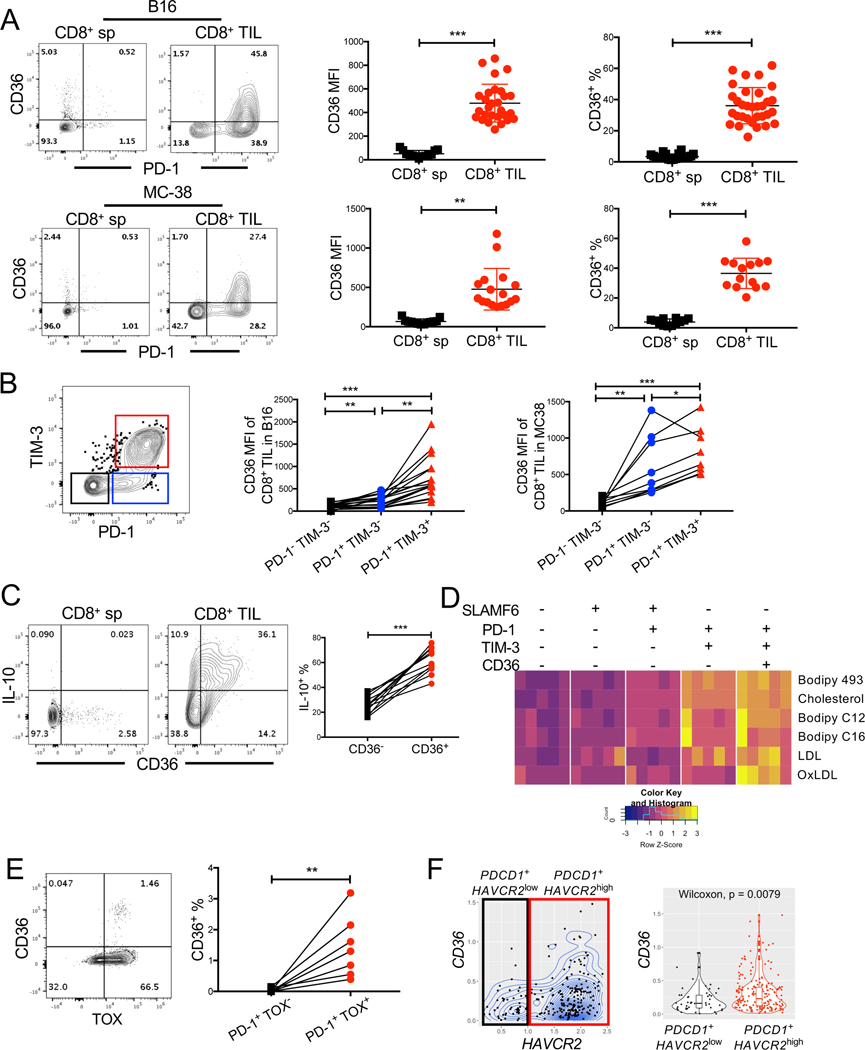
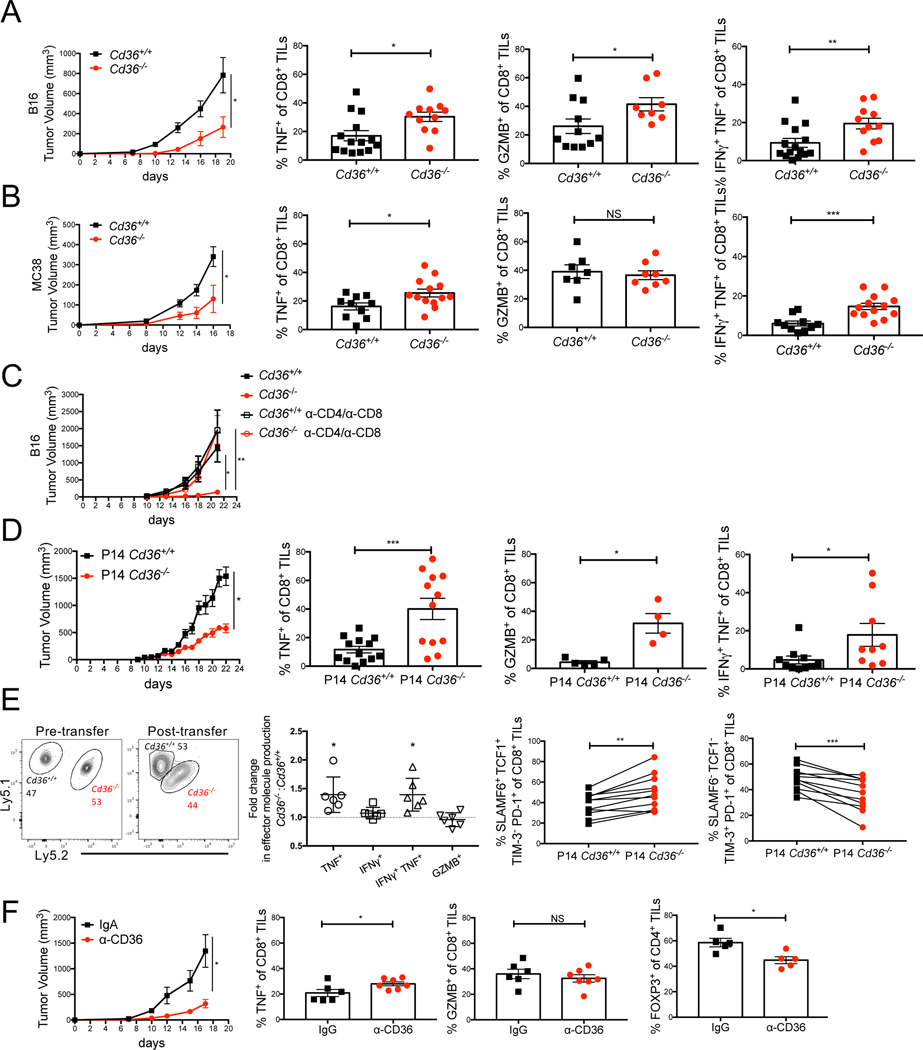
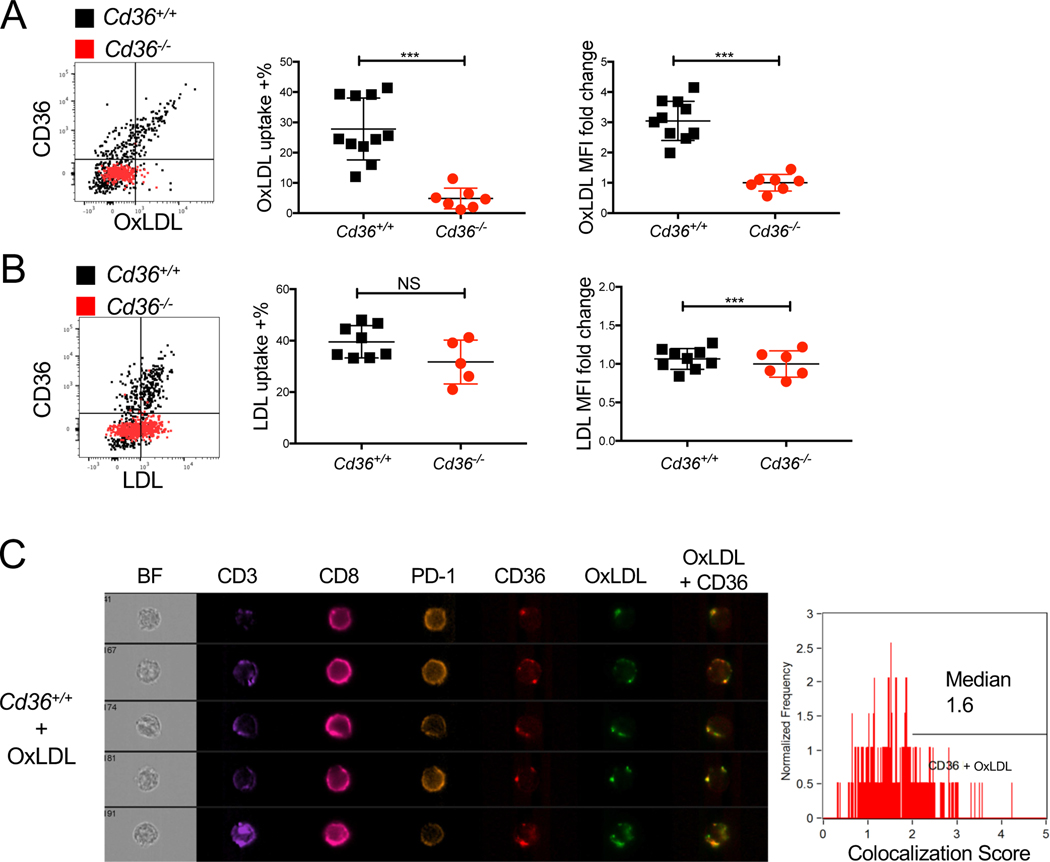
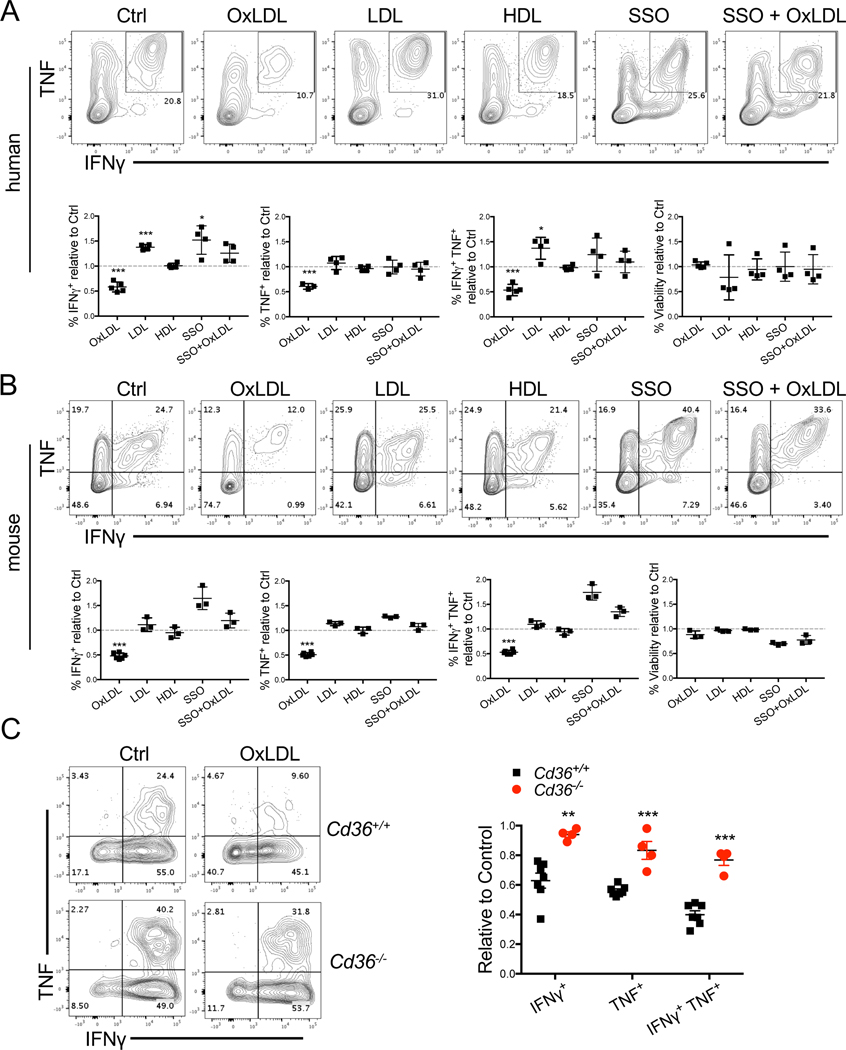
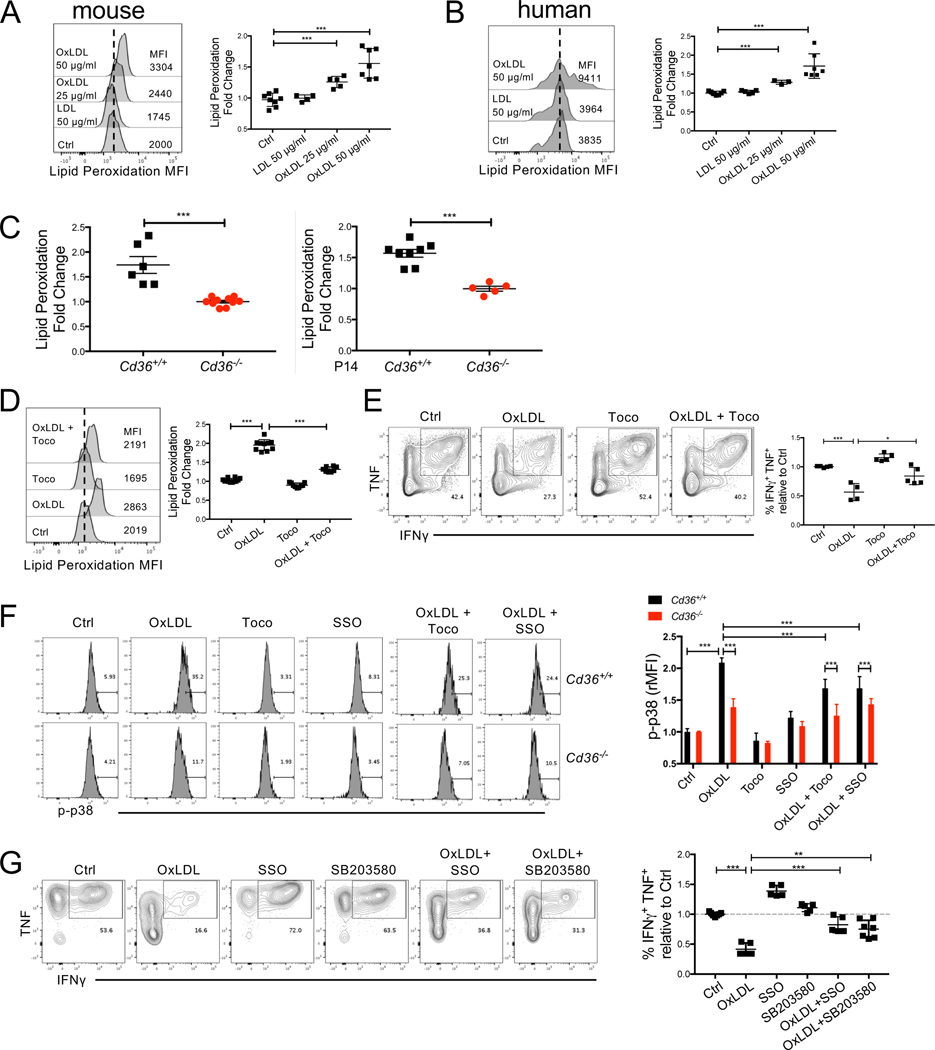
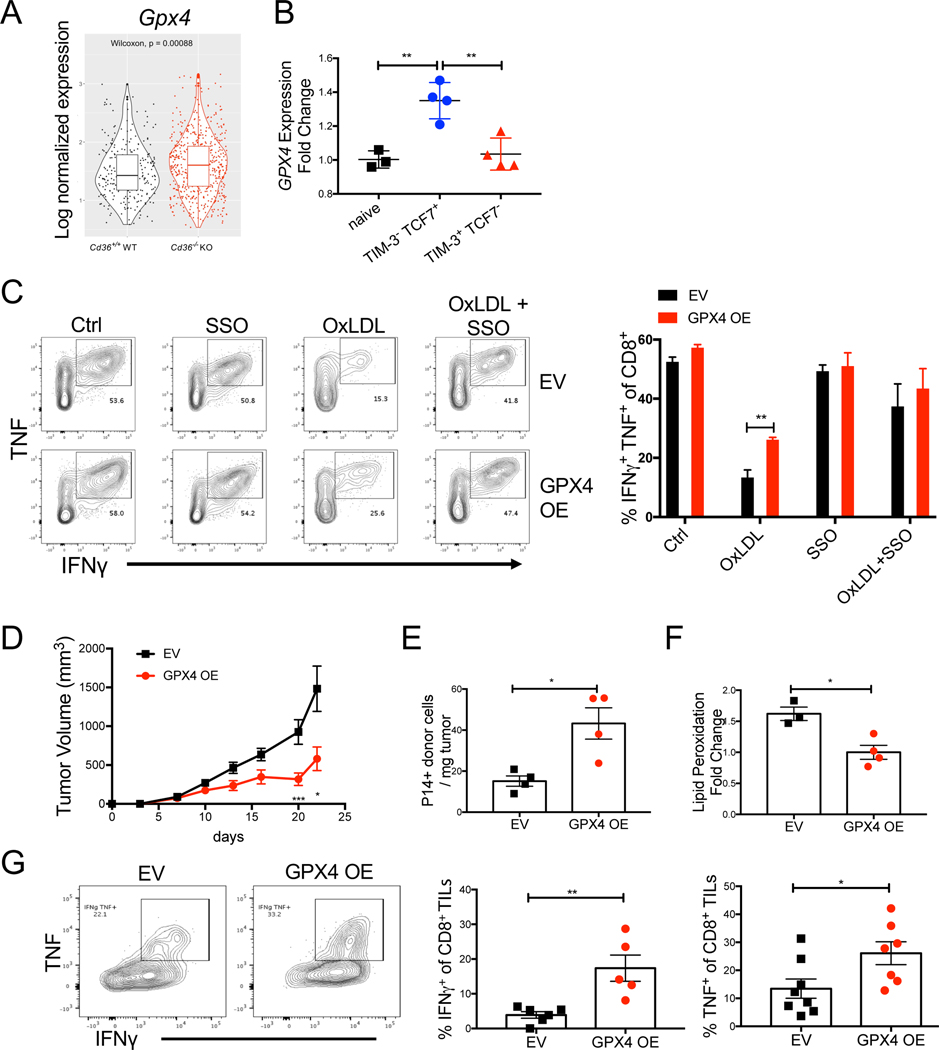
A common metabolic alteration in the tumor microenvironment (TME) is lipid accumulation, a feature associated with immune dysfunction. Here, we examined how CD8+ tumor infiltrating lymphocytes (TILs) respond to lipids within the TME. We found elevated concentrations of several classes of lipids in the TME and accumulation of these in CD8+ TILs. Lipid accumulation was associated with increased expression of CD36, a scavenger receptor for oxidized lipids, on CD8+ TILs, which also correlated with progressive T cell dysfunction. Cd36-/- T cells retained effector functions in the TME, as compared to WT counterparts. Mechanistically, CD36 promoted uptake of oxidized low-density lipoproteins (OxLDL) into T cells, and this induced lipid peroxidation and downstream activation of p38 kinase. Inhibition of p38 restored effector T cell functions in vitro, and resolution of lipid peroxidation by overexpression of glutathione peroxidase 4 restored functionalities in CD8+ TILs in vivo. Thus, an oxidized lipid-CD36 axis promotes intratumoral CD8+ T cell dysfunction and serves as a therapeutic avenue for immunotherapies.

Keywords: CD36; CD8(+) T cells; lipid peroxidation; oxidized lipids; tumor microenvironment.


Conflict of interest statement

Declaration of interests G.C. receives research funding from Bayer AG and Boehringer Ingelheim, but the funding is not relevant to the current study. J.L.W. and X.S. are named inventors on patent applications or patents related to the use of oxidation-specific antibodies held by UCSD. R.Z. is an inventor on patent applications related to work on GITR, PD-1, and CTLA-4. R.Z. is a consultant for Leap Therapeutics and iTEOS. T.M. is a cofounder and holds equity in IMVAQ Therapeutics. T.M. is a consultant for Immunos Therapeutics, Pfizer, and Immunogenesis. T.M. has research support from Bristol-Myers Squibb; Surface Oncology; Kyn Therapeutics; Infinity Pharmaceuticals, Inc.; Peregrine Pharmaceuticals, Inc.; Adaptive Biotechnologies; Leap Therapeutics, Inc.; and Aprea. T.M. has patents on applications related to work on oncolytic viral therapy, alpha virus-based vaccines, neoantigen modeling, CD40, GITR, OX40, PD-1, and CTLA-4. J.D.W. is a consultant for Adaptive Biotech, Amgen, Apricity, Ascentage Pharma, Astellas, AstraZeneca, Bayer, Beigene, Boehringer Ingelheim, Bristol Myers Squibb, Celgene, Chugai, Elucida, Eli Lilly, F Star, Georgiamune, Imvaq, Kyowa Hakko Kirin, Linneaus, Merck Pharmaceuticals, Neon Therapeutics, Polynoma, Psioxus, Recepta, Takara Bio, Trieza, Truvax, Sellas Life Sciences, Serametrix, Surface Oncology, Syndax, Syntalogic, and Werewolf Therapeutics. J.D.W. reports grants from Bristol Myers Squibb and Sephora. J.D.W. has equity in Tizona Pharmaceuticals, Adaptive Biotechnologies, Imvaq, Beigene, Linneaus, Apricity, Arsenal IO, and Georgiamune. J.D.W. is an inventor on patent applications related to work on DNA vaccines in companion animals with cancer, assays for suppressive myeloid cells in blood, oncolytic viral therapy, alphavirus-based vaccines, neo-antigen modeling, CD40, GITR, OX40, PD-1, and CTLA-4.

Figures

Figure 1.
Figure 1.. Increased exposure of CD8+ TILs to oxidized lipids in the TME
C57BL/6J mice were implanted with B16 or MC38 cells and tumors or splenocytes were examined 21 days later. (A) Lipids in the TIF and serum from B16 or MC38 tumors were measured by mass spectrometry. Heatmap shows the relative abundance of each lipid species normalized to protein concentration (shown as row Z-score). Results are representative of two experiments. (B) Neutral lipid content (Bodipy 493), uptake of cholesterol and fatty acids (NBD cholesterol, Bodipy C12, and Bodipy C16), were compared between CD8+ T cells isolated from the spleen (CD8+ sp) or B16 tumors (CD8+ TILs) using flow cytometry. Congenic Thy1.1 naïve splenocytes were spiked into each sample to serve as an internal reference for normalizing lipid staining. Relative mean fluorescent intensity (MFI) was calculated as the MFI ratio of the sample to the internal reference. (C) OxPLs were stained in B16 and MC38 tumors with the biotinylated E06 antibody and detected with alkaline phosphatase conjugated avidin. The nuclei were stained with hematoxylin. Data are representative of three tumors/ group. Areas with positive OxPLs staining were quantified. Scale bar, 250 μm. (D) Uptake of OxLDL in CD8+ sp or CD8+ TILs from B16 tumors was measured using fluorescently conjugated OxLDL and flow cytometry. (E) Lipid peroxidation in splenic CD8+ sp or CD8+ TILs from B16 tumors was quantified using BODIPY 581/591 C11 and flow cytometry. Data shown are mean ± SEM. Statistical analyses for (A, B, D, E) were performed by two-tailed unpaired Student’s t-test, ***p < 0.001. Samples were pooled from 2–3 experiments with each group containing n=7–12 (B), n=5–8 (D) or n=9–10 (E) animals.
Figure 2.
Figure 2.. CD36 is expressed on functionally exhausted CD8+ TILs
(A, B, D) C57BL/6J mice were implanted with B16 or MC38 cells as indicated below and tumors or splenocytes were examined 21 days later. (A-B) The expression of CD36†, PD-1 and TIM-3 was measured in CD8+ sp and CD8+ TILs from B16 tumors or MC38 tumors using flow cytometry. Contour plots show representative staining patterns and scatter plots show the cumulative MFI or % CD36+ of total CD8+ T cells (A) or PD-1- TIM-3+, PD-1+ TIM-3- or PD-1+ TIM-3+ subsets of CD44+ CD8+ TILs (B). (C) 10BiT mice were implanted with B16 tumor cells and 21 days later CD36 and IL-10 expression (based on Thy1.1 staining) was assessed on CD8+ sp and CD8+ TILs using flow cytometry. Within each tumor analyzed, the percent of IL-10-expressing cells in the CD36- or CD36+ CD8+ TIL subsets is shown. (D) As in Fig. 1, neutral lipid content (Bodipy 493) and uptake of polar lipids (Bodipy C12, Bodipy C16), cholesterol (NBD-Cholesterol), OxLDL or LDL were measured in B16 CD44+ CD8+ TILs subsets identified by the expression of SLAMF6, PD-1, TIM-3, and CD36 using flow cytometry. Heatmap shows the MFI for each molecule analyzed (shown as row Z-score). (E) The expression of CD36 and TOX was measured by flow cytometry in PD-1+ CD8+ TILs from human melanomas. Within each tumor analyzed, the percent of CD36+ cells in the TOX- and TOX+ subsets of PD-1+ CD8+ TILs is shown. (F) CD8+ TILs from human melanomas (GSE72056, (Tirosh et al., 2016)) were examined via scRNAseq analysis for CD36 and TIM-3 (HAVCR2) mRNA expression. The analysis was restricted to the cells whose log-normalized mRNA expression of CD3D, CD8A, PDCD1, CD36 and HAVCR2 were all greater than 0. Contour plot (left) and boxplot (right) shows CD36 mRNA abundance (lognormalized) in CD8+ TILs expressing either higher or lower amounts of HAVCR2. P-value was calculated by Wilcoxon test. Data shown are mean ± SEM and statistical analyses were performed by two-tailed unpaired Student’s t-test (A), and two-tailed paired Student’s t-test (B, C, E), * p < 0.05, ** p < 0.01, ***p < 0.001.. Samples were pooled from 2–5 experiments with each group containing n=13–29 (A), n=9–17 (B), n=8 (C), n=4 (D) animals or n=7 (E) patients. †, anti-CD36 clone CRF D-2712 was used for CD36 staining; anti-CD36 clone HM36 showed non-specific staining on Cd36−/− cells and thus not used in this study (Figure S2B).
Figure 3.
Figure 3.. CD36 promotes CD8+ TIL dysfunction
(A-E) C57BL/6J mice were implanted with B16 or MC38 cells as indicated below and tumors or splenocytes were examined 21 days later. (A-C) Cd36+/+ or Cd36−/− mice were implanted with B16 cells (A, C) or MC38 cells (B). Tumor growth was measured and the expression of PD-1, TNF, IFNγ, and GZMB in CD8+ TILs was measured by flow cytometry. In (C), Cd36+/+ or Cd36−/− mice were treated with IgG or α-CD4/α-CD8 antibodies to delete T cells. (D) Mice were implanted with B16-gp33 cells and 10 days later 106 P14 Cd36+/+ or Cd36−/− naïve CD8+ cells were adoptively transferred. Tumor growth was measured and the expression of TNF, IFNγ, and GZMB was measured in donor P14 CD8+ TILs. (E) Mice were implanted with B16-gp33 cells. 7–10 days later 106 P14 Ly5.1/Ly5.1 Cd36+/+ naïve CD8+ and 106 P14 Ly5.1/Ly5.2 Cd36−/− naïve CD8+ were mixed at 1:1 ratio, and adoptively transferred to the tumor-bearing mice. The expression of TNF, IFNγ, GZMB, SLAMF6, TCF-1, PD-1, and TIM3 was measured in donor P14 Cd36+/+ or Cd36−/−CD8+ TILs 10 days post adoptive transfer. (F) Mice were implanted with B16 cells and treated with either IgA isotype control or α-CD36 Fab antibody (CRF D-2717, 200 μg, i.p., start on day 7 post tumor engraftment, every two days). Tumor growth was measured and the amounts of TNF and GZMB in CD8+ TILs and FOXP3 in CD4+ TILs were measured by flow cytometry. Data shown are mean± SEM, and statistical analyses were performed by two-tailed unpaired Student’s t-test, *p < 0.05; **p < 0.01; ***p < 0.001. Results were pooled from 2–4 experiments with each group containing n=7–12 (A), n=7–12 (B), n=6–7 (C), n=4–20 (D), n=6–8 (E), or n=5–9 (F) animals.
Figure 4.
Figure 4.. CD36 mediates OxLDL uptake in CD8+ TILs
(A-C) Cd36+/+ or Cd36−/− mice were implanted with B16 cells as indicated below and tumors were examined 21 days later. (A-B) The expression of CD36 and uptake of OxLDL (A) or LDL (B) in Cd36+/+ or Cd36−/− CD8+ TILs were analyzed by flow cytometry. Note, the direct correlation between CD36 expression and OxLDL uptake on Cd36+/+ cells and lack of OxLDL, but not LDL, uptake in Cd36−/− TILs. (C) The expression of CD3, CD8, PD-1, CD36, and OxLDL uptake in Cd36+/+ CD8+ TILs were measured by Amnis ImageSteam® flow cytometry. BF, bright field. Representative images are shown from 2 experiments. Note, the colocalization of CD36 and OxLDL in merged image (right most panel). The colocalization of CD36 and OxLDL was quantified in the Cd36+ CD8+ TILs based on the Bright Detail Similarity score computed by the Amnis. Data shown are mean± SEM, and statistical analyses were performed by two-tailed unpaired Student’s t-test. ***p < 0.001, NS, non-significant. Results are pooled from 2–3 experiments with each group containing n=5–11 animals.
Figure 5.
Figure 5.. OxLDL inhibits CD8+ T cell function in a CD36-dependent manner
(A) Human PBMCs were activated with CD3/CD28/CD2 T Cell Activator in the presence of either vehicle control (Ctrl), OxLDL (50 μg/ml), LDL (50 μg/ml), HDL (50 μg/ml), SSO (100 μM), or the combination of OxLDL (50 μg/ml) and SSO (100 μM) for 6 days. The expression of TNF and IFNγ, and cell viability were measured by flow cytometry 4 hrs after stimulation with PMA/Ionomycin. (B) P14 CD8+ T cells were activated in vitro with gp33 peptide plus IL-2 for 48 hrs and then treated with either vehicle control (Ctrl), OxLDL (50 μg/ml), LDL (50 μg/ml), HDL (50 μg/ml), SSO (100 μM), or the combination of OxLDL (50 μg/ml) and SSO (100 μM), for another 16∼24 hrs. TNF, IFNγ and cell viability were then measured upon re-stimulation with gp33 for 6 hours and analyzed by flow cytometry. (C) Cd36+/+ or Cd36−/− CD8+ TILs isolated from B16 tumors 21 days post implantation were purified by FACS and treated with either vehicle control (Ctrl) or OxLDL (50 μg/ml) for 24 hrs. TNF and IFNγ were measured by flow cytometry 4 hrs after stimulation with PMA/ionomycin. Data shown are mean± SEM and statistical tests were performed by two-tailed unpaired Student’s t-test (A-C), * p < 0.05, ** p < 0.01, *** p < 0.001. Results are pooled from 2–3 experiments with each group containing n=3–6 replicates.
Figure 6.
Figure 6.. OxLDL induces lipid peroxidation in CD8+ T cells in a CD36-dependent manner
(A) P14 or OT-1 splenocytes were activated in vitro for 48 hrs and then treated with vehicle control (Ctrl), OxLDL (25 or 50 μg/ml), LDL (50 μg/ml) for 24 hrs. The cells were then washed in PBS and incubated with BODIPY® 581/591 C11 for lipid peroxidation assay. (B) Human PBMCs treated with vehicle control (Ctrl), LDL (50 μg/ml), OxLDL (25 or 50 μg/ml ) for 24 hrs and then washed in PBS and incubated with BODIPY® 581/591 C11 for lipid peroxidation assay. (C) BODIPY 581/591 C11 lipid peroxidation assay was performed directly ex vivo on CD8+ TILs isolated from B16 tumors implanted 21 days previously into Cd36+/+ or Cd36−/− mice (left) or B6 mice that contained P14 Cd36+/+ or Cd36−/− CD8+ TILs (right). Graphs show the fold change in BODIPY 581/591 C11 fluorescence in Cd36+/+ relative to Cd36−/− TILs. (D-E) P14 or OT-1 splenocytes were activated in vitro for 48 hrs and then treated with vehicle control (Ctrl), OxLDL (50 μg/ml), α-Tocopherol (Toco, 200 μM), or the combination of OxLDL (50 μg/ml) and Toco (200 μM) for 24 hrs. The cells were washed in PBS and incubated with BODIPY® 581/591 C11 for lipid peroxidation assay (D). TNF and IFNγ were measured upon re-stimulation and analyzed by flow cytometry (E). (F) P14 Cd36+/+ or Cd36−/− CD8+ T cells were activated in vitro with gp33 peptide plus IL-2 for 48 hrs and then treated with either vehicle control (Ctrl), OxLDL (50 μg/ml), Toco (200 μM), SSO (100 μM), the combination of OxLDL (50 μg/ml) and Toco (200 μM), or the combination of OxLDL (50 μg/ml) and SSO (100 μM), for another 24 hrs. p38 phosphorylation (p-p38) was measured by flow cytometry, and the MFI of p-p38 was normalized to Ctrl. (G) P14 or OT-1 splenocytes were activated in vitro for 48 hrs and then treated with either vehicle control (Ctrl), OxLDL (50 μg/ml), SSO (100 μM), SB203580 (10 μM), the combination of OxLDL (50 μg/ml) and SSO (100 μM), or the combination of OxLDL (50 μg/ml) and SB203580 (100 μM) for another 24 hrs. TNF and IFNγ were measured upon re-stimulation and analyzed by flow cytometry. Data shown in A-G are mean ± SEM and statistical analyses were performed by two-tailed unpaired Student’s t-test, * p < 0.05, ** p < 0.01, *** p < 0.001. Samples were pooled from 2–3 experiments with each group containing n=3–8 (A-G).
Figure 7.
Figure 7.. GPX4 OE restores CD8+ T cell function in tumors
(A) mRNA expression of Gpx4 was compared between P14 Cd36+/+ or Cd36−/− TILs isolated from B16 tumors 21 days post implantation and analyzed by scRNAseq. p-value was calculated by Wilcoxon test. (B) Analysis of publicly available Gpx4 mRNA expression in naïve, PD-1+ TIM-3+ TCF7-, or PD-1+ TIM-3- TCF7+ P14 CD8+ TILs isolated from B16-gp33 tumors 6 days after tumors became palpable (GSE114631) (Siddiqui et al., 2019). (C) P14 splenocytes were activated in vitro for 24 hrs, then transduced with either empty retrovirus (EV) or retrovirus overexpressing Gpx4 (GPX4 OE). 24 hrs post transduction, cells were treated with either vehicle control (Ctrl), OxLDL (50 μg/ml), SSO (100 μM), or the combination of OxLDL (50 μg/ml) and SSO (100 μM) for another 24 hrs. TNF and IFNγ were then measured upon re-stimulation and analyzed by flow cytometry. (D-G) In vitro activated P14 CD8+ T cells were transduced with either empty retrovirus (EV) or a retrovirus overexpressing Gpx4 (GPX4 OE) and 5×10⁵ cells were adoptively transferred into C57BL/6J mice implanted with B16-gp33 cells 7 days prior. Tumor growth was measured (D), and EV and GPX4 OE P14 donor TILs were analyzed at day 21 post tumor implantation by flow cytometry for cell numbers (E), rate of lipid peroxidation (F) or IFNγ and TNF cytokine production (G). Data shown are mean± SEM and statistical analysis was performed by two-tailed unpaired Student’s t-test *p < 0.05, **p < 0.01, ***p < 0.001. Samples were pooled from 2 experiments with each group containing n=3 (C), n=8 (D), n=3–4 (E, F), and n=5–7 (G) animals.

Comment in

References

    1. Abumrad N, Harmon C, and Ibrahimi A. (1998). Membrane transport of long-chain fatty acids: evidence for a facilitated process. Journal of lipid research 39, 2309–2318. - PubMed
    1. Al-Khami AA, Zheng L, Del Valle L, Hossain F, Wyczechowska D, Zabaleta J, Sanchez MD, Dean MJ, Rodriguez PC, and Ochoa AC. (2017). Exogenous lipid uptake induces metabolic and functional reprogramming of tumor-associated myeloid-derived suppressor cells. Oncoimmunology 6, e1344804. - PMC - PubMed
    1. Alfei F, Kanev K, Hofmann M, Wu M, Ghoneim HE, Roelli P, Utzschneider DT, von Hoesslin M, Cullen JG, Fan Y, et al. (2019). TOX reinforces the phenotype and longevity of exhausted T cells in chronic viral infection. Nature 571, 265–269. - PubMed
    1. Binder CJ, Papac-Milicevic N, and Witztum JL. (2016). Innate sensing of oxidation-specific epitopes in health and disease. Nat Rev Immunol 16, 485–497. - PMC - PubMed
    1. Bligh EG, and Dyer WJ. (1959). A rapid method of total lipid extraction and purification. Can J Biochem Physiol 37, 911–917. - PubMed

Publication types