. 2021 Jul 21;109(14):2292-2307.e5.
doi: 10.1016/j.neuron.2021.05.012. Epub 2021 Jun 7.

Enhancing myelin renewal reverses cognitive dysfunction in a murine model of Alzheimer's disease

Affiliations

Enhancing myelin renewal reverses cognitive dysfunction in a murine model of Alzheimer's disease

Jing-Fei Chen et al. Neuron. .

Abstract

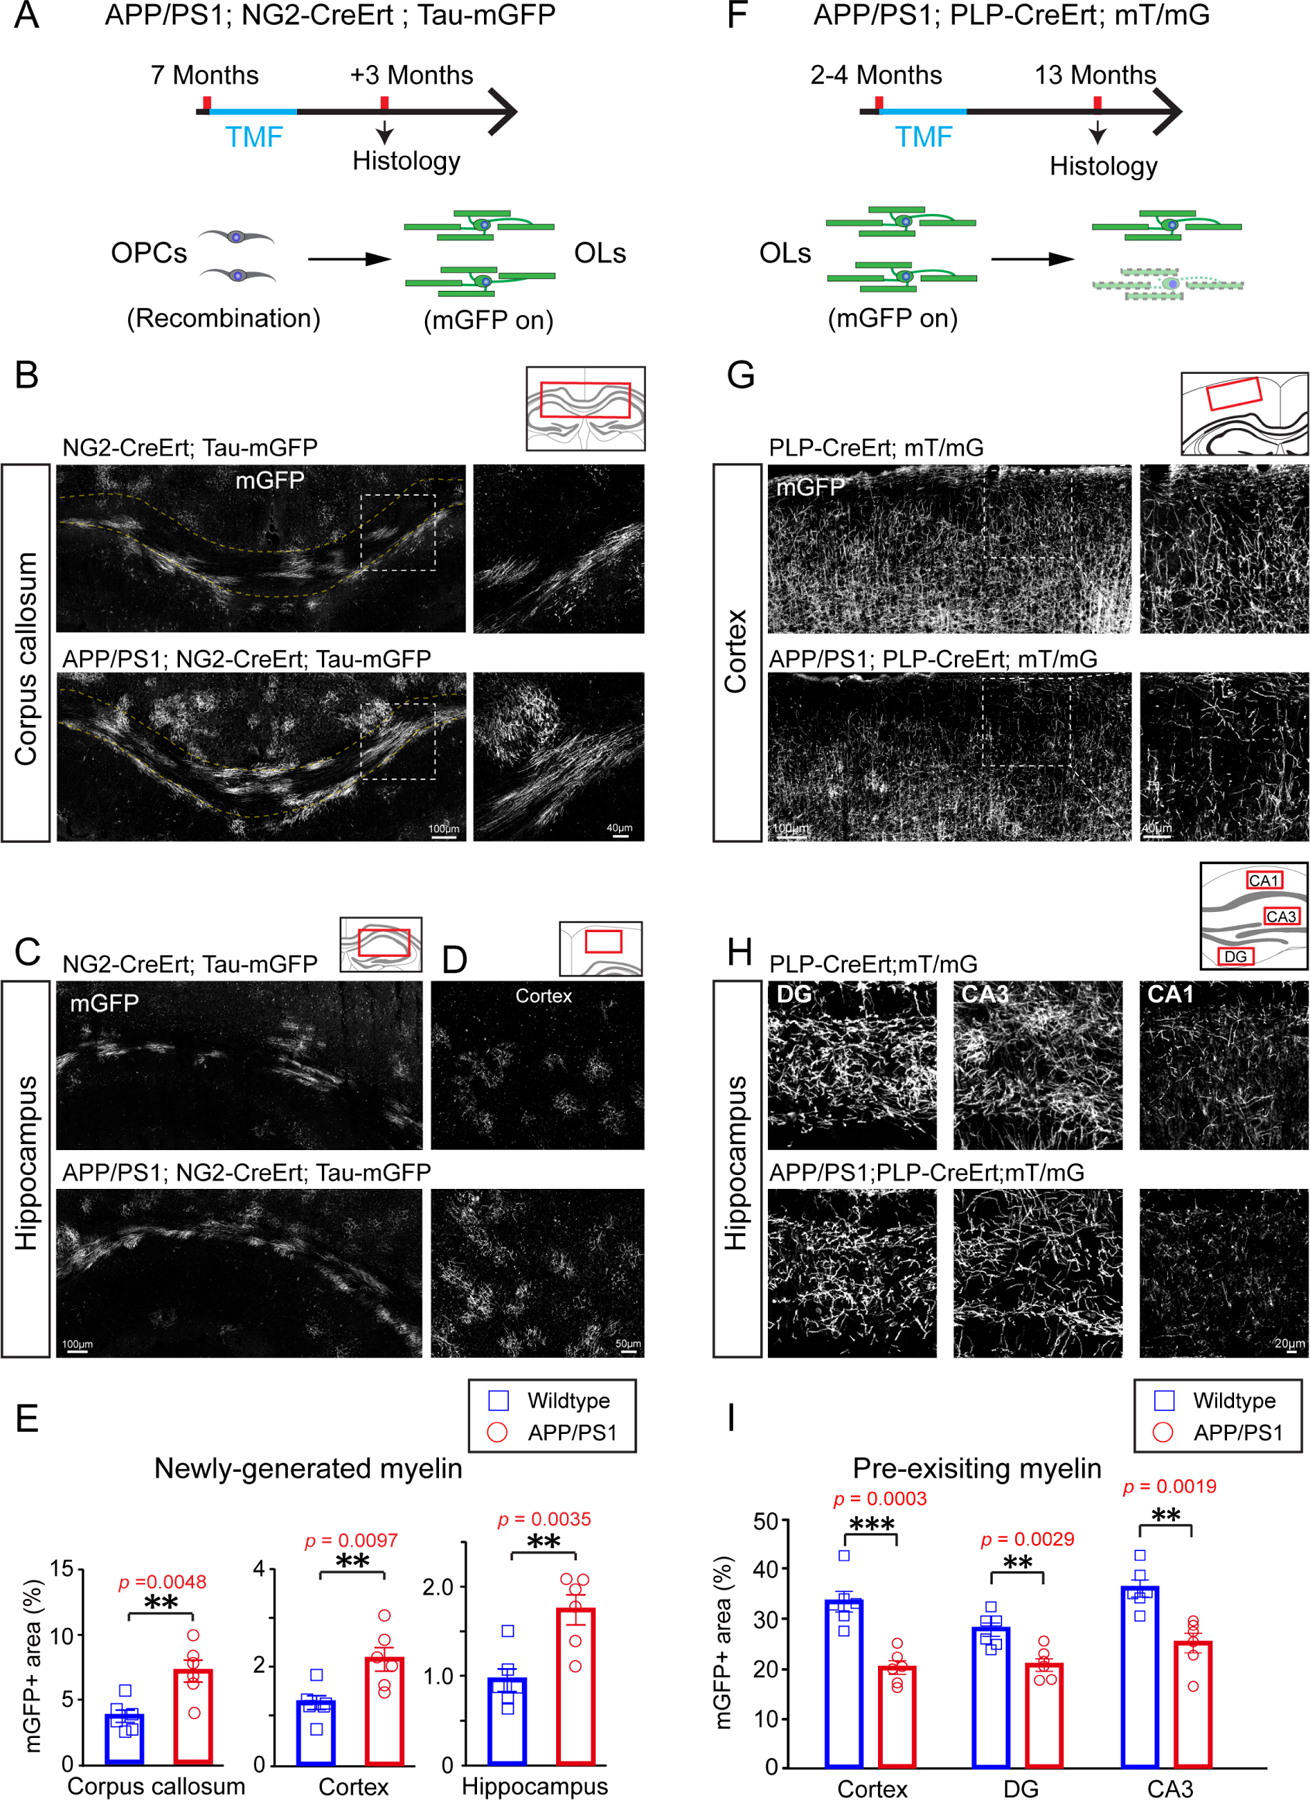
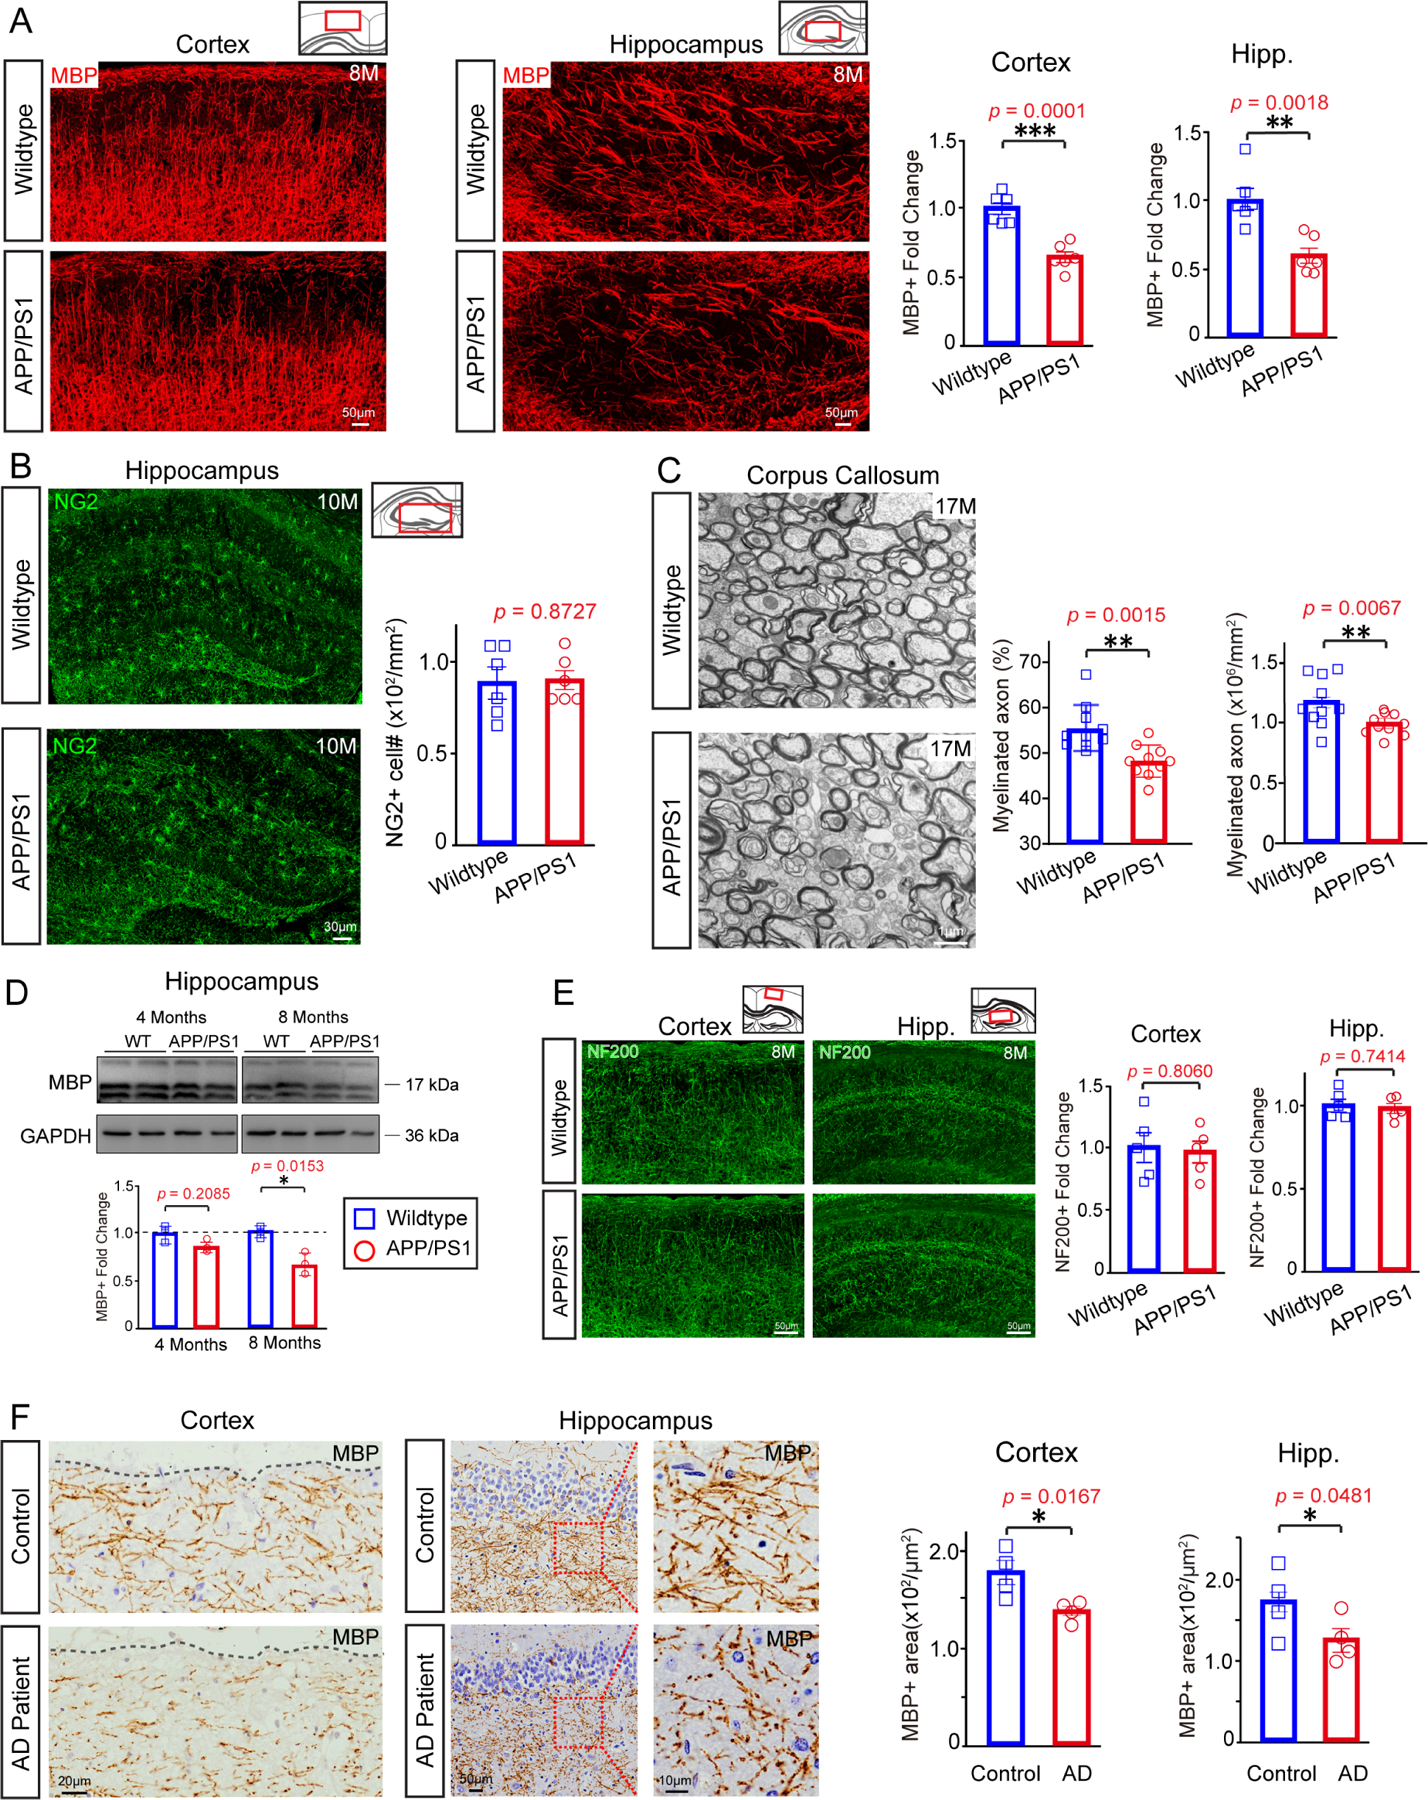
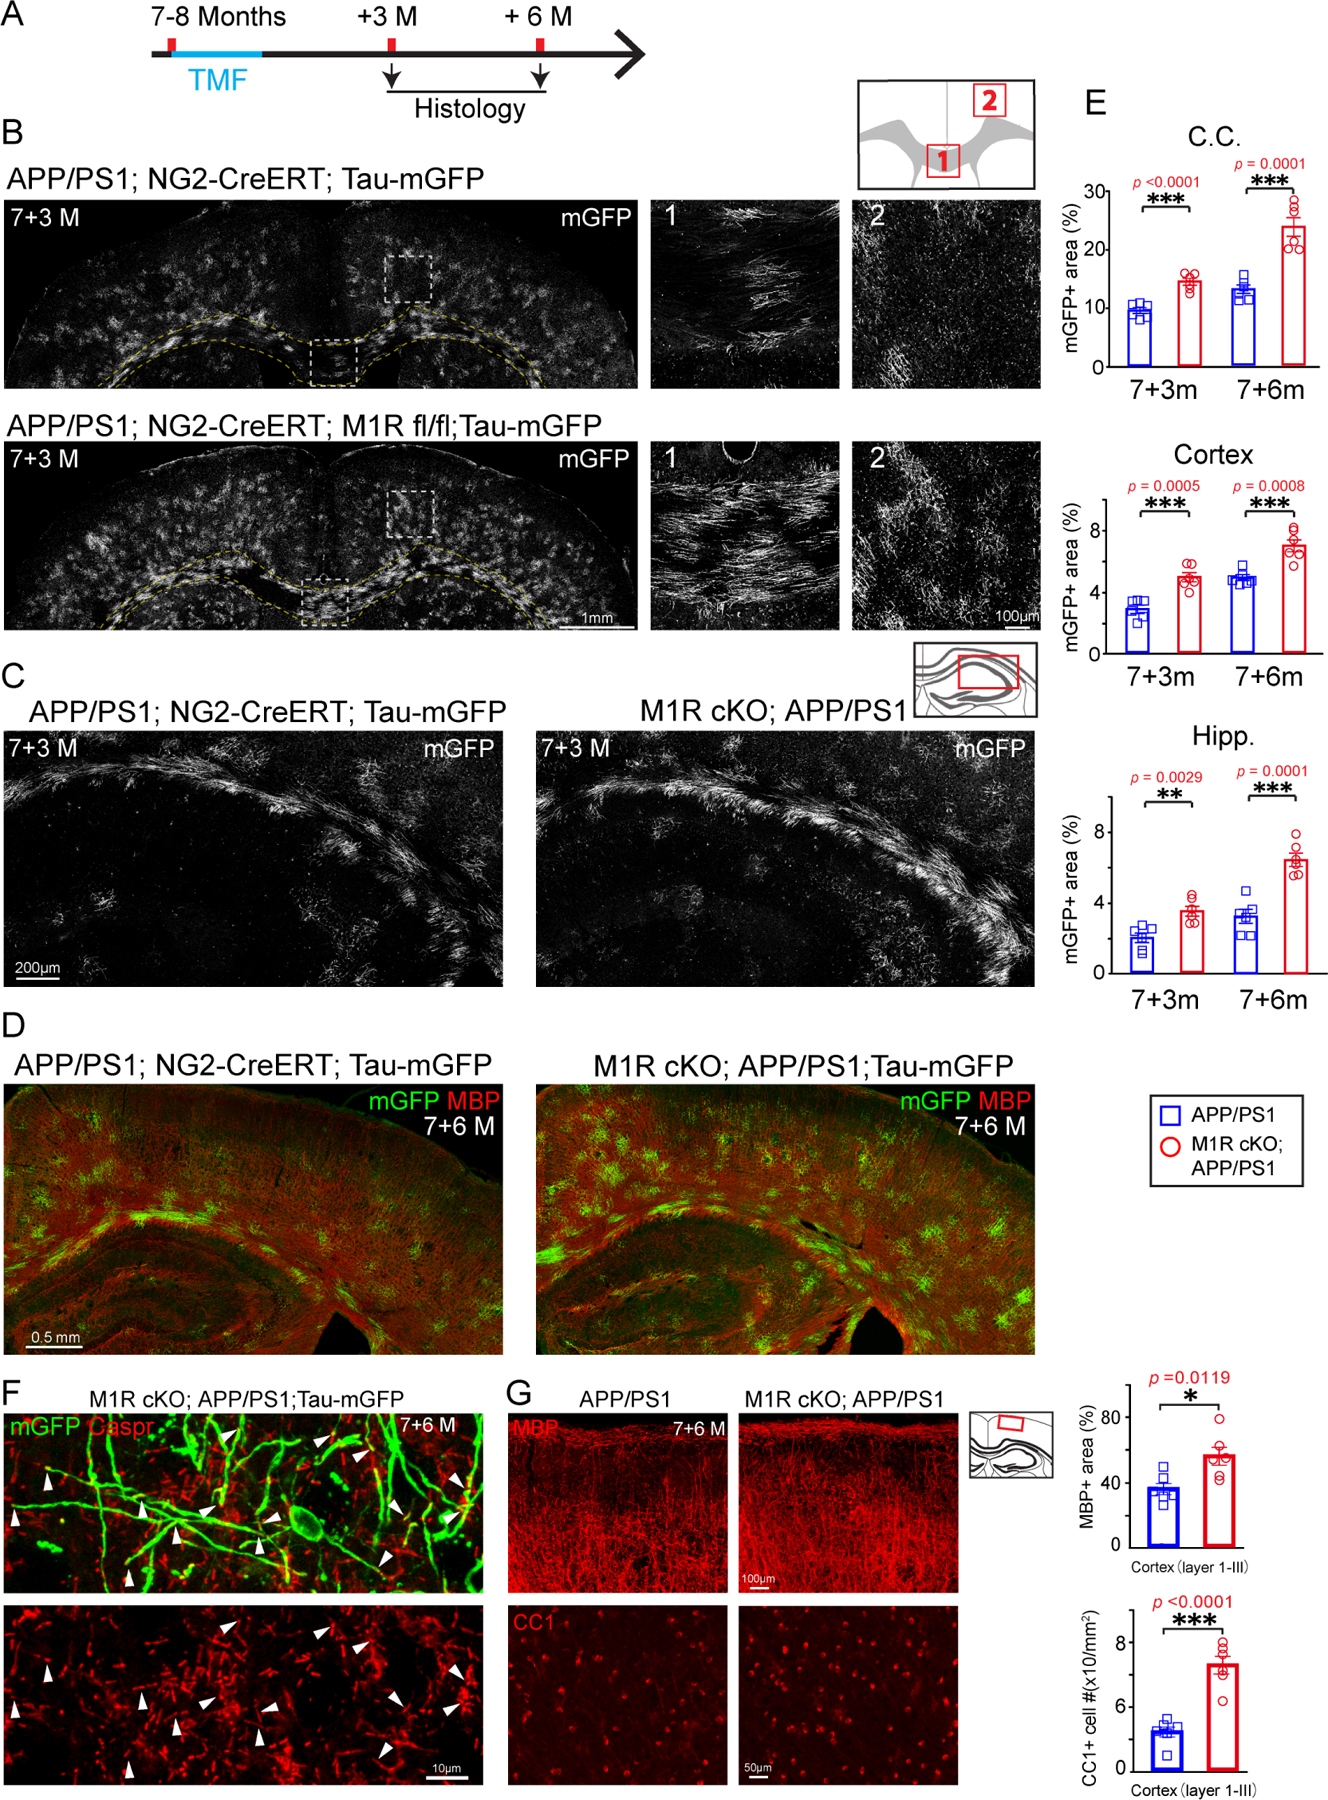
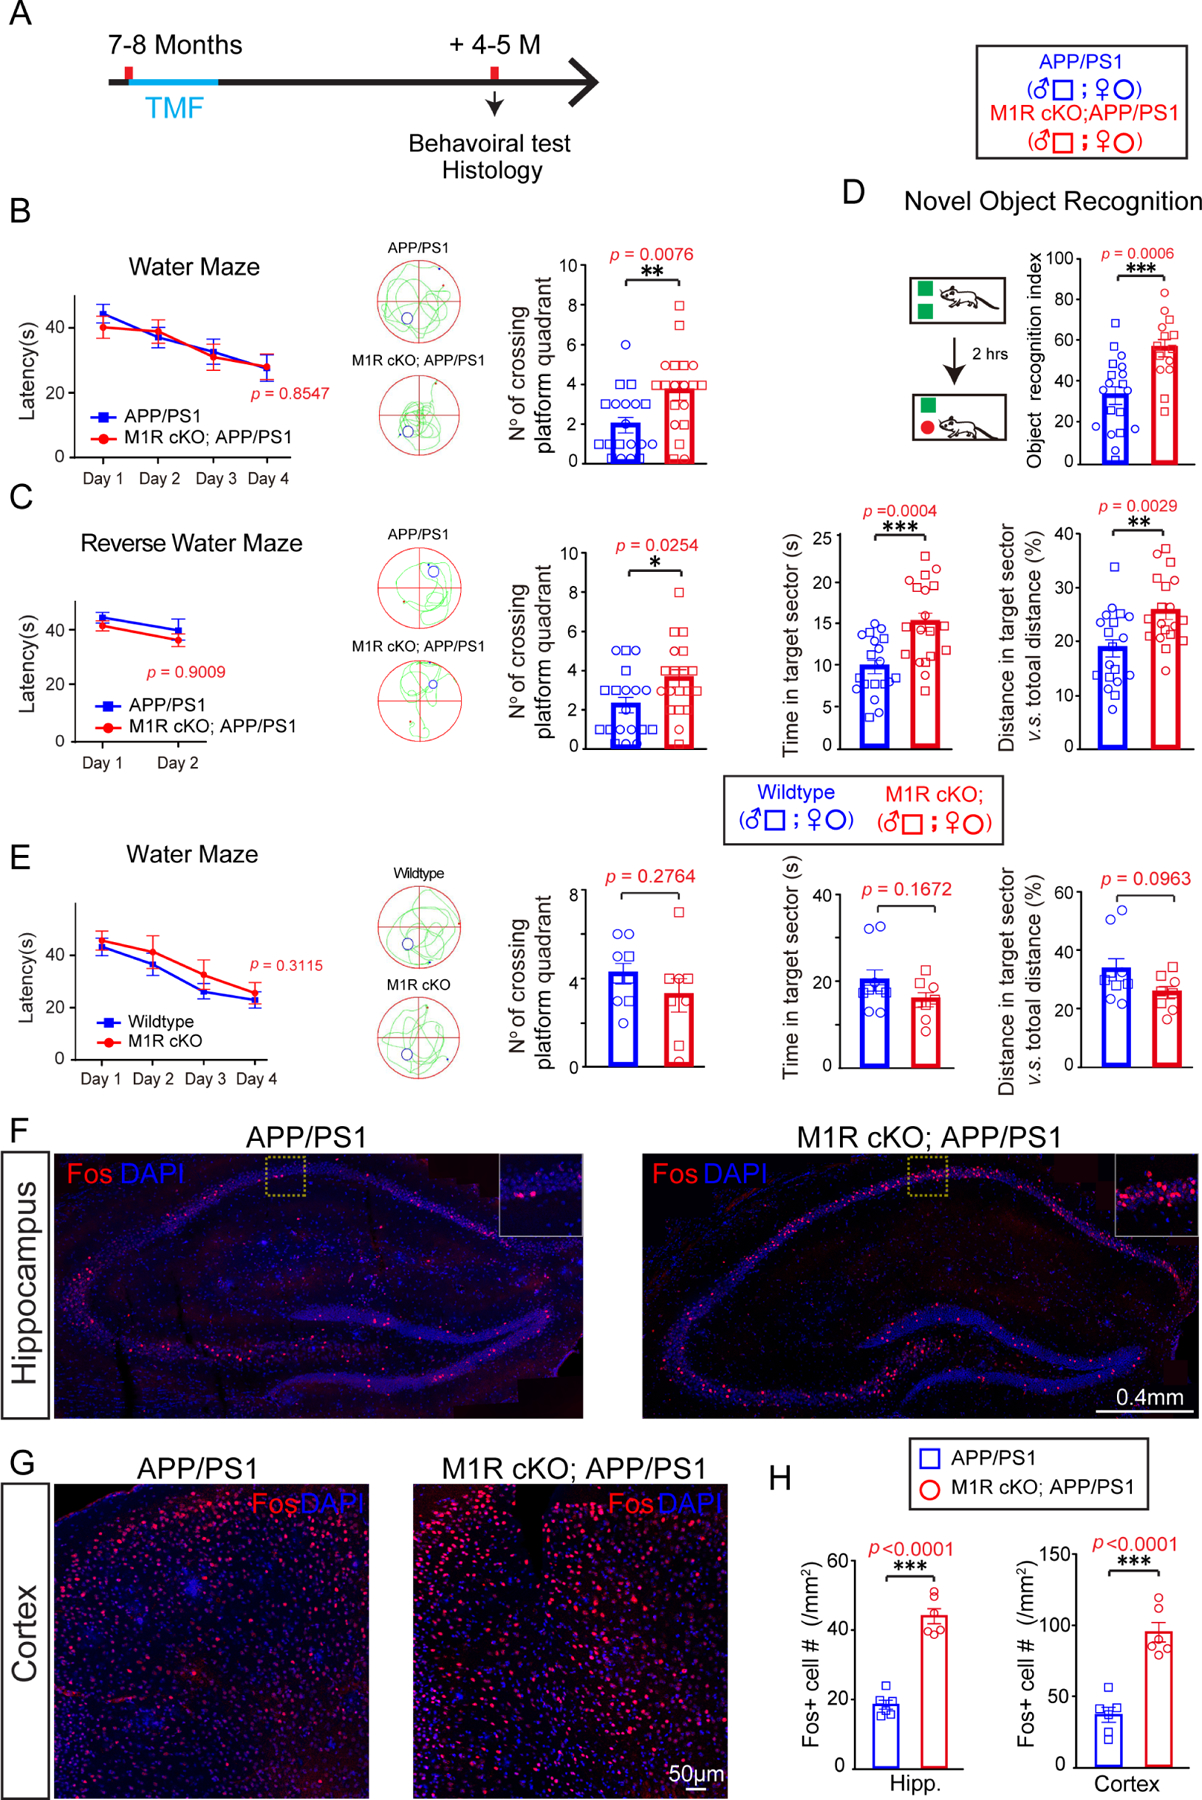
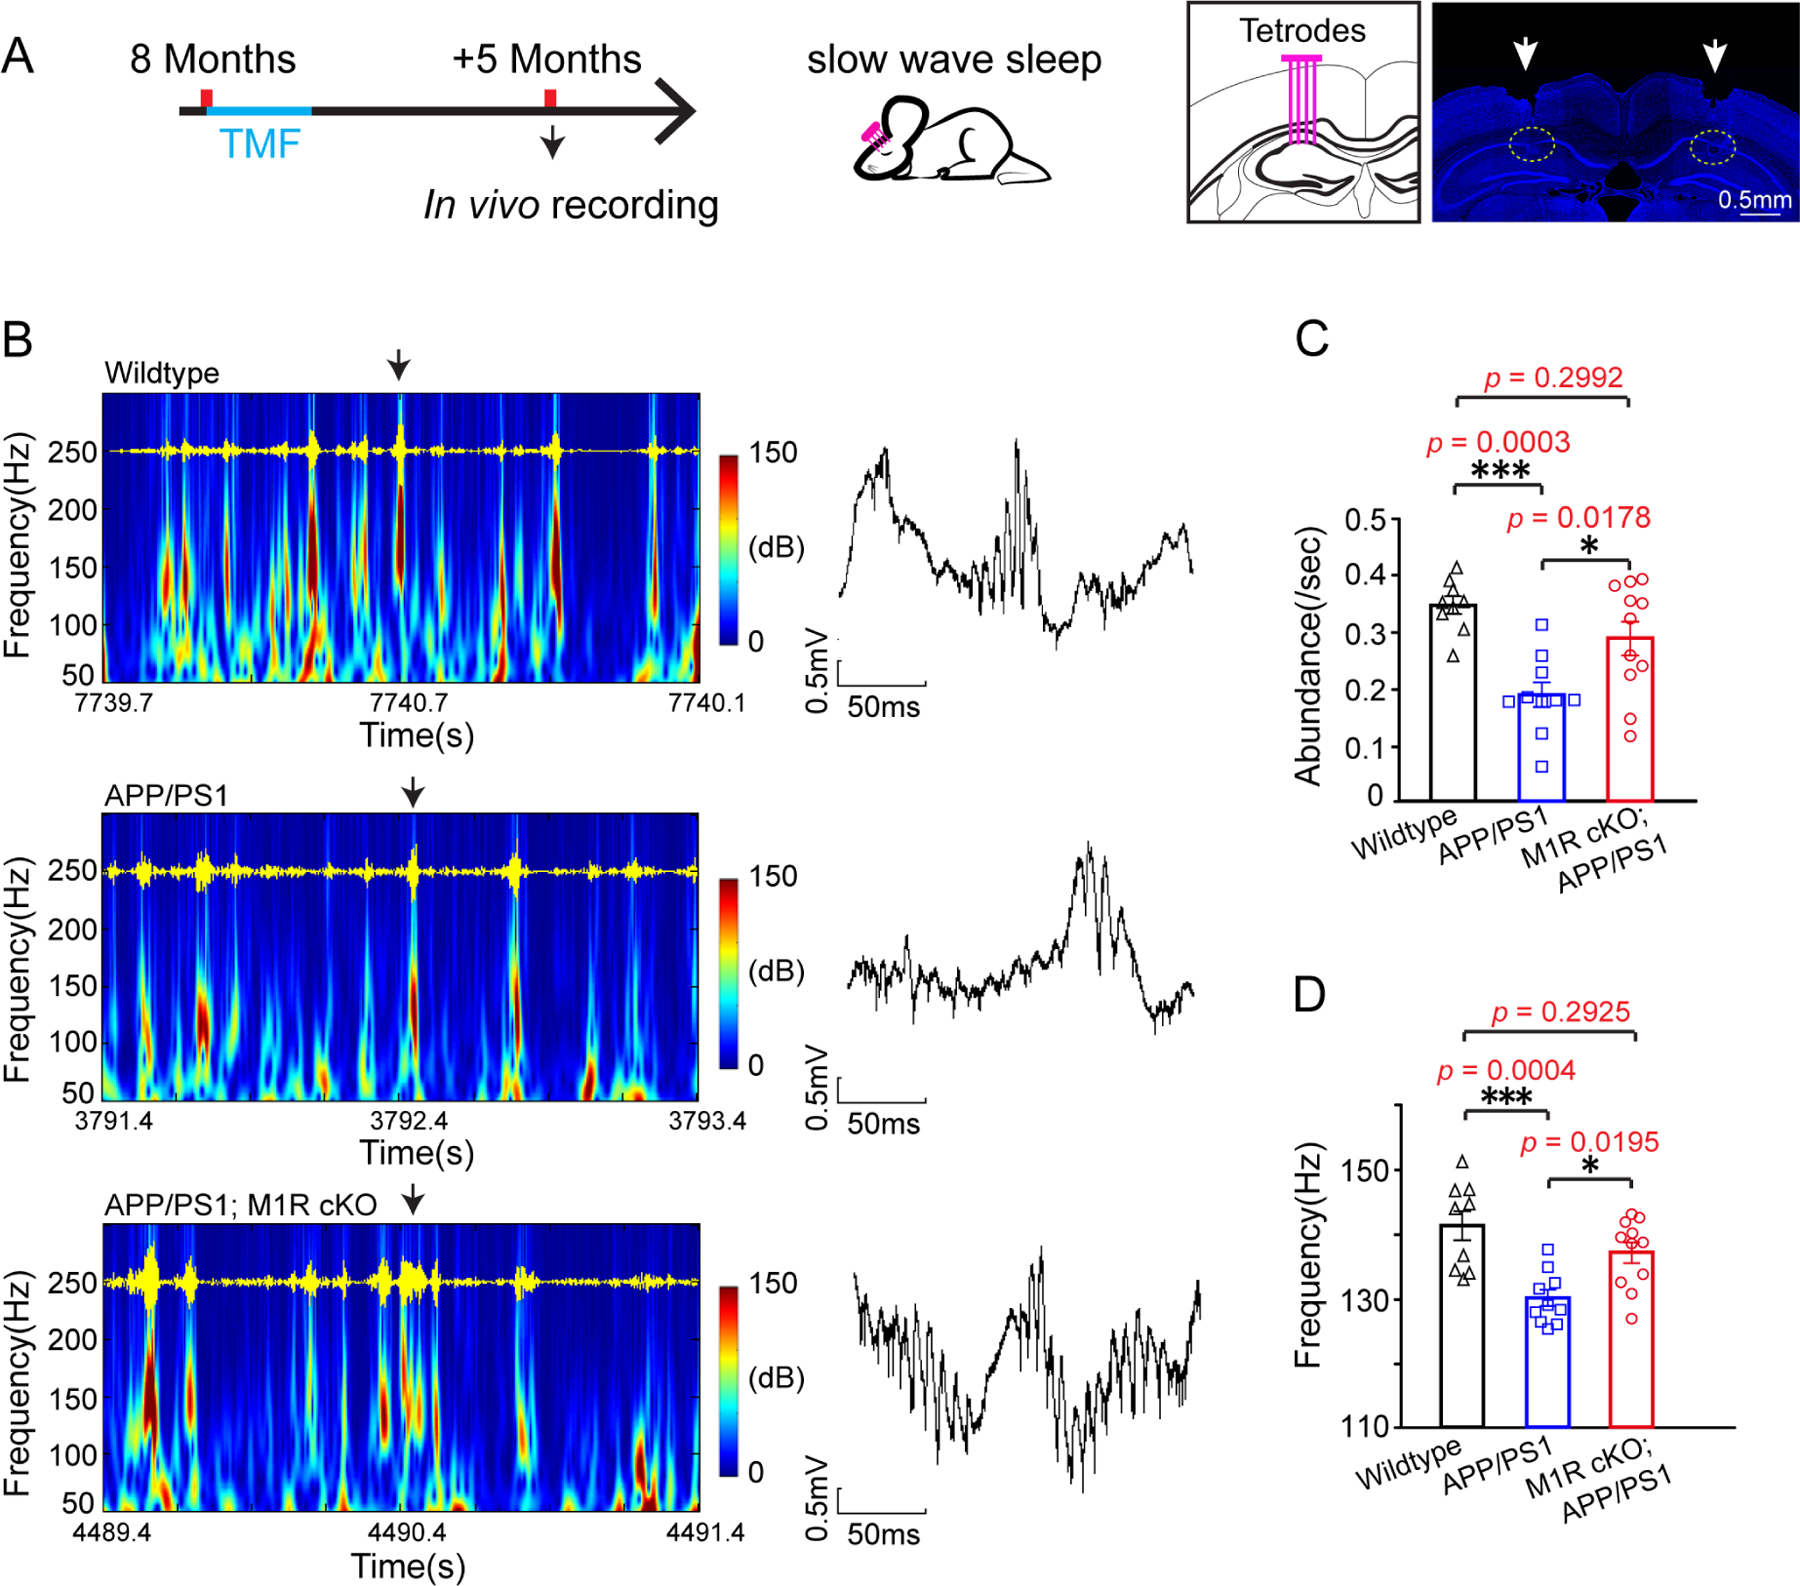
Severe cognitive decline is a hallmark of Alzheimer's disease (AD). In addition to gray matter loss, significant white matter pathology has been identified in AD patients. Here, we characterized the dynamics of myelin generation and loss in the APP/PS1 mouse model of AD. Unexpectedly, we observed a dramatic increase in the rate of new myelin formation in APP/PS1 mice, reminiscent of the robust oligodendroglial response to demyelination. Despite this increase, overall levels of myelination are decreased in the cortex and hippocampus of APP/PS1 mice and postmortem AD tissue. Genetically or pharmacologically enhancing myelin renewal, by oligodendroglial deletion of the muscarinic M1 receptor or systemic administration of the pro-myelinating drug clemastine, improved the performance of APP/PS1 mice in memory-related tasks and increased hippocampal sharp wave ripples. Taken together, these results demonstrate the potential of enhancing myelination as a therapeutic strategy to alleviate AD-related cognitive impairment.

Keywords: APP/PS1; SPW-R; clemastine; demyelination; myelination; oligodendroglia.


Conflict of interest statement

Declaration of interests The authors declare no competing interests.

Figures

Figure 1.
Figure 1.. New myelin formation and degeneration are both elevated in APP/PS1 mice.
(A) Schematic illustration showing the time course for tamoxifen induction and histology in the APP/PS1;NG2-CreERT;Tau-mGFP mice. (B-D) Confocal images of mGFP positive myelin (gray) in the corpus callosum (B), hippocampus (C) and cortex (D) of APP/PS1 mice and littermate controls. Magnified images (right panels) showing the dotted areas in the left panels in B. Scale bars, 100μm (left panels of B, C), 40μm (right panels of B) and 50μm (D). (E) Quantification of mGFP positive myelin in the corpus callosum, hippocampus and cortex of APP/PS1 mice and littermate controls. n=6 biologically independent mice for each group, two-tailed unpaired t-tests were used; (F) Schematic illustration displaying the time course for tamoxifen induction and histology in the APP/PS1;PLP-CreERT;mT/mG mice.(G and H)Representative images of mGFP positive myelin (gray) in the cortex (G)and hippocampus (H) of APP/PS1 mice and littermate controls. Scale bars, 100μm (left panels of G), 40μm (right panels of G), 20μm (H). (I) Quantification of mGFP positive myelin areas in the cortex and hippocampus of APP/PS1 mice and littermate controls. n=6 biologically independent mice for each group, two-tailed unpaired t-tests were used; Error bars are presented as mean ± s.e.m. *p<0.05, **p<0.01, ***p<0.001. See also Figure S1 and Table S1.
Figure 2.
Figure 2.. Extensive myelin loss in APP/PS1 mice and individuals with AD.
(A) Representative images and quantification of fold change of MBP-positive areas in cortex and hippocampus of 8-month old APP/PS1 transgenic mice and age-matched wildtype controls. n=6 mice in each group, significance was determined using two-tailed unpaired t-tests. Scale bar,50μm. (B) Confocal images and quantification of NG2 positive OPCs in the hippocampus of 10-month old APP/PS1 transgenic mice and controls. n=6 biologically independent mice for each group, two-tailed unpaired t-tests were used. Scale bar, 30μm. (C) Electron micrographs and quantification of myelinated axons in the corpus callosum of 17-month old APP/PS1 mice and littermate controls. Scale bar: 1μm; n = 10 images (2k) from 3 mice in each group. Two-tailed unpaired t-tests were used. (D) Blots show MBP of 4-month-old, 8-month-old wildtype and APP/PS1 mice brain. n=4 biologically independent mice for each group. Two-tailed unpaired t-tests were used. (E) Representative images and quantification of NF200-positive areas in cortex and hippocampus of 8-month old APP/PS1 transgenic mice and age-matched wildtype controls. n=5 mice in each group, significance was determined using two-tailed unpaired t-tests. Scale bar,50μm. (F) Representative images and quantification of MBP positive areas in the frontal lobe (left panels) and hippocampus (right and middle panels) of AD patients and age-matched controls. The right panels display magnified images corresponding to the dotted boxes in the middle panels. n=4 biologically independent patients for each group. Two-tailed unpaired t-tests were used. Scale bars, 20μm (left panels), 50μm (middle panels), 10μm (right panels). Error bars are presented as mean ± s.e.m. *p<0.05, **p<0.01, ***p<0.001. See also Figure S2 and Table S1.
Figure 3.
Figure 3.. M1R deletion in OPCs enhances myelin renewal and alleviates myelin loss.
(A)Schematic illustration displaying the time course for tamoxifen induction and histology of the APP/PS1;NG2-CreERT;Tau-mGFP (APP/PS1) and APP/PS1; NG2-CreERT; Tau-mGFP; M1R fl/fl (M1R cKO; APP/PS1) mice. (B and C) Representative images of mGFP positive myelin (gray) in the corpus callosum (B, B1), cortex (B, B2) and hippocampus (C) of 7+3m APP/PS1; M1R cKO and APP/PS1 mice. Magnified images (B1, B2) corresponding to the dotted boxes in the left panels (B). Scale bars, 1mm (left panels of B),100μm (B1 and B2), 200μm (C). (D) Representative images of mGFP (green) and MBP (red) positive myelin in the APP/PS1; M1R cKO and APP/PS1 mice. Scale bars, 0.5mm. (E) Quantification of mGFP positive myelin in the corpus callosum, cortex and hippocampus in APP/PS1 M1R cKO and APP/PS1 mice. n=6 biologically independent mice for each group, two-tailed unpaired t-tests were used.(F)Confocal images showing Caspr positive paranodes (arrowheads) in mGFP positive myelin. Scale bars, 10μm. (G) Confocal images and quantification of CC1 positive mature OLs (lower two panels) and MBP positive myelin (upper two panels) in the cortex of 7+6-month-old APP/PS1; M1R cKO and APP/PS1 mice. Scale bars, 100μm (upper panels), 50μm (lower panels). n=6 biologically independent mice for each group. Error bars are presented as mean ± s.e.m. *p<0.05, **p<0.01, ***p<0.001. See also Figure S3 and Table S1.
Figure 4.
Figure 4.. Improved performances of memory-related tasks in APP/PS1; M1R cKO mice.
(A) Schematic diagram displaying the time course for tamoxifen induction, behavioral test and histology. (B) Graphs showing latencies to platform in acquisition phase and number of platform crossings in probing for the Morris water maze task with the APP/PS1 mice. Two-way repeat ANOVA was used for the latency to platform; two-tailed unpaired t-tests were used for number of platform crossings. (C) Reverse water maze task revealing latencies to platform in acquisition phase, numbers of platform crossings, and time and distance spent in the target quadrant. Two-way repeat ANOVA was used for the latency to platform; two-tailed unpaired t-tests were used for number of platform crossings, time, and distance spent in the target quadrant. (D) Graph showing novel object recognition index of APP/PS1 mice and M1R cKO; APP/PS1 mice. Two-tailed unpaired t-tests was used. (E) Water maze test revealed the latency to platform in the acquisition phase, their number of crossing platform quadrant, time in target sector and the distance in target sector of wildtype and M1R cKO mice. Two-way repeat ANOVA was used for the latency to platform; two-tailed unpaired t-tests were used for number of platform crossings, time in target sector and the distance in target sector. (F-H) Representative images and quantification of Fos+ (red) cells in the hippocampus (F, H) and cortex (G, H) of APP/PS1 and M1R cKO; APP/PS1 mice. Scale bar, 0.4 mm (F), 50μm (G). Two-tailed unpaired t-tests were used. Data points represents individual animals. Error bars are presented as mean ± s.e.m. *p<0.05, **p <0.01, ***p<0.001. See also Figures S5 and Table S1.
Figure 5.
Figure 5.. M1R deletion changes hippocampal SPW-Rs and firing activity of hippocampal pyramidal cells in APP/PS1 mice.
(A) Schematic diagram displaying the time course for tamoxifen induction and in vivo recordings. Representative images showing the location of tetrode implantation. Scale bar, 0.5mm. (B) Hippocampal local field potential (LFP) spectra from the wildtype, APP/PS1 and M1R cKO; APP/PS1 mice. SPW-R oscillations (100–250 Hz) are illustrated and highlighted in red. Representative LFP traces indicated by black arrows illustrates SPW-Rs in the right panel. Scale bars: 0.5 mV, 50 ms; (C and D) Quantification of SPW-R abundance (C) and SPW-R peak frequency (D) in the wildtype (n = 9 sessions from 3 mice, gray squares), APP/PS1 mice (n=10 sessions from 3 mice, blue squares) and M1R cKO; APP/PS1 (n = 11 sessions from 3 mice, red circles). Two-tailed unpaired t-tests were used. Error bars are presented as mean ± s.e.m. *p<0.05, **p<0.01, ***p<0.001. See also Figure S5 and Table S1.
Figure 6.
Figure 6.. Clemastine treatment rescues cognitive declines in APP/PS1 mice.
(A) Schematic diagram displaying the time course for clemastine treatment, behavior test, in vivo recording and histology. (B) Representative images and quantification of mGFP positive myelin (grey) in the brain of APP/PS1; NG2-CreErt; Tau-mGFP mice induced with tamoxifen and treated with clemastine for 3 months. Two-tailed unpaired t-tests were used. Scale bar, 200μm. (C) Graphs showing latencies to platform in acquisition phase, the number of platform crossings, time and distance spent in target quadrant, swimming speed in probe test in the Morris water maze task of APP/PS1 mice after a 3-monthtreatment of clemastine or vehicle. Two-way repeat ANOVA was used for the latency to platform; two-tailed unpaired t-tests were used for number of platform crossings, time, swimming speed and distance spent in the target quadrant. See Table S1 for the statistical details. (D) Graphs showing total distance and time in the central area in the open field test. (E) Graph showing novel object recognition index of APP/PS1 mice treated with or without clemastine; Two-tailed unpaired t-tests was used. (F) Water maze test revealed the latency to platform in the acquisition phase, the number of crossing platform quadrant, time in target sector and the distance in target sector of wildtype mice treated with or without clemastine. Two-way repeat ANOVA was used for the latency to platform; two-tailed unpaired t-tests were used for number of platform crossings, time in target sector and the distance in target sector. (G) Hippocampal local field potential (LFP) spectra from the vehicle and clemastine treated APP/PS1 mice. SPW-R oscillations (100–250 Hz) are illustrated and highlighted in red. Representative LFP traces indicated by black arrows illustrates SPW-Rs in the right panel. Scale bars: 0.5 mV, 50 ms; (H) Quantification of SPW-R abundance in the vehicle (n = 7 sessions from 3 mice), clemastine treatment (n=8 sessions from 3 mice). Two-tailed unpaired t-tests were used. Error bars are presented as mean ± s.e.m. *p<0.05, **p <0.01, ***p<0.001. See also Figure S5 and Table S1.
Figure 7.
Figure 7.. OPC-specific M1R deletion and clemastine treatment does not alter Aβ deposition or clearance in APP/PS1 mice.
(A) Representative images and quantification of Aβ plaques (red arrows) in different brain regions of male or female APP/PS1 and APP/PS1; M1R cKO mice; scale bar = 0.1mm. n=6 mice for each group; (B) Micrographs showing Aβ plaques (red) and associated Iba+ cells (green) and quantification of the corralling percentage of Iba1+ cells around individual Aβ plaques in male or female APP/PS1 and APP/PS1; M1R cKO mouse brains; scale bar = 10μm. n=6 mice for each group; (C) Representative images and quantification of Iba1+ cell density in APP/PS1 and APP/PS1; M1R cKO cortex; scale bar = 50μm. n=6 mice for each group; (D) Representative images and quantification of engulfed myelin debris (red, arrows) by Iba1+ microglia in APP/PS1 and APP/PS1; M1R cKO cortex; scale bar = 10μm. Enlarged images (right panels) correspond to the dotted boxes in the left panels. 3D reconstruction of engulfed myelin debris (red, arrowheads) in an Iba1+ microglia (green); scale bar = 5μm. n=6 mice for each group. (E) Representative images and quantification of Aβ plaques in different brain regions of male or female APP/PS1 mice treated with vehicle or clemastine; scale bar = 0.1mm. n=6 mice for each group. Error bars are presented as mean ± s.e.m.

Comment in

References

    1. Able JA, Gudelsky GA, Vorhees CV, and Williams MT (2006). 3,4-Methylenedioxymethamphetamine in adult rats produces deficits in path integration and spatial reference memory. Biol Psychiatry 59, 1219–1226. - PMC - PubMed
    1. Allen D, Bond CT, Luján R, Ballesteros-Merino C, Lin MT, Wang K, Klett N, Watanabe M, Shigemoto R, Stackman RW Jr., et al. (2011). The SK2-long isoform directs synaptic localization and function of SK2-containing channels. Nat Neurosci 14, 744–749. - PMC - PubMed
    1. Alzheimer A (1911). über eigenartige Krankheitsfälle des späteren Alters. Zeitschrift für die gesamte Neurologie und Psychiatrie 4, 356.
    1. Arranz AM, and De Strooper B (2019). The role of astroglia in Alzheimer’s disease: pathophysiology and clinical implications. Lancet Neurol 18, 406–414. - PubMed
    1. Bartzokis G, Cummings JL, Sultzer D, Henderson VW, Nuechterlein KH, Mintz J. (2003) White matter structural integrity in healthy aging adults and patients with Alzheimer disease: a magnetic resonance imaging study. Archives of neurology 60: 393–398. - PubMed

Publication types

MeSH terms

Substances