. 2021 Sep;23(9):1078-1084.
doi: 10.1016/j.jmoldx.2021.05.012. Epub 2021 Jun 5.

Ct Values Do Not Predict Severe Acute Respiratory Syndrome Coronavirus 2 (SARS-CoV-2) Transmissibility in College Students

Affiliations

Ct Values Do Not Predict Severe Acute Respiratory Syndrome Coronavirus 2 (SARS-CoV-2) Transmissibility in College Students

Di Tian et al. J Mol Diagn. 2021 Sep.

Abstract

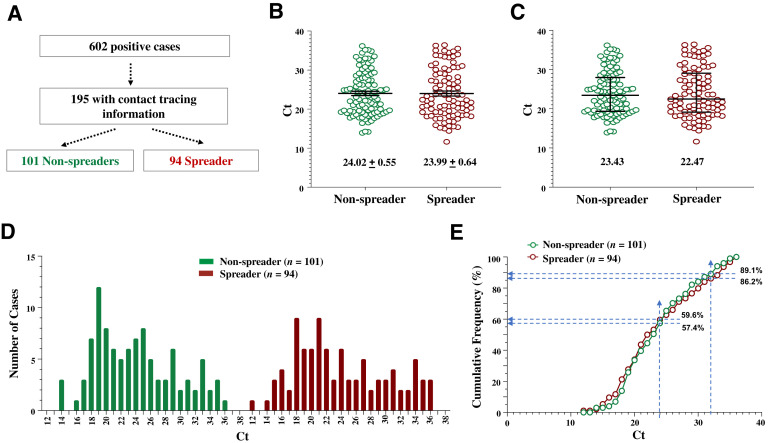
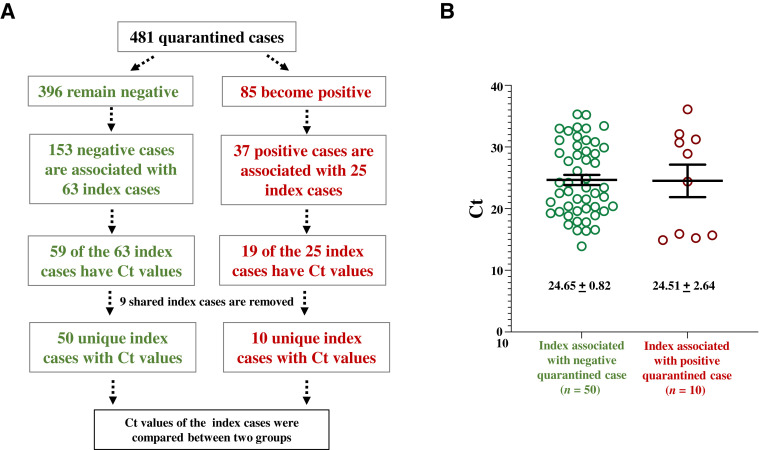
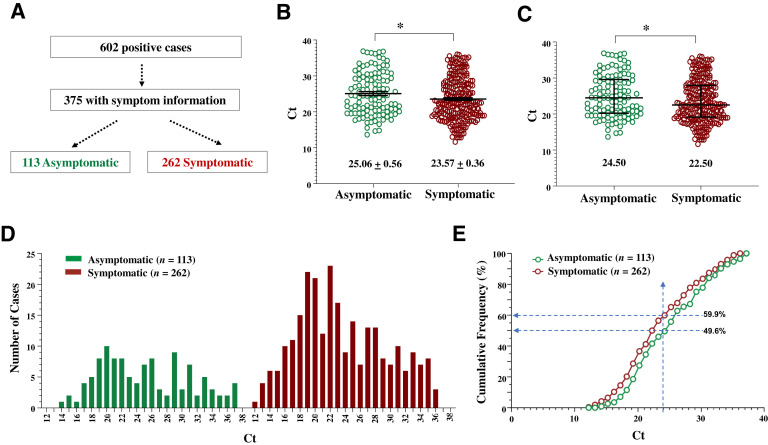
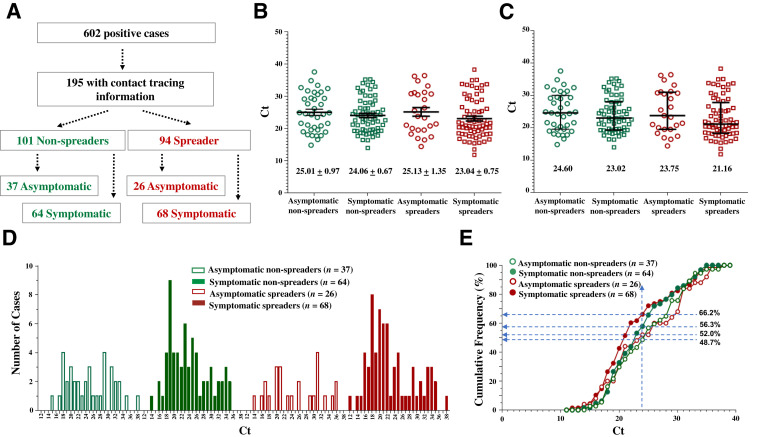
Severe acute respiratory syndrome coronavirus 2 (SARS-CoV-2) is highly contagious and has caused significant medical/socioeconomic impacts. Other than vaccination, effective public health measures, including contact tracing, isolation, and quarantine, is critical for deterring viral transmission, preventing infection progression and resuming normal activities. Viral transmission is affected by many factors, but the viral load and vitality could be among the most important ones. Although in vitro studies have indicated that the amount of virus isolated from infected individuals affects the successful rate of virus isolation, whether the viral load carried at the individual level would determine the transmissibility was unknown. We examined whether the cycle threshold (Ct) value, a measurement of viral load by RT-PCR assay, could differentiate the spreaders from the non-spreaders in a population of college students. Our results indicate that while at the population level the Ct value is lower, suggesting a higher viral load, in the symptomatic spreaders than that in the asymptomatic non-spreaders, there is a significant overlap in the Ct values between the two groups. Thus, Ct value, or the viral load, at the individual level could not predict the transmissibility. Instead, a sensitive method to detect the presence of virus is needed to identify asymptomatic individuals who may carry a low viral load but can still be infectious.


Figures

Figure 1
Figure 1
The cycle threshold (Ct) values of the spreaders and the nonspreaders are largely overlapping. A: Separation of index cases into spreader and nonspreader groups. The n of the cases in each population is indicated. B and C: Scatter plots of Ct values expressed as means ± SEM (B) or median ± interquartile intervals (C). Ct values of the indicated populations are compared. D: Histogram of the distribution of Ct values. E: Cumulative frequency of Ct values. Dashed lines indicate the cumulated percentage of each population at the designated Ct value (24 or 32). At the indicated Ct value of ≤24, there is a higher percentage of spreader cases than nonspreader cases, although the differences are small. Ct values of the indicated populations are compared. P > 0.05 (U-test; B and C).
Figure 2
Figure 2
Comparisons of cycle threshold (Ct) values of index cases tracked from quarantined cases. A: Diagram of the study design. Index cases with Ct values available are tracked back from their contacts in the quarantined units. B: The Ct values of spreader index cases and nonspreader index cases show a significant overlap. Data shown are means ± SEM. P > 0.05 (U-test).
Figure 3
Figure 3
The cycle threshold (Ct) values of the symptomatic individuals are lower than those of the asymptomatic individuals as a population. A: The separation of positive cases into symptomatic and nonsymptomatic groups. The n of the cases in each population is indicated. B and C: Scatter plots of Ct values expressed as means ± SEM (B) or median ± interquartile intervals (C). D: The histogram of the distribution of Ct values. E: The cumulative frequency of Ct values. Dashed lines indicate the cumulated percentage of each population at the Ct value of 24. At this Ct value and below, there is a higher percentage of symptomatic cases (59.9%) than asymptomatic cases (49.6%). Ct values of the indicated populations are compared. ∗P < 0.05 (U-test).
Figure 4
Figure 4
The symptomatic spreaders exhibit the lowest cycle threshold (Ct) values as a population. A: Separation of positive cases into spreaders and nonspreaders, with or without symptoms. The n of the cases in each population is indicated. B and C: Scatter plots of Ct values expressed as means ± SEM (B) or median ± interquartile intervals (C). Ct values of the indicated populations are compared. D: The histogram of the distribution of Ct values. E: The cumulative frequency of Ct values. Dashed lines indicate the cumulated percentage of each population at the Ct value of 24. At this Ct value and below, there is a higher percentage of symptomatic spreader cases (66.2%) than asymptomatic nonspreader cases (48.7%). The percentage of cases of the other groups falls between the two. Ct values of the indicated populations are compared. P > 0.05 (one-way analysis of variance; B and C).

Comment in

References

    1. Wu Z., McGoogan J.M. Characteristics of and important lessons from the coronavirus disease 2019 (COVID-19) outbreak in China: summary of a report of 72 314 cases from the Chinese Center for Disease Control and Prevention. JAMA. 2020;323:1239–1242. - PubMed
    1. Choi S., Ki M. Estimating the reproductive number and the outbreak size of COVID-19 in Korea. Epidemiol Health. 2020;42:e2020011. - PMC - PubMed
    1. Biggerstaff M., Cauchemez S., Reed C., Gambhir M., Finelli L. Estimates of the reproduction number for seasonal, pandemic, and zoonotic influenza: a systematic review of the literature. BMC Infect Dis. 2014;14:480. - PMC - PubMed
    1. Chowell G., Castillo-Chavez C., Fenimore P.W., Kribs-Zaleta C.M., Arriola L., Hyman J.M. Model parameters and outbreak control for SARS. Emerg Infect Dis. 2004;10:1258–1263. - PMC - PubMed
    1. Jefferson T., Spencer E.A., Brassey J., Heneghan C. Viral cultures for COVID-19 infectivity assessment—a systemic review. Clin Infect Dis. 2020 doi: 10.1093/cid/ciaa1764. [Epub ahead of print] doi: - DOI - PMC - PubMed