Decoding the role of the cerebellum in the early stages of reading acquisition
- PMID: 34102410
- PMCID: PMC8845234
- DOI: 10.1016/j.cortex.2021.02.033
Decoding the role of the cerebellum in the early stages of reading acquisition
Abstract
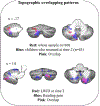
Numerous studies have consistently reported functional activation of the cerebellum during reading tasks, especially in the right cerebellar hemisphere. However, it remains unclear whether this region is also involved in reading during the earliest stages of reading acquisition. Here, we investigated whether and how the cerebellum contributes to reading acquisition. We tested 80 5-6-year-old kindergarteners, who performed a visual word matching task during which functional MRI (fMRI) data were collected. We found that bilateral cerebellar hemispheres were significantly activated during visual word processing. Moreover, activation of left cerebellar lobule VII extending to lobule VIII negatively and significantly correlated with current reading ability, whereas activation of right cerebellar lobule VII extending to lobule VIII significantly and positively correlated with future reading ability. Functional decoding via functional connectivity patterns further revealed that left and right cerebellar lobules connected with different cerebral cortex regions. Our results suggest a division of labor between the left and right cerebellar lobules in beginning readers.
Keywords: Beginning readers; Cerebellum; Division of labor; Longitudinal; Reading.
Copyright © 2021 Elsevier Ltd. All rights reserved.
Conflict of interest statement
Declarations of interest
The authors have no conflicts of interest to declare.
Figures


Similar articles
-
Dyslexic Children Show Atypical Cerebellar Activation and Cerebro-Cerebellar Functional Connectivity in Orthographic and Phonological Processing.Cerebellum. 2017 Apr;16(2):496-507. doi: 10.1007/s12311-016-0829-2. Cerebellum. 2017. PMID: 27785760
-
Functional parcellation of the right cerebellar lobule VI in children with normal or impaired reading.Neuropsychologia. 2020 Nov;148:107630. doi: 10.1016/j.neuropsychologia.2020.107630. Epub 2020 Sep 23. Neuropsychologia. 2020. PMID: 32976851 Free PMC article.
-
The selective contributions of right cerebellar lobules to reading.Brain Struct Funct. 2022 Apr;227(3):963-977. doi: 10.1007/s00429-021-02434-1. Epub 2022 Jan 8. Brain Struct Funct. 2022. PMID: 34997379
-
Explicit and Implicit Emotion Processing in the Cerebellum: A Meta-analysis and Systematic Review.Cerebellum. 2023 Oct;22(5):852-864. doi: 10.1007/s12311-022-01459-4. Epub 2022 Aug 23. Cerebellum. 2023. PMID: 35999332 Free PMC article.
-
Functional topography of the human cerebellum.Handb Clin Neurol. 2018;154:59-70. doi: 10.1016/B978-0-444-63956-1.00004-7. Handb Clin Neurol. 2018. PMID: 29903452 Review.
Cited by
-
Distinguishing Dyslexia, Attention Deficit, and Learning Disorders: Insights from AI and Eye Movements.Bioengineering (Basel). 2025 Jul 5;12(7):737. doi: 10.3390/bioengineering12070737. Bioengineering (Basel). 2025. PMID: 40722429 Free PMC article.
-
The neural correlates of individual differences in numerosity perception: A voxel-based morphometry study.iScience. 2023 Jul 14;26(8):107392. doi: 10.1016/j.isci.2023.107392. eCollection 2023 Aug 18. iScience. 2023. PMID: 37554464 Free PMC article.
-
Cerebellar Neuromodulation Impacts Reading Fluency in Young Adults.Neurobiol Lang (Camb). 2024 Aug 15;5(3):736-756. doi: 10.1162/nol_a_00124. eCollection 2024. Neurobiol Lang (Camb). 2024. PMID: 39175787 Free PMC article.
-
Atypical Neural Responses to Native and Non-Native Language in Infants at High Likelihood for Developing Autism.Res Sq [Preprint]. 2024 Dec 3:rs.3.rs-5190659. doi: 10.21203/rs.3.rs-5190659/v1. Res Sq. 2024. Update in: Mol Autism. 2025 Feb 03;16(1):6. doi: 10.1186/s13229-025-00640-w. PMID: 39678338 Free PMC article. Updated. Preprint.
-
Degree centrality values in the left calcarine as a potential imaging biomarker for anxious major depressive disorder.World J Psychiatry. 2025 Apr 19;15(4):100289. doi: 10.5498/wjp.v15.i4.100289. eCollection 2025 Apr 19. World J Psychiatry. 2025. PMID: 40309609 Free PMC article.
References
-
- Andersson JL, Jenkinson M, & Smith S (2007a). Non-linear registration aka Spatial normalisation FMRIB Technial Report TR07JA2. FMRIB Analysis Group of the University of Oxford.
-
- Andersson JL, Jenkinson M, & Smith S (2007b). Non-linear registration, aka spatial normalisation FMRIB technical report TR07JA2: Oxford, United Kingdom FMRIB Centre.
Publication types
MeSH terms
Grants and funding
LinkOut - more resources
Full Text Sources

