

Geographical variation and temporal trend in anemia among children aged 6-59 months in low- and middle-income countries during 2000-2018: forecasting the 2030 SDG target
- PMID: 34103114
- PMCID: PMC11148617
- DOI: 10.1017/S1368980021002482
Geographical variation and temporal trend in anemia among children aged 6-59 months in low- and middle-income countries during 2000-2018: forecasting the 2030 SDG target
Abstract
Objective: To examine geographical variations, trends and projections in the prevalence of childhood anemia at national and subpopulation levels.
Design: Repeated cross-sectional Demographic and Health Survey (DHS) conducted during 2000-2018.
Setting: Fifty-three low- and middle-income countries (LMIC).
Participants: Totally, 776 689 children aged 6-59 months.
Results: During the latest DHS rounds between 2005 and 2018, the prevalence of child anemia was > 20 % in fifty-two out of fifty-three countries and ranged from 15·9 % in Armenia in 2016 to 87·8 % in Burkina Faso in 2010. Out of thirty-six countries with at least two surveys during 2000-2018, the prevalence of child anemia decreased in twenty-two countries, highest in Zimbabwe (-4·2 %) and increased in fourteen countries, highest in Burundi (5·0 %). Based on the trend, eleven and twenty-two out of thirty-six countries are projected to experience, respectively, moderate and severe public health problem according to the WHO criteria (moderate problem: 20-39·9 % and severe problem: ≥ 40 %) due to child anemia in 2030, with the highest prevalence in Liberia (87·5 %, 95 % credible interval 52·0-98·8 %). The prevalence of child anemia varied across the mother's education and age, child sex, wealth quintiles, and place of residence, with the highest rate of child anemia among the poorest, rural and low-educated mothers. These scenarios are projected to continue. The probability of reducing child anemia at < 0·5 % by 2030 is 0 % for all study countries.
Conclusions: The prevalence of child anemia varied between and within countries. None of the thirty-six LMIC is likely to eradicate child anemia by 2030.
Keywords: Childhood anemia; Low- and middle-income countries; Temporal analysis.
Figures

 , Among female;
  , among male
 , Predicted anemia;
  , credible interval for predicted anemia;
  , observed anemia
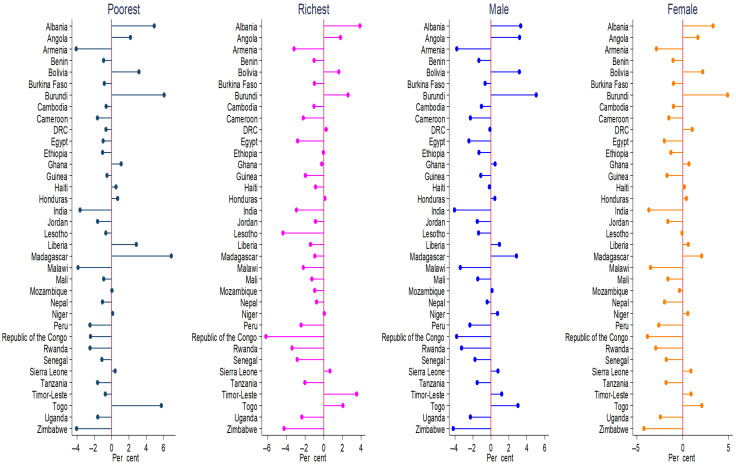

 , Among poorest;
  , among richest
 , Richest;
  , poorest; , male; , female
References
-
- McLean E, Cogswell M, Egli I et al. (2009) Worldwide prevalence of anaemia, WHO Vitamin and Mineral Nutrition Information System, 1993–2005. Public Health Nutr 12, 444–454. - PubMed
-
- World Health Organization (WHO) (2008) Worldwide prevalence of anaemia 1993–2005. WHO Global Database on Anaemia. https://apps.who.int/iris/handle/10665/43894 (accessed January 2021).
-
- Roser M, Ritchie H & Dadonaite B (2013) Child and Infant Mortality. Our World Data. https://ourworldindata.org/child-mortality (accessed January 2021).
MeSH terms
LinkOut - more resources
Full Text Sources
Medical
