. 2021 Nov;11(11):2924-2943.
doi: 10.1158/2159-8290.CD-20-1378. Epub 2021 Jun 8.

AXL Inhibition in Macrophages Stimulates Host-versus-Leukemia Immunity and Eradicates Naïve and Treatment-Resistant Leukemia

Affiliations

AXL Inhibition in Macrophages Stimulates Host-versus-Leukemia Immunity and Eradicates Naïve and Treatment-Resistant Leukemia

Irene Tirado-Gonzalez et al. Cancer Discov. 2021 Nov.

Abstract

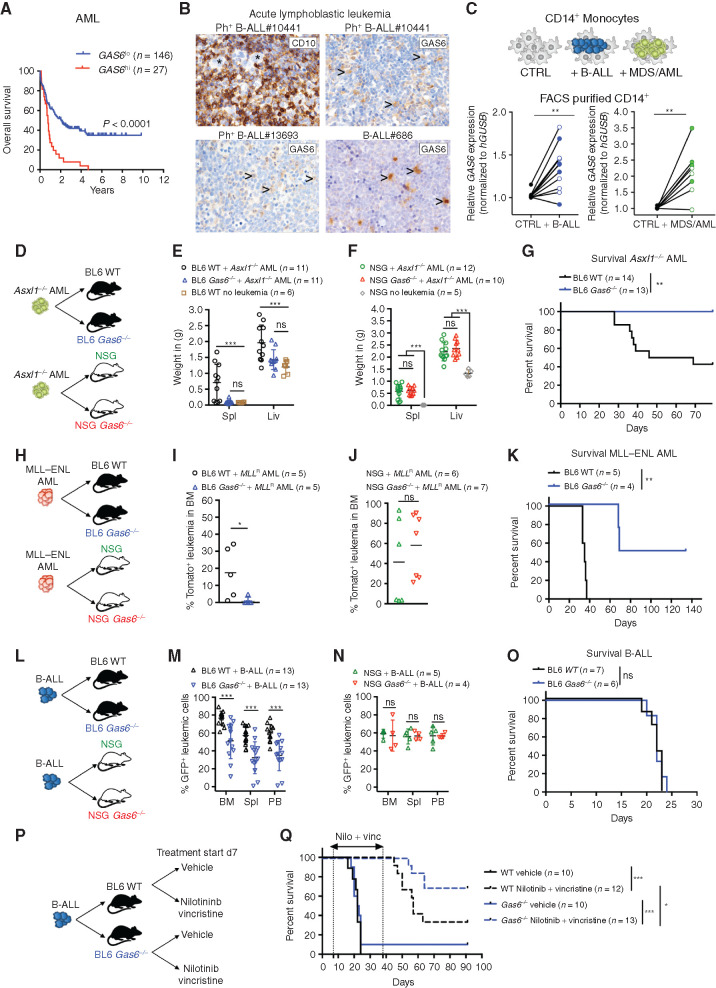
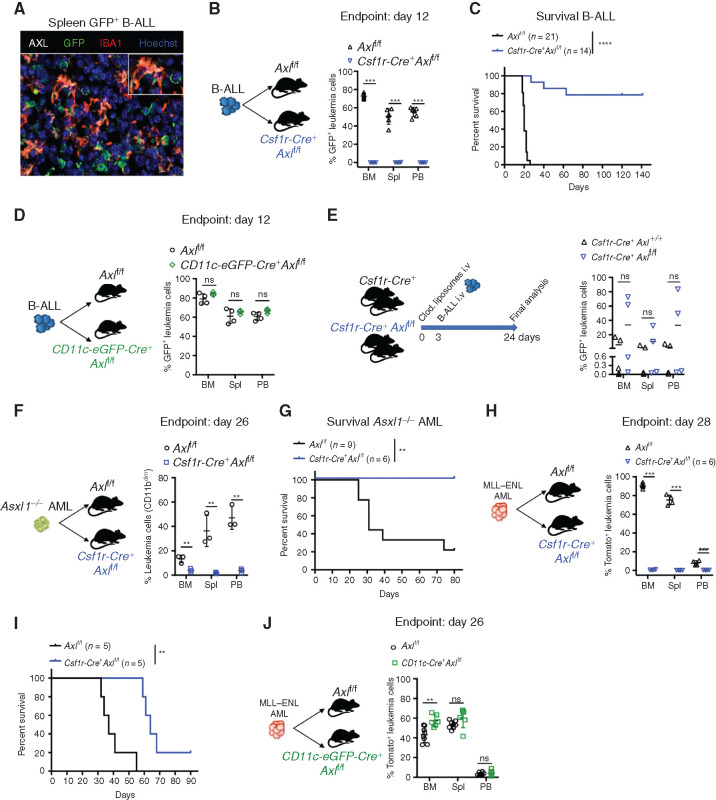
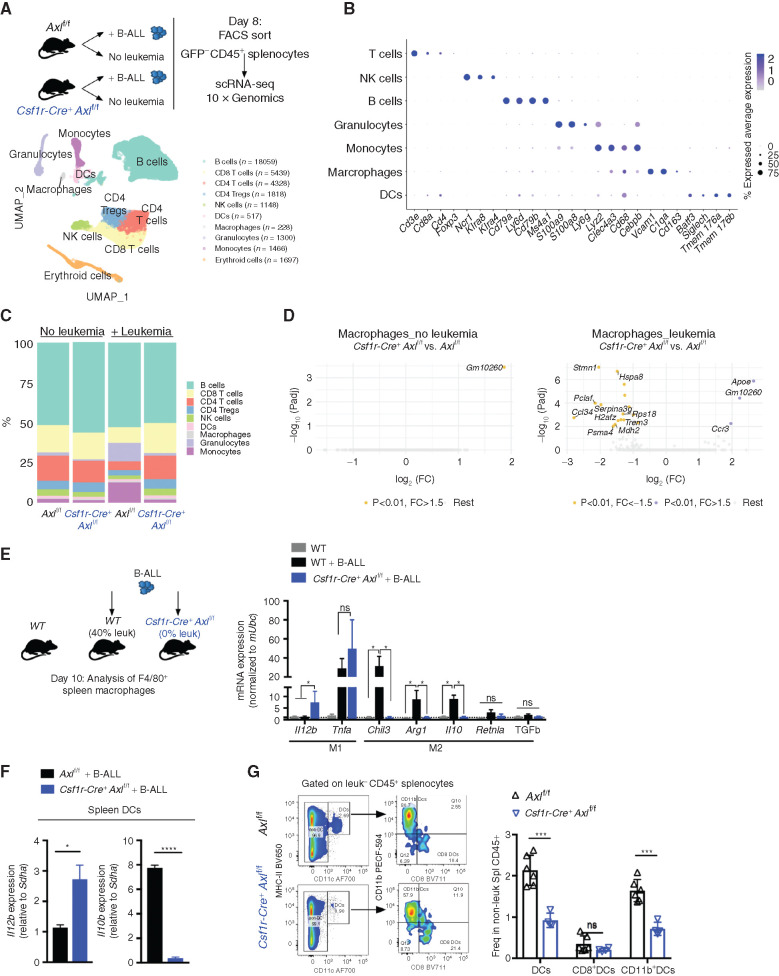
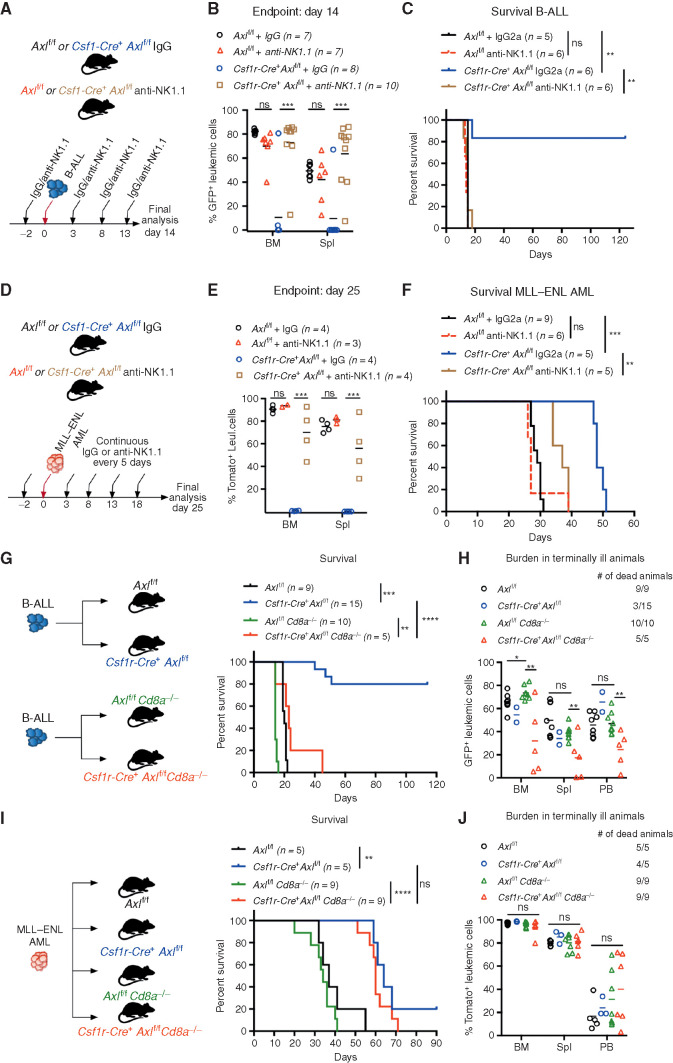
Acute leukemias are systemic malignancies associated with a dire outcome. Because of low immunogenicity, leukemias display a remarkable ability to evade immune control and are often resistant to checkpoint blockade. Here, we discover that leukemia cells actively establish a suppressive environment to prevent immune attacks by co-opting a signaling axis that skews macrophages toward a tumor-promoting tissue repair phenotype, namely the GAS6/AXL axis. Using aggressive leukemia models, we demonstrate that ablation of the AXL receptor specifically in macrophages, or its ligand GAS6 in the environment, stimulates antileukemic immunity and elicits effective and lasting natural killer cell- and T cell-dependent immune response against naïve and treatment-resistant leukemia. Remarkably, AXL deficiency in macrophages also enables PD-1 checkpoint blockade in PD-1-refractory leukemias. Finally, we provide proof-of-concept that a clinical-grade AXL inhibitor can be used in combination with standard-of-care therapy to cure established leukemia, regardless of AXL expression in malignant cells. SIGNIFICANCE: Alternatively primed myeloid cells predict negative outcome in leukemia. By demonstrating that leukemia cells actively evade immune control by engaging AXL receptor tyrosine kinase in macrophages and promoting their alternative priming, we identified a target which blockade, using a clinical-grade inhibitor, is vital to unleashing the therapeutic potential of myeloid-centered immunotherapy.This article is highlighted in the In This Issue feature, p. 2659.


Figures

Figure 1. Leukemia-induced GAS6 contributes to immune evasion and leukemic progression. A, Prognostic value of GAS6 expression in AML (TCGA LAML, n = 173). Data was generated using the KaplanScan mode from the R2 Genomics Analysis and Visualization Platform (http://r2.amc.nl). Survival analysis by log-rank (Mantel–Cox) test. B, IHC of GAS6 on bone marrow trephine biopsies from representative patients with Ph+ (BCR–ABL1+) B-ALL at diagnosis. CD10 marks B-ALL blasts (upper left). Arrowhead marks myeloid cells. C, CD14+ peripheral blood monocytes from healthy donors were cultured with leukemia cells from either patients with Ph+ B-ALL (left, CD14+ from 11 donors cultured with 2 Ph+ B-ALL) or patients with myeloid diseases (right, CD14+ from 8 donors cultured with 1 AML and 1 higher-risk MDS). GAS6 mRNA levels were then determined by real-time PCR. Each data point represents a mean value obtained from two technical replicates, after normalization to a reference gene, GUSB. **, P < 0.01, paired two-tailed Student t test. Characteristics of all patients and healthy donors are described in Supplementary Table S1. D–F, Wild-type (WT) and Gas6−/− C57BL/6 or NSG (NSG Gas6−/−, line#697-31) mice were challenged with Asxl1−/− leukemia cells (105). Weight of spleens and livers on day 19 days post–leukemia challenge are displayed. NSG (n = 5) and C57BL/6 (n = 6) mice without leukemia are used as reference. ns, not significant. ***, P < 0.001, paired two-tailed Student t test. G, Kaplan–Meier survival analysis of WT and Gas6−/− C57BL/6 challenged with Asxl1−/− leukemia cells (105). **, P < 0.01, log-rank (Mantel–Cox) test. H–J, WT and Gas6−/− C57BL/6 or NSG (NSG Gas6−/−, line#697-31) mice were challenged with MLL–ENL AML cells (105). BM aspiration was performed after 22 days to determine leukemic burden (Tomato+). ns, not significant. *, P < 0.05, paired two-tailed Student t test. K, Kaplan–Meier survival analysis of WT and Gas6−/− C57BL/6 challenged with MLL–ENL AML cells (105). **, P < 0.01, log-rank (Mantel–Cox) test. L–N, WT and Gas6−/− C57BL/6 or NSG (NSG Gas6−/−, line#697-29) mice were challenged with B-ALL cells (103) and analyzed two weeks post–leukemia injection for leukemic burden (B220+GFP+) in bone marrow (BM), spleen (Spl), and peripheral blood (PB). This experiment was repeated with a different NSG Gas6−/− mouse line (line#697-31) with similar results (Supplementary Fig. S3E). ns, not significant. ***, P < 0.001, paired two-tailed Student t test. O, Kaplan–Meier survival analysis of WT and Gas6−/− C57BL/6 challenged with B-ALL cells (103). ns, not significant, log-rank (Mantel–Cox) test. P and Q, Kaplan–Meier survival analysis of WT and Gas6−/− C57BL/6 challenged with B-ALL cells (103) and subjected to either vehicle or nilotinib plus vincristine treatment combination. Treatment was initiated on day 7 and terminated on day 39. Data representative of at least two independent experiments. *, P < 0.05; ***, P < 0.001, log-rank (Mantel–Cox) test.
Figure 1.
Leukemia-induced GAS6 contributes to immune evasion and leukemic progression. A, Prognostic value of GAS6 expression in AML (TCGA LAML, n = 173). Data was generated using the KaplanScan mode from the R2 Genomics Analysis and Visualization Platform (http://r2.amc.nl). Survival analysis by log-rank (Mantel–Cox) test. B, IHC of GAS6 on bone marrow trephine biopsies from representative patients with Ph+ (BCR–ABL1+) B-ALL at diagnosis. CD10 marks B-ALL blasts (upper left). Arrowhead marks myeloid cells. C, CD14+ peripheral blood monocytes from healthy donors were cultured with leukemia cells from either patients with Ph+ B-ALL (left, CD14+ from 11 donors cultured with 2 Ph+ B-ALL) or patients with myeloid diseases (right, CD14+ from 8 donors cultured with 1 AML and 1 higher-risk MDS). GAS6 mRNA levels were then determined by real-time PCR. Each data point represents a mean value obtained from two technical replicates, after normalization to a reference gene, GUSB. **, P < 0.01, paired two-tailed Student t test. Characteristics of all patients and healthy donors are described in Supplementary Table S1. D–F, Wild-type (WT) and Gas6−/− C57BL/6 or NSG (NSG Gas6−/−, line#697-31) mice were challenged with Asxl1−/− leukemia cells (105). Weight of spleens and livers on day 19 days post–leukemia challenge are displayed. NSG (n = 5) and C57BL/6 (n = 6) mice without leukemia are used as reference. ns, not significant. ***, P < 0.001, paired two-tailed Student t test. G, Kaplan–Meier survival analysis of WT and Gas6−/− C57BL/6 challenged with Asxl1−/− leukemia cells (105). **, P < 0.01, log-rank (Mantel–Cox) test. H–J, WT and Gas6−/− C57BL/6 or NSG (NSG Gas6−/−, line#697-31) mice were challenged with MLL–ENL AML cells (105). BM aspiration was performed after 22 days to determine leukemic burden (Tomato+). ns, not significant. *, P < 0.05, paired two-tailed Student t test. K, Kaplan–Meier survival analysis of WT and Gas6−/− C57BL/6 challenged with MLL–ENL AML cells (105). **, P < 0.01, log-rank (Mantel–Cox) test. L–N, WT and Gas6−/− C57BL/6 or NSG (NSG Gas6−/−, line#697-29) mice were challenged with B-ALL cells (103) and analyzed two weeks post–leukemia injection for leukemic burden (B220+GFP+) in bone marrow (BM), spleen (Spl), and peripheral blood (PB). This experiment was repeated with a different NSG Gas6−/− mouse line (line#697-31) with similar results (Supplementary Fig. S3E). ns, not significant. ***, P < 0.001, paired two-tailed Student t test. O, Kaplan–Meier survival analysis of WT and Gas6−/− C57BL/6 challenged with B-ALL cells (103). ns, not significant, log-rank (Mantel–Cox) test. P and Q, Kaplan–Meier survival analysis of WT and Gas6−/− C57BL/6 challenged with B-ALL cells (103) and subjected to either vehicle or nilotinib plus vincristine treatment combination. Treatment was initiated on day 7 and terminated on day 39. Data representative of at least two independent experiments. *, P < 0.05; ***, P < 0.001, log-rank (Mantel–Cox) test.
Figure 2. Selective Axl ablation in macrophages confers effective protection against leukemia. A, Representative immune fluorescence showing AXL expression (white) in IBA1+ leukemia-associated macrophages (red) in the spleen of a B-ALL leukemia–bearing mouse. B, Leukemic burden (% of GFP+ B220+) in bone marrow (BM), spleen (Spl), and peripheral blood (PB) of Axlf/f (n = 6) and Csf1r-Cre+ Axlf/f (n = 4) animals 12 days after challenge with 103 B-ALL cells. ***, P < 0.001, unpaired two-tailed Student t test. Experiment is representative of at least three experiments. C, Kaplan–Meier survival analysis of control Axlf/f and Csf1r-Cre+ Axlf/f animals challenged with 103 Ph+ B-ALL. Data are from two independent experiments. Similar results obtained in a third experiment using a different primary B-ALL. ****, P < 0.0001, log-rank (Mantel–Cox) test. D, Leukemic burden (% of GFP+ B220+) in bone marrow, spleen, and peripheral blood of Axlf/f (n = 4) and CD11c-Cre+ (CD11c-eGFP-Cre+ Axlf/f, n = 3) mice 12 days after challenge with 103 B-ALL cells. ns, not significant, unpaired two-tailed Student t test. Experiment is representative of two independent experiments. E, Csf1r-Cre+ control mice (n = 5) and Csf1r-Cre+ Axlf/f mice (n = 4) received 1 injection of clodronate liposomes (250 μL i.v./mouse) 3 days before challenge with 103 B-ALL cells. Three weeks later, when the first mouse was terminally ill, all mice were sacrificed and leukemic burden evaluated in bone marrow, spleen, and peripheral blood. ns, not significant, unpaired two-tailed Student t test. F, Axlf/f (n = 3) and Csf1r-Cre+ Axlf/f (n = 3) animals were challenged with 5 × 10⁵ Asxl1−/− AML cells. At day 26, leukemic burden (CD11bdimB220dim) in bone marrow, spleen, and peripheral blood is depicted. **, P < 0.01, unpaired two-tailed Student t test. G, Kaplan–Meier survival analysis of control Axlf/f (n = 9) and Csf1r-Cre+ Axlf/f (n = 6) animals challenged with 105 Asxl1−/− AML as in F. **, P < 0.01, log-rank (Mantel–Cox) test. H, Axlf/f (n = 4) and Csf1r-Cre+ Axlf/f (n = 4) animals were challenged with 105 MLL–ENL AML cells. At day 28, leukemic burden (% tomato+ CD11b+) in bone marrow, spleen, and peripheral blood is depicted. ***, P < 0.001, unpaired two-tailed Student t test. I, Kaplan–Meier survival analysis of control Axlf/f and Csf1r-Cre+ Axlf/f animals challenged with 105 MLL–ENL AML. These mice are also depicted in Fig. 4I. **, P < 0.01, log-rank (Mantel–Cox) test. J, Axlf/f (n = 8) and CD11c-Cre+ (CD11c-eGFP-Cre+ Axlf/f, n = 6) mice were challenged with 105 MLL–ENL AML. On day 26, leukemic burden (% tomato+ CD11b+) in bone marrow, spleen, and peripheral blood is depicted. ns, not significant, unpaired two-tailed Student t test.
Figure 2.
Selective Axl ablation in macrophages confers effective protection against leukemia. A, Representative immune fluorescence showing AXL expression (white) in IBA1+ leukemia-associated macrophages (red) in the spleen of a B-ALL leukemia–bearing mouse. B, Leukemic burden (% of GFP+ B220+) in bone marrow (BM), spleen (Spl), and peripheral blood (PB) of Axlf/f (n = 6) and Csf1r-Cre+ Axlf/f (n = 4) animals 12 days after challenge with 103 B-ALL cells. ***, P < 0.001, unpaired two-tailed Student t test. Experiment is representative of at least three experiments. C, Kaplan–Meier survival analysis of control Axlf/f and Csf1r-Cre+ Axlf/f animals challenged with 103 Ph+ B-ALL. Data are from two independent experiments. Similar results obtained in a third experiment using a different primary B-ALL. ****, P < 0.0001, log-rank (Mantel–Cox) test. D, Leukemic burden (% of GFP+ B220+) in bone marrow, spleen, and peripheral blood of Axlf/f (n = 4) and CD11c-Cre+ (CD11c-eGFP-Cre+ Axlf/f, n = 3) mice 12 days after challenge with 103 B-ALL cells. ns, not significant, unpaired two-tailed Student t test. Experiment is representative of two independent experiments. E,Csf1r-Cre+ control mice (n = 5) and Csf1r-Cre+ Axlf/f mice (n = 4) received 1 injection of clodronate liposomes (250 μL i.v./mouse) 3 days before challenge with 103 B-ALL cells. Three weeks later, when the first mouse was terminally ill, all mice were sacrificed and leukemic burden evaluated in bone marrow, spleen, and peripheral blood. ns, not significant, unpaired two-tailed Student t test. F,Axlf/f (n = 3) and Csf1r-Cre+ Axlf/f (n = 3) animals were challenged with 5 × 10⁵Asxl1−/− AML cells. At day 26, leukemic burden (CD11bdimB220dim) in bone marrow, spleen, and peripheral blood is depicted. **, P < 0.01, unpaired two-tailed Student t test. G, Kaplan–Meier survival analysis of control Axlf/f (n = 9) and Csf1r-Cre+ Axlf/f (n = 6) animals challenged with 105Asxl1−/− AML as in F. **, P < 0.01, log-rank (Mantel–Cox) test. H,Axlf/f (n = 4) and Csf1r-Cre+ Axlf/f (n = 4) animals were challenged with 105MLL–ENL AML cells. At day 28, leukemic burden (% tomato+ CD11b+) in bone marrow, spleen, and peripheral blood is depicted. ***, P < 0.001, unpaired two-tailed Student t test. I, Kaplan–Meier survival analysis of control Axlf/f and Csf1r-Cre+ Axlf/f animals challenged with 105 MLL–ENL AML. These mice are also depicted in Fig. 4I. **, P < 0.01, log-rank (Mantel–Cox) test. J,Axlf/f (n = 8) and CD11c-Cre+ (CD11c-eGFP-Cre+ Axlf/f, n = 6) mice were challenged with 105MLL–ENL AML. On day 26, leukemic burden (% tomato+ CD11b+) in bone marrow, spleen, and peripheral blood is depicted. ns, not significant, unpaired two-tailed Student t test.
Figure 3. Axl-deficient macrophages prevent the establishment of an immune suppressive environment in response to leukemia. A, Nonleukemic (GFP−) spleen leukocytes were FACS purified from control Axlf/f mice and Csf1r-Cre+ Axlf/f mice that were either naïve (Axlf/f n = 2; Csf1r-Cre+ Axlf/f n = 2) or challenged with 103 B-ALL cells (n = 2 Axlf/f + B-ALL; n = 2 Csf1r-Cre+ Axlf/f+ B-ALL) for 8 days and subjected to 10X Genomics scRNA-seq. Data clustering, UMAP visualization of 36,000 individual cells (pooled from all conditions) followed by marker-based cell type annotation identified 10 broad immune subsets across all profiled single cells. B, Dot plot of selected cluster-specific marker genes. C, Relative abundance of identified cell types across conditions. D, Volcano plots showing the DEG (Padj < 0.01 and fold change >1.5) in macrophages comparing Axlf/f and Csf1r-Cre+ Axlf/f under steady-state conditions (left) and upon leukemia challenge (right), with the significant genes (max 10) annotated. E, Real-time PCR expression data in F4/80+ spleen macrophages purified using magnetic beads from naïve WT mice (n = 4) and mice transplanted with 103 B-ALL (WT n = 4; Csf1r-Cre+ Axlf/f n = 4). Data are normalized to a reference gene, Ubc, and are mean ± SEM. *, P <0.05, unpaired two-tailed Student t test. F, Real-time PCR expression data in dendritic cells (DC) isolated by flow cytometry as CD45+GFP−MHC-II+CD11c+ from the spleen of B-ALL challenged Axlf/f (n = 4) and Csf1r-Cre+ Axlf/f mice (n = 3). Data are normalized to a reference gene, Sdha, and are mean ± SEM. *, P < 0.05; ****, P < 0.0001, unpaired two-tailed Student t test. G, Representative gating and flow cytometry based quantification of total classical dendritic cells (DCs: CD45+GFP−MHC-II+CD11c+) as well as subsets: cDC1 (CD8+DCs: MHC-II+CD11c+CD8+CD11b−) and cDC2 (CD11b+DCs: MHC-II+CD11c+CD8−CD11b+) within nonleukemic splenocytes (GFP−CD45+) from B-ALL challenged Axlf/f (n = 6) and Csf1r-Cre+ Axlf/f (n = 4) mice. ns, not significant; ***, P < 0.001, unpaired two-tailed Student t test.
Figure 3.
Axl-deficient macrophages prevent the establishment of an immune suppressive environment in response to leukemia. A, Nonleukemic (GFP) spleen leukocytes were FACS purified from control Axlf/f mice and Csf1r-Cre+ Axlf/f mice that were either naïve (Axlf/f n = 2; Csf1r-Cre+ Axlf/f n = 2) or challenged with 103 B-ALL cells (n = 2 Axlf/f + B-ALL; n = 2 Csf1r-Cre+ Axlf/f+ B-ALL) for 8 days and subjected to 10X Genomics scRNA-seq. Data clustering, UMAP visualization of 36,000 individual cells (pooled from all conditions) followed by marker-based cell type annotation identified 10 broad immune subsets across all profiled single cells. B, Dot plot of selected cluster-specific marker genes. C, Relative abundance of identified cell types across conditions. D, Volcano plots showing the DEG (Padj < 0.01 and fold change >1.5) in macrophages comparing Axlf/f and Csf1r-Cre+ Axlf/f under steady-state conditions (left) and upon leukemia challenge (right), with the significant genes (max 10) annotated. E, Real-time PCR expression data in F4/80+ spleen macrophages purified using magnetic beads from naïve WT mice (n = 4) and mice transplanted with 103 B-ALL (WT n = 4; Csf1r-Cre+ Axlf/f n = 4). Data are normalized to a reference gene, Ubc, and are mean ± SEM. *, P <0.05, unpaired two-tailed Student t test. F, Real-time PCR expression data in dendritic cells (DC) isolated by flow cytometry as CD45+GFPMHC-II+CD11c+ from the spleen of B-ALL challenged Axlf/f (n = 4) and Csf1r-Cre+ Axlf/f mice (n = 3). Data are normalized to a reference gene, Sdha, and are mean ± SEM. *, P < 0.05; ****, P < 0.0001, unpaired two-tailed Student t test. G, Representative gating and flow cytometry based quantification of total classical dendritic cells (DCs: CD45+GFPMHC-II+CD11c+) as well as subsets: cDC1 (CD8+DCs: MHC-II+CD11c+CD8+CD11b) and cDC2 (CD11b+DCs: MHC-II+CD11c+CD8CD11b+) within nonleukemic splenocytes (GFPCD45+) from B-ALL challenged Axlf/f (n = 6) and Csf1r-Cre+ Axlf/f (n = 4) mice. ns, not significant; ***, P < 0.001, unpaired two-tailed Student t test.
Figure 4. Axl-deficient macrophages trigger a robust NK-cell and T-cell immune response that suppresses leukemia. A and B, Axlf/f and Csf1r-Cre+ Axlf/f mice were challenged with 103 B-ALL cells and treated with either an anti-NK1.1 antibody or a mouse IgG2a isotype control (50 μg/mouse) every 5 days as indicated. Leukemic burden (% GFP+) in the bone marrow and spleen on day 14 is depicted (B). ns, not significant. ***, P < 0.001, unpaired two-tailed Student t test. C, Kaplan–Meier survival analysis of mice of the indicated genotypes challenged with 103 B-ALL cells and treated as in A. Treatments stopped once all anti-NK1.1–treated mice were dead. ns, not significant. **, P < 0.01, log-rank (Mantel–Cox) test. D and E, Same as in A and B using 105 MLL–ENL AML cells. Leukemic burden (% Tomato+) on day 25 is depicted. ns, not significant. **, P < 0.01; ***, P < 0.001, unpaired two-tailed Student t test. F, Kaplan–Meier survival analysis of mice of the indicated genotypes challenged with 105 MLL–ENL AML cells and treated as in D. Treatments stopped once all anti-NK1.1–treated mice were dead. ns, not significant. **, P < 0.01; ***, P < 0.001, log-rank (Mantel–Cox) test. G, Kaplan-Meier survival analysis of mice of the indicated genotypes challenged with 103 B-ALL cells. Data are pooled from two independent experiments as indicated in the scheme. **, P < 0.01; ***, P < 0.001; ****, P < 0.0001, log-rank (Mantel–Cox) test. H, Leukemic burden (% GFP+) in all terminally ill animals that could be analyzed from G. Note that burden from animals found dead cannot be depicted. ns, not significant. *, P < 0.05; **, P < 0.01, unpaired two-tailed Student t test. I, Kaplan–Meier survival curve of mice of the indicated genotypes challenged with 105 MLL–ENL cells. Survival of the reference groups (Axlf/f and Csf1r-Cre+ Axlf/f) is also depicted in Fig. 2I. ns, not significant. **, P < 0.01; ***, P < 0.001, log-rank (Mantel–Cox) test. J, Leukemic burden (% tomato+) in all terminally ill animals that could be analyzed from I. Note that burden from animals found dead cannot be depicted. ns, not significant, unpaired two-tailed Student t test.
Figure 4.
Axl-deficient macrophages trigger a robust NK-cell and T-cell immune response that suppresses leukemia. A and B,Axlf/f and Csf1r-Cre+ Axlf/f mice were challenged with 103 B-ALL cells and treated with either an anti-NK1.1 antibody or a mouse IgG2a isotype control (50 μg/mouse) every 5 days as indicated. Leukemic burden (% GFP+) in the bone marrow and spleen on day 14 is depicted (B). ns, not significant. ***, P < 0.001, unpaired two-tailed Student t test. C, Kaplan–Meier survival analysis of mice of the indicated genotypes challenged with 103 B-ALL cells and treated as in A. Treatments stopped once all anti-NK1.1–treated mice were dead. ns, not significant. **, P < 0.01, log-rank (Mantel–Cox) test. D and E, Same as in A and B using 105MLL–ENL AML cells. Leukemic burden (% Tomato+) on day 25 is depicted. ns, not significant. **, P < 0.01; ***, P < 0.001, unpaired two-tailed Student t test. F, Kaplan–Meier survival analysis of mice of the indicated genotypes challenged with 105MLL–ENL AML cells and treated as in D. Treatments stopped once all anti-NK1.1–treated mice were dead. ns, not significant. **, P < 0.01; ***, P < 0.001, log-rank (Mantel–Cox) test. G, Kaplan-Meier survival analysis of mice of the indicated genotypes challenged with 103 B-ALL cells. Data are pooled from two independent experiments as indicated in the scheme. **, P < 0.01; ***, P < 0.001; ****, P < 0.0001, log-rank (Mantel–Cox) test. H, Leukemic burden (% GFP+) in all terminally ill animals that could be analyzed from G. Note that burden from animals found dead cannot be depicted. ns, not significant. *, P < 0.05; **, P < 0.01, unpaired two-tailed Student t test. I, Kaplan–Meier survival curve of mice of the indicated genotypes challenged with 105 MLL–ENL cells. Survival of the reference groups (Axlf/f and Csf1r-Cre+ Axlf/f) is also depicted in Fig. 2I. ns, not significant. **, P < 0.01; ***, P < 0.001, log-rank (Mantel–Cox) test. J, Leukemic burden (% tomato+) in all terminally ill animals that could be analyzed from I. Note that burden from animals found dead cannot be depicted. ns, not significant, unpaired two-tailed Student t test.
Figure 5. Axl deficient macrophages trigger antileukemic immunity and elicit PD-1 checkpoint blockade. A, Kaplan–Meier survival analysis of WT mice challenged with 103 B-ALL cells and treated with either anti–PD-1 (n = 8) or isotype control (n = 7). B, GFP+ blasts (left) and PD-1+ cells (right) by IHC in the spleen of Csf1r-Cre+ Axlf/f mice that succumbed to B-ALL with a delayed latency of >40 days (Mice depicted in Fig. 2C). C and D, Csf1r-Cre+ Axlf/f from three independent experiments were followed by weekly bleeding to identify mice with late disease recurrence (n = 7). Flow cytometry data depicting PD-1 expression in peripheral blood lymphocytes (CD4 and CD8 T cells, NK cells) and corresponding PD-1 mean fluorescence intensity (MFI) from Csf1r-Cre+ Axlf/f mice showing signs of relapse (detectable GFP+ cells, representative data in G). ****, P < 0.0001, unpaired two-tailed Student t test. E, PD-1 ligand (PD-L1) expression by IHC in bone marrow cells with both stromal and hematopoietic morphology (left), as well as on cytospined B-ALL cells (right). F and G, Csf1r-Cre+ Axlf/f mice with late disease recurrence (n = 7, depicted in C and D) were either left untreated (n = 3) or subjected to 7 cycles of anti–PD-1 treatment (n = 4; 200 μg/mouse every 4 days). Representative FACS plot depicting leukemic burden (GFP+ B220dim) in the peripheral blood of the same mouse before and after one shot of anti–PD-1 treatment. H, Kaplan–Meier survival analysis of mice from F. *, P < 0.05, log-rank (Mantel–Cox) test.
Figure 5.
Axl deficient macrophages trigger antileukemic immunity and elicit PD-1 checkpoint blockade. A, Kaplan–Meier survival analysis of WT mice challenged with 103 B-ALL cells and treated with either anti–PD-1 (n = 8) or isotype control (n = 7). B, GFP+ blasts (left) and PD-1+ cells (right) by IHC in the spleen of Csf1r-Cre+ Axlf/f mice that succumbed to B-ALL with a delayed latency of >40 days (Mice depicted in Fig. 2C). C and D,Csf1r-Cre+ Axlf/f from three independent experiments were followed by weekly bleeding to identify mice with late disease recurrence (n = 7). Flow cytometry data depicting PD-1 expression in peripheral blood lymphocytes (CD4 and CD8 T cells, NK cells) and corresponding PD-1 mean fluorescence intensity (MFI) from Csf1r-Cre+ Axlf/f mice showing signs of relapse (detectable GFP+ cells, representative data in G). ****, P < 0.0001, unpaired two-tailed Student t test. E, PD-1 ligand (PD-L1) expression by IHC in bone marrow cells with both stromal and hematopoietic morphology (left), as well as on cytospined B-ALL cells (right). F and G,Csf1r-Cre+ Axlf/f mice with late disease recurrence (n = 7, depicted in C and D) were either left untreated (n = 3) or subjected to 7 cycles of anti–PD-1 treatment (n = 4; 200 μg/mouse every 4 days). Representative FACS plot depicting leukemic burden (GFP+ B220dim) in the peripheral blood of the same mouse before and after one shot of anti–PD-1 treatment. H, Kaplan–Meier survival analysis of mice from F. *, P < 0.05, log-rank (Mantel–Cox) test.
Figure 6. Bemcentinib, a clinical-grade AXL inhibitor, triggers effective antileukemic immunity in B-ALL that depends on IL12, TNFα, and engagement of CD8 T cells. A, Representative phospho-AXL (white) expression and IBA1+ leukemia-associated macrophages (red) by immune fluorescence in frozen bone sections from vehicle and bemcentinib-treated leukemia-bearing mice depicted in B, at final analysis. B, Leukemic burden (% GFP+ B220dim in bone marrow, spleen, and peripheral blood) and spleen pictures of WT mice challenged with 103 B-ALL cells and treated twice daily with either vehicle or bemcentinib at 50 mg/kg. Treatment was initiated on day 4 post–leukemia injection and mice were analyzed on day 11. *, P < 0.05; **, P < 0.01, two-tailed Student t test. C, Same as B, using CD8-deficient mice. ns, not significant, two-tailed Student t test. D, Day 10 leukemic burden (% GFP+ B220dim in peripheral blood) in WT mice challenged with 103 B-ALL cells treated as in B, in the presence or absence of blocking antibodies against IL12 (300 μg/mouse) and TNFα (400 μg/mouse). Blocking antibodies for IL12 and TNFα were administered daily starting from day 4 post–leukemia challenge. Each dot represents an individual mouse and mean value is depicted. ns, not significant, *, P < 0.05, unpaired two-tailed Student t test.
Figure 6.
Bemcentinib, a clinical-grade AXL inhibitor, triggers effective antileukemic immunity in B-ALL that depends on IL12, TNFα, and engagement of CD8 T cells. A, Representative phospho-AXL (white) expression and IBA1+ leukemia-associated macrophages (red) by immune fluorescence in frozen bone sections from vehicle and bemcentinib-treated leukemia-bearing mice depicted in B, at final analysis. B, Leukemic burden (% GFP+ B220dim in bone marrow, spleen, and peripheral blood) and spleen pictures of WT mice challenged with 103 B-ALL cells and treated twice daily with either vehicle or bemcentinib at 50 mg/kg. Treatment was initiated on day 4 post–leukemia injection and mice were analyzed on day 11. *, P < 0.05; **, P < 0.01, two-tailed Student t test. C, Same as B, using CD8-deficient mice. ns, not significant, two-tailed Student t test. D, Day 10 leukemic burden (% GFP+ B220dim in peripheral blood) in WT mice challenged with 103 B-ALL cells treated as in B, in the presence or absence of blocking antibodies against IL12 (300 μg/mouse) and TNFα (400 μg/mouse). Blocking antibodies for IL12 and TNFα were administered daily starting from day 4 post–leukemia challenge. Each dot represents an individual mouse and mean value is depicted. ns, not significant, *, P < 0.05, unpaired two-tailed Student t test.
Figure 7. Systemic AXL inhibition induces potent antileukemic immunity and eliminates leukemic blasts in AXL-negative leukemias. A and B, Kaplan–Meier survival curves of C57BL/6 WT mice (A) or NSG mice (B) challenged with 5.105 Asxl1−/− AML cells and treated with either vehicle or bemcentinib (50 mg/kg, twice daily). ns, not significant. ***, P < 0.001, log-rank (Mantel–Cox) test. C, Kaplan–Meier survival analysis of C57BL/6 WT mice challenged with 103 B-ALL cells and treated with either vehicle (n = 7) or nilotinib (80 mg/kg, once a day) plus bemcentinib (50 mg/kg, twice daily; n = 33) for a total of 44 days. Data are pooled from two independent experiments. ***, P < 0.001, log-rank (Mantel–Cox) test. D, Representative FACS plots depicting absence of GFP+ B220dim leukemic cells in the bone marrow of long-term survivors from C. E, Mice from C were followed by weekly bleeding. Three of 33 mice (#24, #26, and #31) showed GFP+ cells indicative of disease recurrence and were subjected to anti–PD-1 treatment as indicated (7 × 200 μg/mL every fourth day). Mouse #31 succumbed to full-blown leukemia on day 36, while #24 and #26 remained leukemia-free. F, Kaplan–Meier survival analysis of NSG mice challenged with 103 B-ALL cells and treated with either vehicle, nilotinib, or nilotinib plus bemcentinib for a total of 44 days as in C. ns, not significant, log-rank (Mantel–Cox) test. G, WT mice were injected with 103 TKIR B-ALL cells. After 5 days, mice were randomly attributed to the indicated vehicle or treatment groups and their survival depicted using a Kaplan–Meier analysis. Data are pooled from two independent experiments. ns, not significant, **, P < 0.01; ****, P < 0.0001, log-rank (Mantel–Cox) test. H, Representative FACS plots depicting absence of GFP+ B220dim leukemic cells in the bone marrow of bemcentinib + vincristine–treated long-term survivors from G. In all experiments, treatments were initiated and stopped on the days indicated by dotted lines.
Figure 7.
Systemic AXL inhibition induces potent antileukemic immunity and eliminates leukemic blasts in AXL-negative leukemias. A and B, Kaplan–Meier survival curves of C57BL/6 WT mice (A) or NSG mice (B) challenged with 5.105Asxl1−/− AML cells and treated with either vehicle or bemcentinib (50 mg/kg, twice daily). ns, not significant. ***, P < 0.001, log-rank (Mantel–Cox) test. C, Kaplan–Meier survival analysis of C57BL/6 WT mice challenged with 103 B-ALL cells and treated with either vehicle (n = 7) or nilotinib (80 mg/kg, once a day) plus bemcentinib (50 mg/kg, twice daily; n = 33) for a total of 44 days. Data are pooled from two independent experiments. ***, P < 0.001, log-rank (Mantel–Cox) test. D, Representative FACS plots depicting absence of GFP+ B220dim leukemic cells in the bone marrow of long-term survivors from C. E, Mice from C were followed by weekly bleeding. Three of 33 mice (#24, #26, and #31) showed GFP+ cells indicative of disease recurrence and were subjected to anti–PD-1 treatment as indicated (7 × 200 μg/mL every fourth day). Mouse #31 succumbed to full-blown leukemia on day 36, while #24 and #26 remained leukemia-free. F, Kaplan–Meier survival analysis of NSG mice challenged with 103 B-ALL cells and treated with either vehicle, nilotinib, or nilotinib plus bemcentinib for a total of 44 days as in C. ns, not significant, log-rank (Mantel–Cox) test. G, WT mice were injected with 103 TKIR B-ALL cells. After 5 days, mice were randomly attributed to the indicated vehicle or treatment groups and their survival depicted using a Kaplan–Meier analysis. Data are pooled from two independent experiments. ns, not significant, **, P < 0.01; ****, P < 0.0001, log-rank (Mantel–Cox) test. H, Representative FACS plots depicting absence of GFP+ B220dim leukemic cells in the bone marrow of bemcentinib + vincristine–treated long-term survivors from G. In all experiments, treatments were initiated and stopped on the days indicated by dotted lines.

Comment in

  • doi: 10.1158/2159-8290.CD-11-11-ITI

References

    1. Bassan R, Bourquin JP, DeAngelo DJ, Chiaretti S. New approaches to the management of adult acute lymphoblastic leukemia. J Clin Oncol 2018:JCO2017773648. - PubMed
    1. Dohner H, Weisdorf DJ, Bloomfield CD. Acute myeloid leukemia. N Engl J Med 2015;373:1136–52. - PubMed
    1. Witkowski MT, Lasry A, Carroll WL, Aifantis I. Immune-based therapies in acute leukemia. Trends Cancer 2019;5:604–18. - PMC - PubMed
    1. Christopher MJ, Petti AA, Rettig MP, Miller CA, Chendamarai E, Duncavage EJet al. . Immune escape of relapsed AML cells after allogeneic transplantation. N Engl J Med 2018;379:2330–41. - PMC - PubMed
    1. Toffalori C, Zito L, Gambacorta V, Riba M, Oliveira G, Bucci Get al. . Immune signature drives leukemia escape and relapse after hematopoietic cell transplantation. Nat Med 2019;25:603–11. - PubMed

Publication types