. 2021 Nov;11(11):2846-2867.
doi: 10.1158/2159-8290.CD-21-0145. Epub 2021 Jun 8.

Enhancer Hijacking Drives Oncogenic BCL11B Expression in Lineage-Ambiguous Stem Cell Leukemia

Affiliations

Enhancer Hijacking Drives Oncogenic BCL11B Expression in Lineage-Ambiguous Stem Cell Leukemia

Lindsey E Montefiori et al. Cancer Discov. 2021 Nov.

Abstract

Lineage-ambiguous leukemias are high-risk malignancies of poorly understood genetic basis. Here, we describe a distinct subgroup of acute leukemia with expression of myeloid, T lymphoid, and stem cell markers driven by aberrant allele-specific deregulation of BCL11B, a master transcription factor responsible for thymic T-lineage commitment and specification. Mechanistically, this deregulation was driven by chromosomal rearrangements that juxtapose BCL11B to superenhancers active in hematopoietic progenitors, or focal amplifications that generate a superenhancer from a noncoding element distal to BCL11B. Chromatin conformation analyses demonstrated long-range interactions of rearranged enhancers with the expressed BCL11B allele and association of BCL11B with activated hematopoietic progenitor cell cis-regulatory elements, suggesting BCL11B is aberrantly co-opted into a gene regulatory network that drives transformation by maintaining a progenitor state. These data support a role for ectopic BCL11B expression in primitive hematopoietic cells mediated by enhancer hijacking as an oncogenic driver of human lineage-ambiguous leukemia. SIGNIFICANCE: Lineage-ambiguous leukemias pose significant diagnostic and therapeutic challenges due to a poorly understood molecular and cellular basis. We identify oncogenic deregulation of BCL11B driven by diverse structural alterations, including de novo superenhancer generation, as the driving feature of a subset of lineage-ambiguous leukemias that transcend current diagnostic boundaries.This article is highlighted in the In This Issue feature, p. 2659.


Figures

Fig 1.
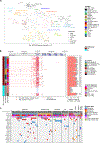
Fig 1.. A new subtype of leukemia defined by a distinct gene expression profile and allele-specific BCL11B expression.
(A) tSNE projection analysis of 1,114 leukemia transcriptomes (excluding B-ALL and MPAL cases clustered with B-ALL). Samples are colored by driver genomic alterations and shaped corresponding to original diagnosis. The top 1000 most variable genes (based on absolute median deviation) were used in the tSNE analysis with the perplexity of 20. Samples belonging to the BCL11B group are circled. (B) Allele-specific expression (ASE) analysis of the BCL11B group samples and representative T-ALL samples. Each row represents a primary leukemia sample with available matched WGS and RNA-seq required to discern allele frequencies at heterozygous SNPs (see Methods and Supplementary Table 5). Red dots indicate positions of significant allelic imbalance in the RNA-seq data and dashed red lines indicate continuous runs such SNPs. Right panel shows the absolute mean difference between variant allele frequencies (VAF) in RNA-seq vs. WGS data. Significant detection of BCL11B ASE is indicated with asterisks. (C) Oncoprint of the BCL11B group showing the most recurrently mutated genes. Normalized FLT3 expression levels (variance stabilizing transformation) are shown above. Samples are grouped according to the BCL11B SV rearrangement partner.
Fig 2.
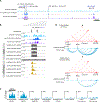
Fig 2.. BCL11B SVs occur near cbCD34+ HSPC super enhancers.
(A) BCL11B breakpoint positions on chromosome 14, grouped by rearrangement partner. Below, zoomed in on the BCL11B gene to show breakpoints occur up- or down-stream of BCL11B. (B) Super-enhancer analysis of H3K27ac ChIP-seq data from cbCD34+ cells (34). Loci harboring BCL11B rearrangements are shown in red. Horizontal line indicates enrichment cutoff, vertical line indicates super-enhancer cut-off. (C) Genome browser tracks of BCL11B rearrangement partner loci. Breakpoint positions are indicated with black tick marks along with super-enhancer calls (red bars) from cbCD34+ data (light blue track). H3K27ac ChIP-seq coverage tracks are also shown for purified human thymocytes (CD34+CD1a− and double positive (DP) CD3− progenitors) (27). Red highlighted area corresponds to predicted hijacked HSPC enhancers. Grey bar highlights the N-Me T cell progenitor-specific enhancer.
Fig 3.
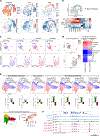
Fig 3.. BCL11B rearrangements rewire existing CD34+ HSPC super-enhancers.
(A-C) H3K27ac HiChIP in human cbCD34+ HSPCs (A), DND-41 (BCL11B-TLX3) T-ALL cells (B) and Jurkat (TAL1 deregulated) T-ALL cells (C). Raw interaction maps are displayed as a heatmap and HiChIP coverage tracks are shown below. Significant H3K27ac-anchored interactions (FDR <0.01) are shown as arcs. Dotted grey box indicates the position of the ThymoD enhancer, shaded grey box indicates the BCL11B gene, and black arrows point to the region of the heatmap corresponding to ThymoD-BCL11B interactions. (D-F) Each panel shows H3K27ac HiChIP data from a different patient sample, with comparison to the same genomic region in healthy normal cbCD34+ HSPCs. Raw interaction maps are displayed at 5 kb resolution and breakpoint positions are shown as orange arrowheads. HiChIP and RNA-seq coverage are shown below for both leukemia and cbCD34+ samples. Bottom panel shows interaction maps generated using patient-specific genomes containing the rearranged chromosome sequences. Purple bars indicate the chromosome 14 (BCL11B containing) derived region and gold bars indicate the SV partner-derived region. Insets show schematic representations of each rearrangement. (D) A patient sample harboring an ARID1B-BCL11B rearrangement. (E) Same as in (D), for a patient sample harboring a CCDC26/BENC-BCL11B rearrangement and (C) for a patient sample with a CDK6-BCL11B rearrangement. All coordinates are hg38.
Fig 4.
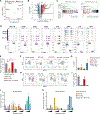
Fig 4.. Tandem amplification of a non-coding region generates a de novo super enhancer.
(A) Genome browser snapshot showing the BCL11B locus and ~1Mb downstream gene desert. The positions of the T cell enhancer, ThymoD, and the de novo amplified genomic region found in 20% of cases (BETA) are highlighted in grey. H3K27ac ChIP-seq coverage tracks are shown for cbCD34+ HSPCs as well as thymic CD34+CD1a− progenitors and committed DP CD3- thymocytes (27). (B) Genomic region centered on BETA. WGS and RNA-seq coverage are shown for 4 representative BETA cases along with a non-BETA case (SJALL068279, ARID1B-BCL11B) for comparison. (C) H3K27ac HiChIP coverage centered on BETA in all cell types analyzed. (D) H3K27ac HiChIP data in 2 BETA cases. Heatmaps show the raw pair-wise interaction frequencies and significant chromatin interactions are shown as arcs. Black arrows point to the location of ThymoD-BCL11B chromatin interactions and red arrows point to the BETA-BCL11B interaction. Coordinates shown are chr14:98051180–99367553 (hg38).
Fig 5.
Fig 5.. BCL11B binding correlates with an HSPC gene expression signature in BCL11B-deregulated leukemia.
(A-B) CIBERSORT deconvolution of 2467 leukemia transcriptomes with signatures from purified HSPC and mature populations. (A) Patient samples are colored based on their diagnosis and enrichment for each gene expression signature. (B) BCL11B group leukemia samples were projected onto the HSPC 2D UMAP showing that they cluster with the hematopoietic stem cell (HSC)/lymphoid-myeloid primed progenitor (LMPP) populations (top) and the summary of enrichment z-scores for all leukemia-normal comparisons is shown below. (C) Combined single cell ATAC-seq/RNA-seq on two BCL11B group samples. UMAP clustering was performed after combining both modalities. Cells are colored based on their enrichment for each normal hematopoietic open chromatin signature (using the scATAC-seq data). See Supplementary Fig. 21 for all signatures analyzed. (D) BCL11B expression from each sample is plotted in the respective UMAP (left) and the correlation of BCL11B expression with each normal hematopoietic signature is shown at right. Heatmap shows the Spearman’s correlation z-score. (E) Three HSPC-spanning chromatin accessibility signatures representing normal hematopoietic cells identified in Takayama et al. (47) are shown at the bottom. Columns in the heatmap correspond to six HSPC cell populations reflected by these signature groupings (rows), ranked from lowest (white) to highest (red) values. (top) UMAP 2D projection of normal HSPC populations colored based on their enrichment for BCL11B ChIP-seq peaks in the indicated sample, with barplots showing the correlation between the single-cell enrichment of BCL11B ChIP-Seq peaks and the three HSPC-spanning chromatin accessibility signatures. (F) BCL11B occupancy at the GATA2 locus in normal thymocytes, DND-41 cells, and four BCL11B-group leukemia samples. Shaded areas highlight regions of BCL11B occupancy specifically in the BCL11B group samples. Coordinates are hg38. HSC, hematopoietic stem cell; MPP, multipotent progenitor; CMP, common myeloid progenitor; LMPP, lymphoid-primed multipotent progenitor; MLP, multi-lymphoid progenitor; GMP, granulocyte-macrophage progenitor; B, B-cell (CD19+); T, T-cell (CD3+); Gr, Granulocyte; Mono, monocyte.
Fig 6.
Fig 6.. BCL11B and FLT3-ITD overexpression of in human and mouse HSPCs.
(A) Principle components analysis of RNA-seq data from 3 biological replicates of BCL11B- or empty vector-transduced cbCD34+ HSPCs using the top 3000 most variable genes. (B) Volcano plot showing genes up- (red) or down-regulated (blue) in BCL11B-overexpressing cells compared to control. Vertical lines indicate the fold change cutoff of 2; horizontal line indicates the FDR cutoff of 0.05. (C) GSEA of BCL11B-transduced versus empty vector control cbCD34+ HSPCs. Genes upregulated following BCL11B overexpression are positively enriched for T cell differentiation genes, whereas genes downregulated are negatively enriched for genes related to myeloid differentiation (a full list of GSEA results can be found in Supplementary Table 15). (D) Upper panel: coverage tracks of RNA-seq reads at selected genes (CD3D, CD3E, CD3G, IL7R are T-lineage genes upregulated following BCL11B overexpression; MPO, LYZ, SPI1 are myeloid lineage genes downregulated following BCL11B overexpression). Lower panel: boxplots displaying TPM values for each replicate. Box shows the first and third quartiles; whiskers show data range. (E) Results from colony forming assays in GFP+/mCherry+ sorted human cbCD34+ cells. Total number of colonies across 3 technical replicates per condition (1,500 cells plated per dish) is shown. Data are representative of 3 biological replicates. ***p < 0.001 (one-way ANOVA with all samples compared to the empty vector control). (F-I) Flow cytometry analysis of transduced cbCD34+ cells grown for 7 days in lymphoid differentiation media (F,G) or myeloid differentiation media (H,I). Cells shown were gated on CD45+ singlets. (J,K) Analysis of serial replating of GFP+/mCherry+ sorted mouse lineage-negative HSPCs. (J) Total number of colonies across 3 technical replicates per condition (5,000 cells plated per dish per round) is shown. *p < 0.05, **p < 0.01, ***p < 0.001, ****p < 0.0001, n.s., not significant (one-way ANOVA with all samples compared to the empty vector control). (K) Total number of cells generated in each round.

References

    1. Khan M, Siddiqi R, Naqvi K. An update on classification, genetics, and clinical approach to mixed phenotype acute leukemia (MPAL). Ann Hematol 2018;97(6):945–53. - PubMed
    1. Charles NJ, Boyer DF. Mixed-Phenotype Acute Leukemia: Diagnostic Criteria and Pitfalls. Archives of pathology & laboratory medicine 2017;141(11):1462–8. - PubMed
    1. Coustan-Smith E, Mullighan CG, Onciu M, Behm FG, Raimondi SC, Pei D, et al. Early T-cell precursor leukaemia: a subtype of very high-risk acute lymphoblastic leukaemia. Lancet Oncol 2009;10(2):147–56. - PMC - PubMed
    1. Zhang J, Ding L, Holmfeldt L, Wu G, Heatley SL, Payne-Turner D, et al. The genetic basis of early T-cell precursor acute lymphoblastic leukaemia. Nature 2012;481(7380):157–63. - PMC - PubMed
    1. Alexander TB, Gu Z, Iacobucci I, Dickerson K, Choi JK, Xu B, et al. The genetic basis and cell of origin of mixed phenotype acute leukaemia. Nature 2018;562(7727):373–9. - PMC - PubMed

Publication types

MeSH terms