. 2021 Jun 15;118(24):e2024624118.
doi: 10.1073/pnas.2024624118.

The dynamic epigenetic regulation of the inactive X chromosome in healthy human B cells is dysregulated in lupus patients

Affiliations

The dynamic epigenetic regulation of the inactive X chromosome in healthy human B cells is dysregulated in lupus patients

Sarah Pyfrom et al. Proc Natl Acad Sci U S A. .

Abstract

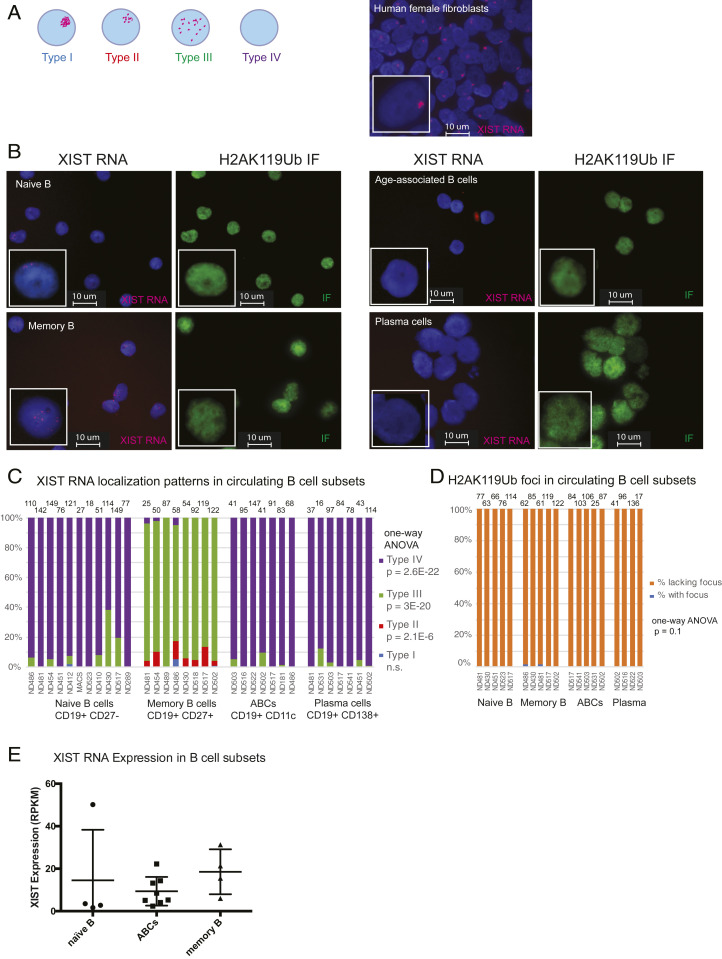
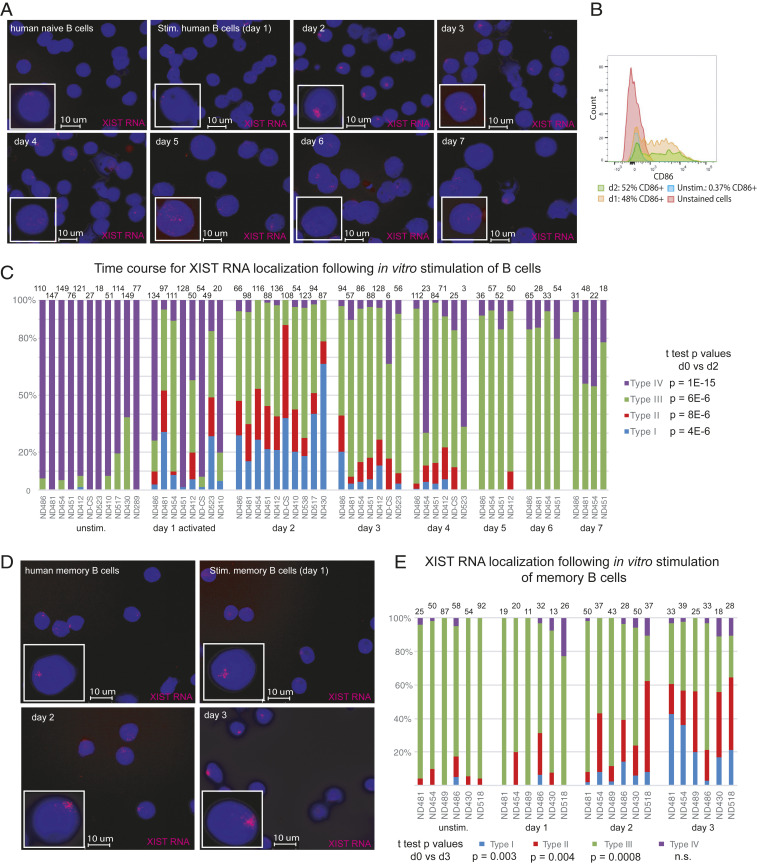
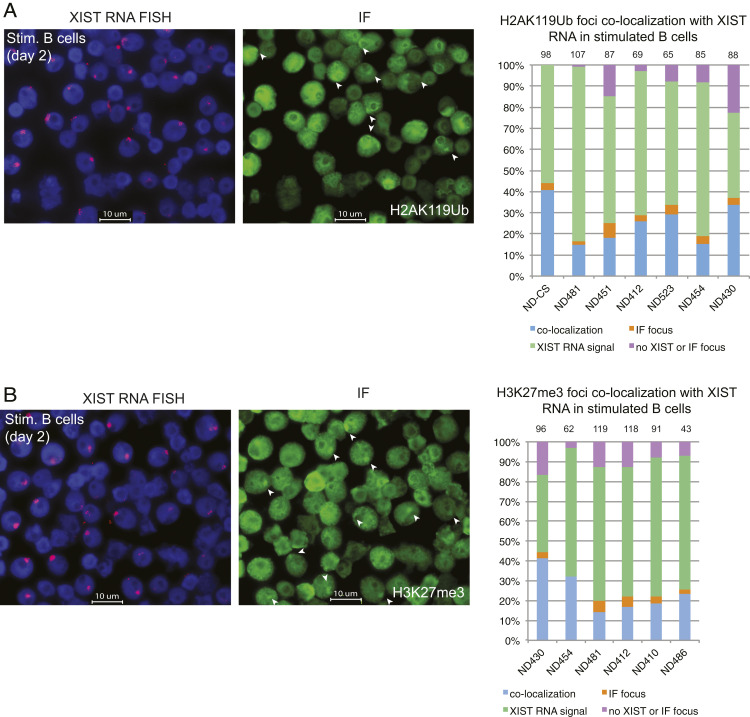
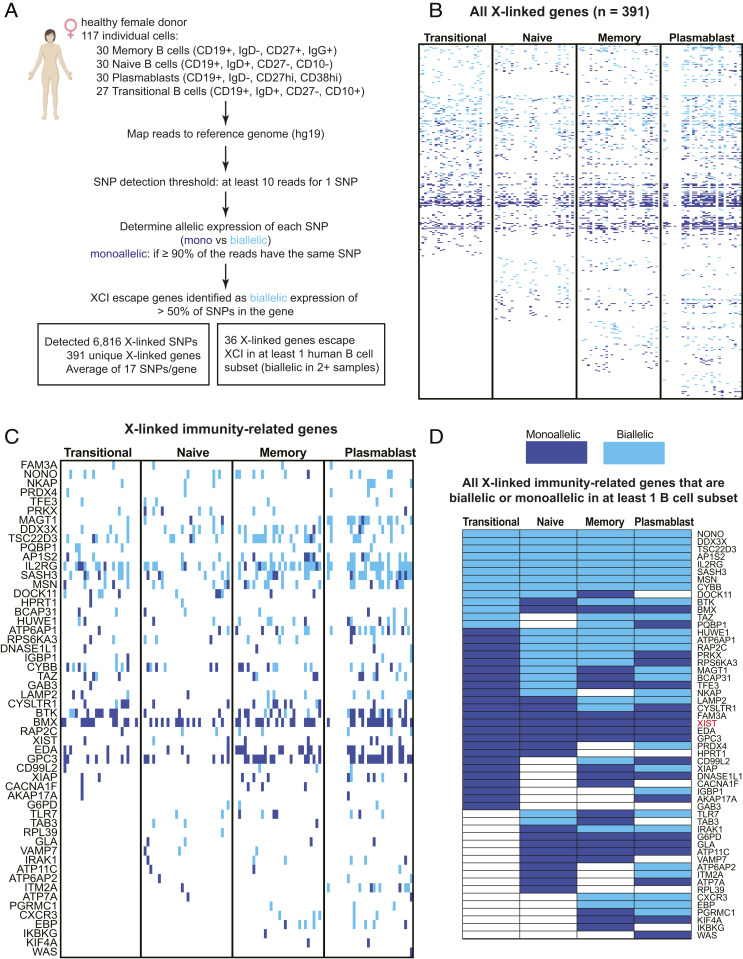
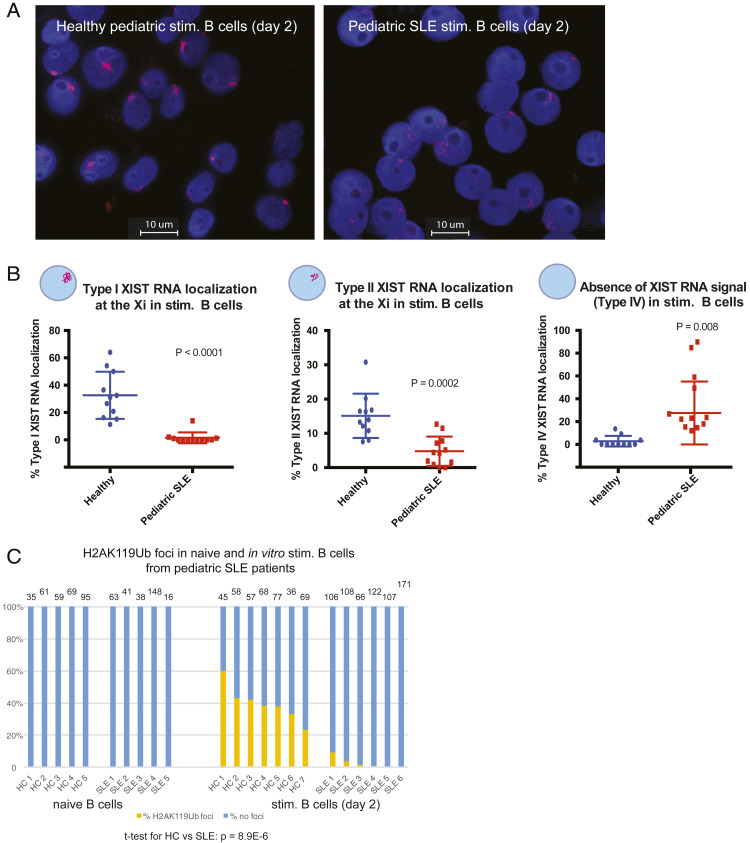
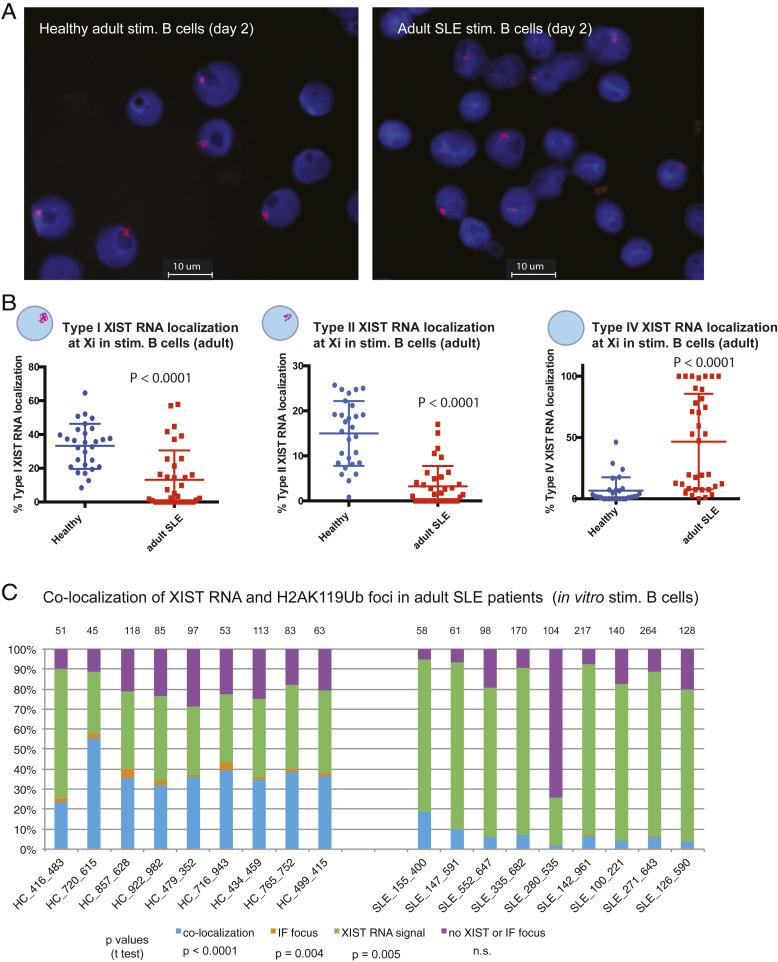
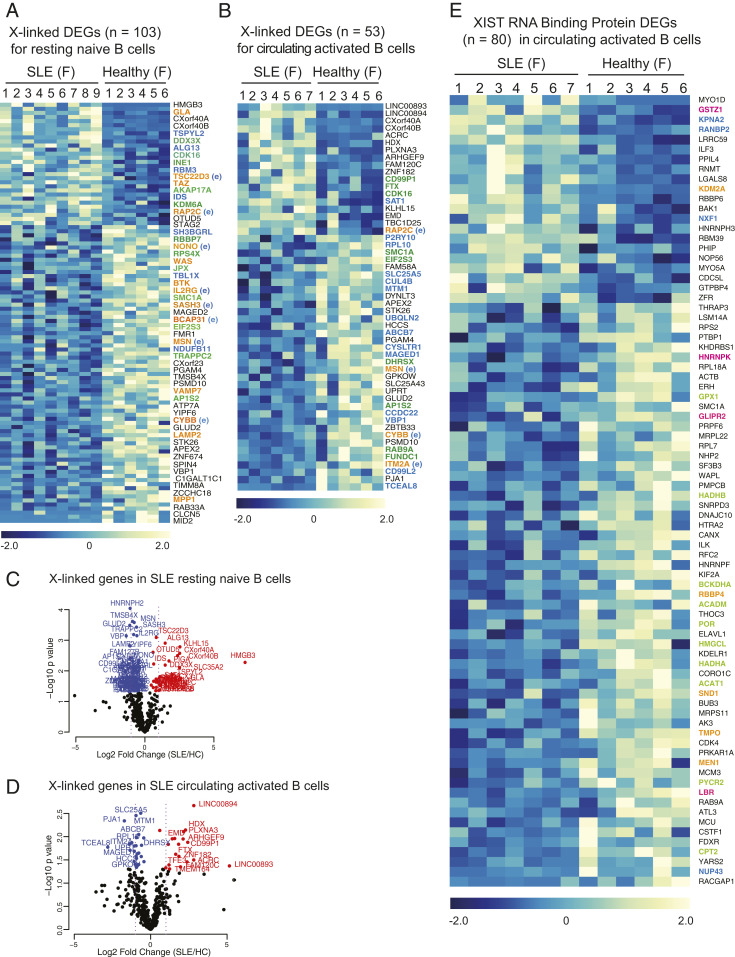
Systemic lupus erythematous (SLE) is a female-predominant disease characterized by autoimmune B cells and pathogenic autoantibody production. Individuals with two or more X chromosomes are at increased risk for SLE, suggesting that X-linked genes contribute to the observed sex bias of this disease. To normalize X-linked gene expression between sexes, one X in female cells is randomly selected for transcriptional silencing through X-chromosome inactivation (XCI), resulting in allele-specific enrichment of epigenetic modifications, including histone methylation and the long noncoding RNA XIST/Xist on the inactive X (Xi). As we have previously shown that epigenetic regulation of the Xi in female lymphocytes from mice is unexpectedly dynamic, we used RNA fluorescence in situ hybridization and immunofluorescence to profile epigenetic features of the Xi at the single-cell level in human B cell subsets from pediatric and adult SLE patients and healthy controls. Our data reveal that abnormal XCI maintenance in B cells is a feature of SLE. Using single-cell and bulk-cell RNA sequencing datasets, we found that X-linked immunity genes escape XCI in specific healthy human B cell subsets and that human SLE B cells exhibit aberrant expression of X-linked genes and XIST RNA interactome genes. Our data reveal that mislocalized XIST RNA, coupled with a dramatic reduction in heterochromatic modifications at the Xi in SLE, predispose for aberrant X-linked gene expression from the Xi, thus defining a genetic and epigenetic pathway that affects X-linked gene expression in human SLE B cells and likely contributes to the female bias in SLE.

Keywords: X-chromosome inactivation; XIST RNA; human B cells; lupus; sex differences.


Conflict of interest statement

The authors declare no competing interest.

Figures

Fig. 1.
Fig. 1.
XIST RNA signals are missing from the Xi in human B cell populations. (A) Cartoon representing each type of XIST RNA localization pattern observed in human B cell subsets (Left). Representative XIST RNA FISH using primary human female fibroblasts (IMR-90). (B) Sequential XIST RNA FISH (red) then IF detection (green) for H2AK119-ubiquitin (Ub) for naïve B cells, memory B cells, ABCs, and plasma cells from healthy PBMCs. (C) Quantification of XIST RNA localization patterns from each B cell subset. Each column represents an individual donor. Number of nuclei counted is shown above each sample. Statistical significance for each XIST RNA localization pattern was determined using one-way ANOVA. (D) Quantification of H2AK119Ub foci in human B cell subsets. Each column represents an individual donor. (E) XIST RNA reads for naïve B, ABCs, and memory B cells from a previously published RNA-seq dataset (34).
Fig. 2.
Fig. 2.
Timing for XIST RNA localization to the Xi during human B cell stimulation for naïve and memory B cells. (A) Time course analysis for XIST RNA FISH to monitor XIST RNA localization changes after B cell stimulation using CpG, over 7 d. (B) CD86+ staining of in vitro activated B cells (day 1 and day 2) to measure efficiency of in vitro stimulation. (C) Quantification of XIST RNA localization patterns for in vitro stimulated B cells over 7 d in culture. The number of nuclei counted is shown above each column. Statistical significance was determined using unpaired t test comparing day 0 to day 2. (D) XIST RNA FISH for in vitro stimulated memory B cells using CpG, over 3 d. (E) Quantification of XIST RNA localization patterns for in vitro activated memory B cells over 3 d. Statistical significance determined using an unpaired t test comparing day 0 to day 3.
Fig. 3.
Fig. 3.
Colocalization of XIST RNA and heterochromatin marks H2AK119Ub and H3K27me for in vitro activated human B cells. Sequential XIST RNA FISH (red) followed by immunofluorescence detection (green) for (A) H2AK119Ub and (B) H3K27me3. Representative images (showing the same field) are shown. Quantification of colocalization patterns for XIST RNA and each heterochromatin mark at the Xi. Colocalization of XIST RNA (Types I and II) and IF focus (blue bars), XIST RNA signals alone (Type III; green), nuclei without either signal (purple), or IF focus (orange). Number of nuclei counted is above column.
Fig. 4.
Fig. 4.
Biallelic expression of X-linked genes in human B cell populations. (A) Schematic of the bioinformatics analysis pipeline to identify XCI escape genes in circulating memory B cells, naïve B cells, transitional B cells, and plasmablasts. (B) Heatmap for all X-linked genes with detectable expression across the four human B cell subsets. Each individual cell is a column. Light blue indicates biallelic expression (minor allele frequency ≥ 0.1 for > 50% of SNPs per gene), dark blue indicates monoallelic expression, and white is undetectable expression. Gene lists for individual SNPs in each cell (across B cell populations) in Dataset S1; complete list of all expressed X-linked genes in Dataset S2. Dataset S3 contains gene lists for each B cell subset. (C) Expression of X-linked immunity-related genes across all four B cell populations. Individual cells for a particular B cell subset shown in columns; monoallelic expression (dark blue); biallelic expression (light blue). (D) Allelic expression summary for the X-linked immunity-related genes, either monoallelic (dark blue) or biallelic (light blue) across human B cell subsets. A gene was called “biallelic” for a particular B cell subset if two or more cells within that group were biallelic. A gene was considered monoallelic for a B cell subset if two or more cells within that subset were monoallelic. Dataset S4 contains a complete list of X-linked immunity-related genes that were biallelically expressed in each B cell subset, along with allelic expression information.
Fig. 5.
Fig. 5.
Peripheral B cells from pediatric SLE patients have mislocalized XIST RNA patterns and lack H2AK119Ub foci at the Xi. (A) Representative XIST RNA FISH images from in vitro activated B cells (cultured 2 d) from one pediatric SLE patient (Right) and a healthy, age-matched control (Left). (B) Quantification of Type I (Left), Type II (Center), and Type IV (Right) XIST RNA localization patterns for in vitro activated B cells from pediatric SLE patients (red) and healthy controls (blue). Each data point represents an individual donor. Error bars denote mean ± SD, and statistical significance was determined using two-tailed unpaired t test. (C) Quantification of H2AK119Ub foci for in vitro activated B cells from pediatric SLE patients and healthy control samples. The number of nuclei counted is above each sample; statistical significance comparing SLE to healthy controls was determined using two-tailed unpaired t test. Note that some PBMC samples yielded too few B cells for a naïve B sample timepoint, and all purified cells were activated using CpG.
Fig. 6.
Fig. 6.
Peripheral B cells from adult SLE patients have mislocalized XIST RNA patterns and reduced H2AK119Ub foci at the Xi. (A) Representative XIST RNA FISH images from in vitro activated B cells (cultured 2 d) from one adult SLE patient (Right) and a healthy, age-matched control (Left). (B) Quantification of Type I (Left), Type II (Center), and Type IV (Right) XIST RNA localization patterns for in vitro activated B cells from adult SLE patients (red) and healthy controls (blue). Error bars denote mean ± SD, and statistical significance was determined using two-tailed unpaired t test. (C) Quantification of colocalization patterns for XIST RNA and H2AK119Ub at the Xi for in vitro activated B cells from adult SLE patients and healthy control samples. Colocalization of XIST RNA (Types I and II) and IF focus (blue bars), XIST RNA signals alone (Type III; green), nuclei without either signal (purple), or IF focus (orange). The number of nuclei counted is above each sample; statistical significance comparing SLE to healthy controls was determined using two-tailed unpaired t test.
Fig. 7.
Fig. 7.
X-linked gene expression and XIST RNA interactome genes are altered in SLE patient activated B cells. (A) X-linked DEGs (103 genes) in resting naïve B cells in circulation from SLE patients (nine female samples) and adult, healthy controls (six female samples). XCI escape genes are in color: orange are immunity-related genes that may escape in naïve B cells; green are known XCI escape genes in other somatic cells; and blue are putative XCI escape based on Dataset S3. The complete gene list is shown in Dataset S5. The color gradient represents row Z-scores for each gene. (B) X-linked DEGs (53 genes) in activated B cells in circulation from SLE patients (seven female samples) and adult, healthy controls (six female samples). The color gradient represents row Z-scores for each gene. Gene symbols in color denote XCI escape: orange are immunity-related genes that may escape in activated B cells; green are known XCI escape genes in other somatic cells; and blue are putative XCI escape based on Dataset S3. Genes in orange exhibited XCI escape in at least one B cell subset in Dataset S3 (E). (C and D) Volcano plot showing X-linked DEGs in circulating naïve B cells (C) and flow-sorted in vivo activated B cells in circulation (D). Genes significantly up-regulated in SLE patients are in red; genes significantly down-regulated in SLE are in blue (P < 0.05). (E) XIST RNA binding protein genes that are differentially expressed in activated B cells from SLE patients and healthy controls. Nuclear matrix/nuclear envelop genes in blue; cell metabolism/cell growth genes in green; chromatin regulators in orange; and XIST RNA binding protein genes whose expression was also altered in SLE patient T cells in pink.

Similar articles

Cited by

References

    1. Wei C., et al. ., A new population of cells lacking expression of CD27 represents a notable component of the B cell memory compartment in systemic lupus erythematosus. J. Immunol. 178, 6624–6633 (2007). - PubMed
    1. Nicholas M. W., et al. ., A novel subset of memory B cells is enriched in autoreactivity and correlates with adverse outcomes in SLE. Clin. Immunol. 126, 189–201 (2008). - PMC - PubMed
    1. Tipton C. M., et al. ., Diversity, cellular origin and autoreactivity of antibody-secreting cell population expansions in acute systemic lupus erythematosus. Nat. Immunol. 16, 755–765 (2015). - PMC - PubMed
    1. Rubtsov A. V., Rubtsova K., Kappler J. W., Marrack P., TLR7 drives accumulation of ABCs and autoantibody production in autoimmune-prone mice. Immunol. Res. 55, 210–216 (2013). - PMC - PubMed
    1. Hao Y., O’Neill P., Naradikian M. S., Scholz J. L., Cancro M. P., A B-cell subset uniquely responsive to innate stimuli accumulates in aged mice. Blood 118, 1294–1304 (2011). - PMC - PubMed

Publication types

MeSH terms