. 2021 Jun 8;12(6):591.
doi: 10.1038/s41419-021-03867-6.

A carbazole compound, 9-ethyl-9H-carbazole-3-carbaldehyde, plays an antitumor function through reactivation of the p53 pathway in human melanoma cells

Affiliations

A carbazole compound, 9-ethyl-9H-carbazole-3-carbaldehyde, plays an antitumor function through reactivation of the p53 pathway in human melanoma cells

Jie Wen et al. Cell Death Dis. .

Abstract

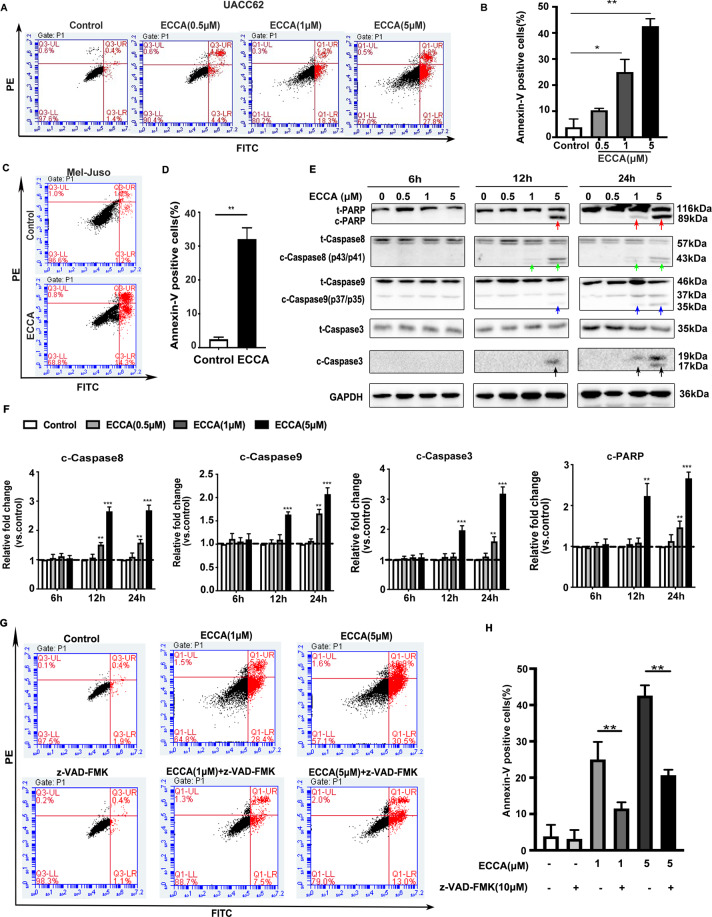
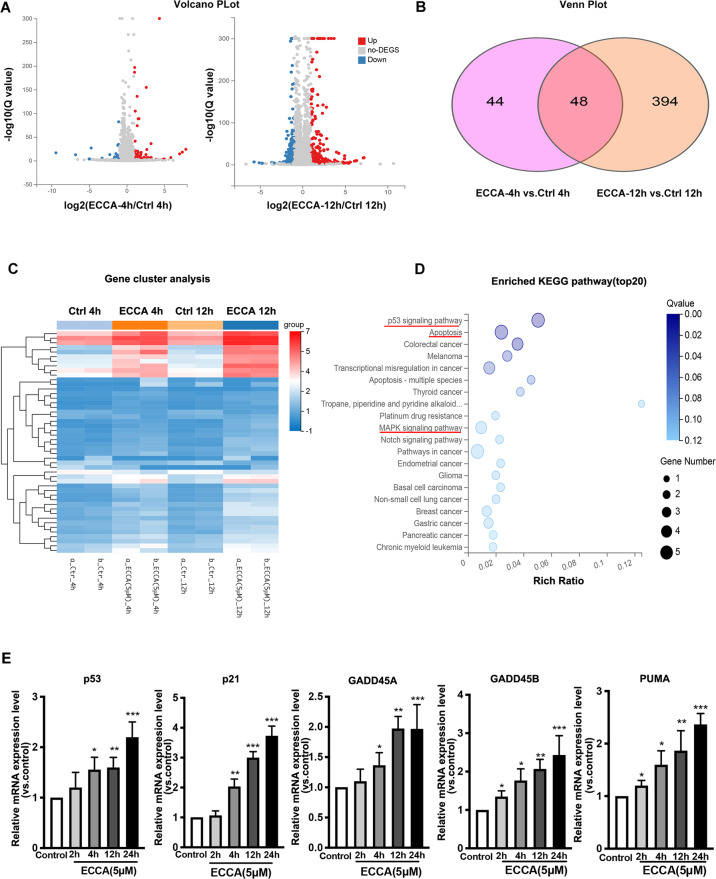
p53, the major tumor suppressor, is frequently mutated in many cancers, and up to 84% of human melanomas harbor wild-type p53, which is considered to be an ideal target for melanoma therapy. Here, we evaluated the antitumor activity of a carbazole derivative, 9-ethyl-9H-carbazole-3-carbaldehyde (ECCA), on melanoma cells. ECCA had a selectively strong inhibitory activity against the growth of BRAF-mutated and BRAF-wild-type melanoma cells but had little effect on normal human primary melanocytes. ECCA inhibited melanoma cell growth by increasing cell apoptosis, which was associated with the upregulation of caspase activities and was significantly abrogated by the addition of a caspase inhibitor. In vivo assays confirmed that ECCA suppressed melanoma growth by enhancing cell apoptosis and reducing cell proliferation, and importantly ECCA did not have any evident toxic effects on normal tissues. RNA-Seq analysis identified several pathways related to cell apoptosis that were affected by ECCA, notably, activation of the p53 signaling pathway. Biochemical assays demonstrated that ECCA enhanced the phosphorylation of p53 at Ser15 in melanoma cells harboring wild-type p53, and importantly, the knockdown or deletion of p53 in those cells counteracted the ECCA-induced apoptosis, as well as senescence. Further investigations revealed that ECCA enhanced the phosphorylation of p38-MAPK and c-Jun N-terminal kinase (JNK), and treatment with either a p38-MAPK or a JNK inhibitor rescued the cell growth inhibition elicited by ECCA, which depended on the expression of the p53 gene. Finally, the combination of ECCA with a BRAF inhibitor significantly enhanced the growth inhibition of melanoma cells. In summary, our study demonstrates that the carbazole derivative, ECCA, induces melanoma cell apoptosis and senescence through the activation of p53 to significantly and selectively suppress the growth of melanoma cells without affecting normal human melanocytes, suggesting its potential to develop a new drug for melanoma therapy.


Conflict of interest statement

The authors declare no competing interests.

Figures

Fig. 1
Fig. 1. ECCA selectively blocks the growth of melanoma cells compared to human primary melanocytes.
A Five melanoma cell lines were treated with different concentrations of ECCA as indicated, with DMSO used as a control. At 48 h, cells were collected and analyzed by the CCK8 assay for cell viability. B UACC62 cells were treated with different concentrations of ECCA as indicated, with DMSO as a control. Cells were collected at the different time points indicated and were analyzed by the CCK8 assay for cell viability. C UACC62 cells and human primary melanocytes were treated with or without various concentrations of ECCA as shown. At 48 h, cells were collected and analyzed by the CCK8 assay for cell viability. D Representative images of cell colony formation assays with or without different concentrations of ECCA as indicated at 7 days using crystal violet staining. Scale bar represents 5 mm. E Quantification of cell colony numbers in D. F Representative images of immunofluorescence staining of EDU (green) at 24 h after ECCA treatment at different concentrations as indicated. DAPI (blue) stain indicates nuclei. White arrows indicate EDU-positive cells. Scale bars represent 100 μm. G Quantification of EDU-positive cell percentage (%) of a total of 500 DAPI-positive cells in F. All experiments were carried out three times, and error bars represent means + SD; P values are indicated with “*”, * indicates P < 0.05, ** indicates P < 0.01, *** indicates P < 0.005 when comparing ECCA-treated cells with the control group in A, B, E, and G by Student’s t test and comparing two groups as indicated in C by ANOVA assay.
Fig. 2
Fig. 2. ECCA induces cell apoptosis in a time- and dose-dependent manner.
A UACC62 cells were treated with ECCA at 0, 0.5, 1, and 5 µM, and at 12 h cells were collected and analyzed for cell apoptosis by FACS analysis. B Quantification of the percentage of the apoptotic cells in A. C Mel-Juso cells were treated with ECCA at 0 or 10 µM and at 12 h, cells were collected and analyzed for cell apoptosis by FACS analysis. D Quantification of the percentage of the apoptotic cells in C. E UACC62 cells treated with or without various concentrations of ECCA were lysed at different time points as indicated and immunoblotting analysis was performed for total and cleaved forms of Caspase8, -9, -3, and PARP. GAPDH as a housekeeping gene was used as a loading control. Red, green, blue, and black arrows, respectively, indicate the upregulated expression of cleaved (c) forms for PARP (c-PARP), Caspase8 (c-Caspase8), Caspase9 (c-Caspase9), and Caspase3 (c-Caspase3). F Quantification of the relative levels of c-Caspase8, c-Caspase9, c-Caspase3, and c-PARP in E, as relative fold change to the respective control cells, indicated by a dashed line as 1, after each phosphorylated protein was normalized to the corresponding total protein band. G UACC62 cells were treated with different conditions: DMSO (control), 10 µM z-VAD-FMK, 1 µM ECCA, z-VAD-FMK (10 µM) + ECCA (1 µM), 5 µM ECCA, z-VAD-FMK (10 µM) + ECCA (5 µM), and after 12 h, cells were collected and analyzed for cell apoptosis by FAC analysis. H Quantification of apoptotic cell percentage in G. All experiments were carried out three times, and error bars represent means + SD; P values are indicated with “*”, * indicates P < 0.05, ** indicates P < 0.01 when comparing ECCA-treated cells with the control group in B, D, F, and H by Student’s t test; Lines in H indicate comparisons of two specific groups.
Fig. 3
Fig. 3. ECCA suppresses melanoma tumor growth in vivo.
A, B Upper. Representative images of tumors from mice (shown in Fig. S2A, B) taken 3 weeks after xenografting UACC62 A and Mel-Juso B cells combined with the intraperitoneal injection of ECCA or PBS (control). Lower, quantification of the average weight of tumors. C Representative images of immunofluorescence staining to detect Ki67 (green) expression in subcutaneous tumor sections. DAPI (blue) staining identifies nuclei. White arrows indicate Ki67-positive cells. Scale bars indicate 100 μm. D Quantification of Ki67-positive cell percentage (%) of a total of 500 DAPI-positive cells in C. E Representative images of immunofluorescence staining to detect cleaved-Caspase3 (red) expression in subcutaneous tumor sections. DAPI (blue) staining identifies nuclei. White arrows indicate cleaved-Caspase3-positive cells. Scale bars indicate 100 μm. F Quantification of cleaved-Caspase3-positive cell percentage (%) of a total of 500 DAPI-positive cells in E. G Immunoblotting analysis of total and cleaved forms of PARP, Caspase9, and Caspase3 in tumors treated with PBS (control) or with ECCA. GAPDH is a housekeeping gene used as a loading control. H Quantification of the relative levels of c-PARP, c-Caspase9, and c-Caspase3 in G, as relative fold change to the respective control cells, after each cleaved protein was normalized to the corresponding total protein band. All experiments were carried out three times, and error bars represent means + SD; P values are indicated with “*”, * indicates P < 0.05, ** indicates P < 0.01 when comparing the ECCA-treated group with the control group in A, B, D, F, and H by Student’s t test.
Fig. 4
Fig. 4. RNA-seq analysis of the effect of ECCA on the gene expression profile of UACC62 cells.
A Volcano plot visualizing DEGs between the ECCA group and the control group at 4 h and at 12 h. The p value <0.001 was used as a threshold to determine the significance of DEGs. Red dots represent upregulated DEGs, blue dots represent downregulated DEGs, and gray dots indicate transcripts that did not change significantly between the two groups. B Venn plot presenting the number of DEGs between the ECCA-treated group and the control group at 4 h and at 12 h. C Gene cluster analysis of 48 common DEGs was conducted based on the FPKM value of each sample. The X axis represents the different samples, whereas the Y axis represents DEGs. The color (from blue to red) represents DEG expression intensities from low to high. D KEGG pathway enrichment of DEGs. The X axis shows the enrichment factor; the left Y axis shows the top 20 positive KEGG pathway names. The darker the color represents the smaller the q value. Bubble size indicates DEG number. E Relative expression levels of mRNAs (p53, p21, GADD45A, GADD45B, and PUMA) normalized by the human 36β4 gene, in UACC62 cells treated with or without 5 µM ECCA at 2, 4, 6, 12 h by RT-PCR analysis. All experiments were carried out three times and error bars represent means + SD; P values are indicated with “*”, * indicates P < 0.05, ** indicates P < 0.01, *** indicates P < 0.005 when comparing the ECCA-treated group with the control group in E by Student’s t test.
Fig. 5
Fig. 5. ECCA activates the p53 pathway to induce melanoma cell apoptosis.
A Immunoblotting analysis of total and phosphorylated forms of p53 and p21 in UACC62 cells treated with or without ECCA at the indicated concentrations and times. Red and blue arrows, respectively, indicate the upregulated expression of p-p53 at Ser15 and p21. GAPDH is a housekeeping gene used as a loading control. B Quantification of the relative levels of p-p53 and p21 in A, as a relative fold change to the respective control cells, indicated by a dashed line as 1, after each phosphorylated protein was normalized to the corresponding total protein band. C Immunoblotting analysis of total and phosphorylated forms of p53 in UACC62, A375, Mel-Juso, M14, and WM115 cells treated with ECCA at 5 μM at 24 h. Green arrows indicate the upregulated expression of p-p53 at Ser15. GAPDH is a housekeeping gene used as a loading control. D Quantification of the relative levels of p-p53 in C, as a relative fold change to the respective control cells, indicated by a dashed line as 1, after each phosphorylated protein was normalized to the corresponding total protein band. E UACC62 cells were transfected with three independent p53 siRNAs, and at 48 h after transfection, the cells were treated with 5 µM ECCA. At 24 h, cells were collected for cell viability analysis using the CCK8 assay. F Wild-type (control) and p53-ko UACC62 cells were treated with ECCA (5 µM) or with DMSO as the control, and at 24 h, cells were collected for analysis using the CCK8 assay. G Wild-type (control) and p53-ko UACC62 cells were treated with ECCA (5 µM) or with DMSO as a control, and at 12 h after treatment, cells were analyzed by FACS for cell apoptosis. H Quantification of apoptotic cells percentage in G. I Wild-type and p53-ko UACC62 cells were treated with 5 µM ECCA for 24 h, then were fixed and analyzed using an SA-β-gal staining kit to detect senescent cells (blue, white arrows). Scale bars = 100 µm. J Quantification of SA-β-gal–positive cells (blue, white arrows) based on counting a total of 500 cells in I. K Immunoblotting analysis of total forms of p21 and p16 in wild-type and p53-ko UACC62 cells treated with or without ECCA. GAPDH is a housekeeping gene used as a loading control. Black and gray arrows, respectively, indicate the upregulated expression of p21 and p16. L Quantification of the relative levels of p21 and p16 in K, as relative fold change to the respective control cells, after each protein was normalized to the GAPDH band. All experiments were carried out three times, and error bars represent means ± SD; P values are indicated with “*”, * indicates P < 0.05, ** indicates P < 0.01, *** indicates P < 0.005 when comparing the ECCA-treated group with the control group in (B and D, comparing the p53-siRNA group with the siRNA-control group in E, and comparing the corresponding two groups indicated by lines in F, H, and J by Student’s t test.
Fig. 6
Fig. 6. ECCA increases the phosphorylation level of p38-MAPK and JNK kinases.
A Immunoblotting analysis of phosphorylated and total forms of JNK, p38-MAPK, and ERK proteins in UACC62 cells treated with or without ECCA at the indicated concentrations and times. Red and blue arrows indicate the upregulated expression of p-JNK and p-p38-MAPK, respectively. GAPDH is a housekeeping gene used as a loading control. B, C Quantification of the relative levels of phosphorylated JNK (B) and p38 (C) in A, which shows relative fold change to the respective control group, indicated by a dashed line as 1, after each phosphorylation protein was normalized to the corresponding total protein band (JNK or p38). D Immunoblotting analysis of phosphorylated and total forms of JNK, p38-MAPK, p53, and cleaved and total forms of Caspase9 and Caspase3 proteins in UACC62 cells treated with different conditions (DMSO (control), SB202190, JNK-IN-8, ECCA, ECCA + SB202190, ECCA + JNK-IN-8) at 24 h. Red, blue, and green arrows indicate the downregulated expression of p-JNK, p-p38-MAPK, and p-p53, respectively. Black and yellow arrows indicate the upregulated expression of C-Caspase9 and C-Caspase3. GAPDH is a housekeeping gene used as a loading control. EI Quantification of the relative levels of phosphorylated JNK (E), p38 (F), p53 (G), cleaved Caspase9 (H), and Caspase3 (I) in D. J Wild-type (control) and p53-ko UACC62 cells were treated with different conditions: DMSO (control), ECCA, ECCA + SB202190, ECCA + JNK-IN-8. Cells at 12 h after treatment were collected and analyzed by the CCK8 assay for cell viability. All experiments were carried out three times, and error bars represent means ± SD; P values are indicated with “*”, ** indicates P < 0.01, *** indicates P < 0.005 when comparing the ECCA-treated group with the control group in B and C and comparing the corresponding two groups indicated by lines in (EJ) by Student’s t test.
Fig. 7
Fig. 7. ECCA significantly enhances the inhibition of melanoma cell growth together with a BRAFV600E inhibitor.
A Four melanoma cell lines were treated with different conditions: DMSO (Control), 5 μM ECCA, 1 μM PLX4032 or 5 μM ECCA + 1 μM PLX4032. At 48 h, cells were collected and analyzed by the CCK8 assay for cell viability. B Immunoblotting analysis of phosphorylated and total forms of p53 and ERK proteins in UACC62 and A375 cells at 24 h treated with different conditions as A. C, D Quantification of the relative levels of phosphorylated p53 (C) and ERK (D) from blots in (B). E Scheme showing that ECCA and the BRAFV600E inhibitor target two separate pathways (p53-apoptosis and ERK-proliferation) in parallel to induce the synergistic suppression of melanoma cell growth. All experiments were carried out three times, and error bars represent means ± SD; P values are indicated with “*”, ** indicates P < 0.01 when comparing the corresponding two groups as indicated by lines in (A, C, D).

Similar articles

Cited by

References

    1. Sanz G, Singh M, Peuget S, Selivanova G. Inhibition of p53 inhibitors: progress, challenges and perspectives. J. Mol. Cell Biol. 2019;11:586–599. doi: 10.1093/jmcb/mjz075. - DOI - PMC - PubMed
    1. Loureiro JB, Abrantes M, Oliveira PA, Saraiva L. P53 in skin cancer: from a master player to a privileged target for prevention and therapy. Biochim Biophys. Acta Rev. Cancer. 2020;1874:188438. doi: 10.1016/j.bbcan.2020.188438. - DOI - PubMed
    1. Box NF, Vukmer TO, Terzian T. Targeting p53 in melanoma. Pigment Cell Melanoma Res. 2014;27:8–10. doi: 10.1111/pcmr.12180. - DOI - PMC - PubMed
    1. Lu M, Miller P, Lu X. Restoring the tumour suppressive function of p53 as a parallel strategy in melanoma therapy. FEBS Lett. 2014;588:2616–2621. doi: 10.1016/j.febslet.2014.05.008. - DOI - PubMed
    1. Grob TJ, Novak U, Maisse C, Barcaroli D, Luthi AU, Pirnia F, et al. Human delta Np73 regulates a dominant negative feedback loop for TAp73 and p53. Cell Death Differ. 2001;8:1213–1223. doi: 10.1038/sj.cdd.4400962. - DOI - PubMed

Publication types

MeSH terms