. 2021 Jun 8;12(6):589.
doi: 10.1038/s41419-021-03878-3.

Resolving the graft ischemia-reperfusion injury during liver transplantation at the single cell resolution

Affiliations

Resolving the graft ischemia-reperfusion injury during liver transplantation at the single cell resolution

Linhe Wang et al. Cell Death Dis. .

Abstract

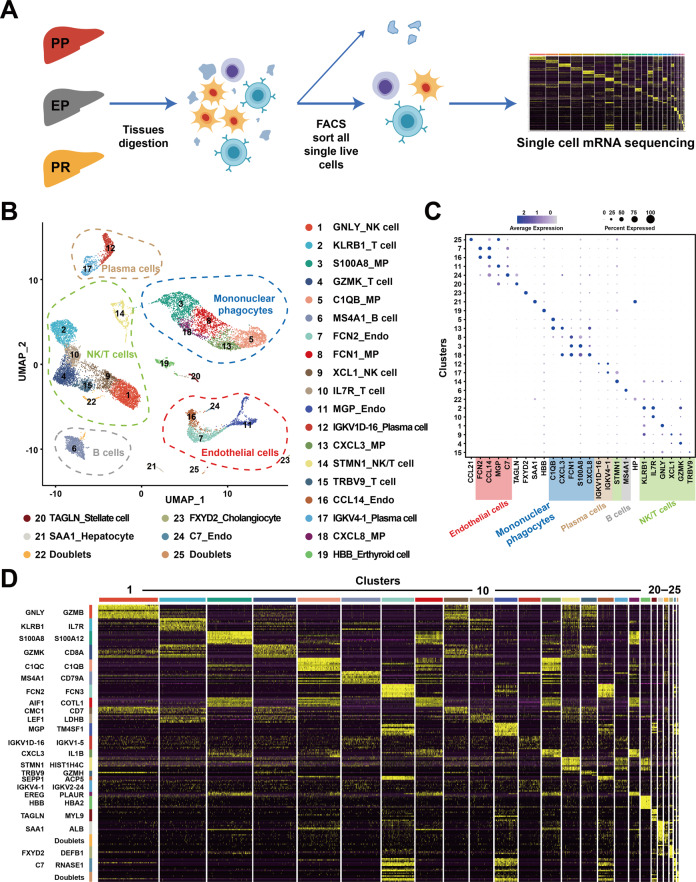
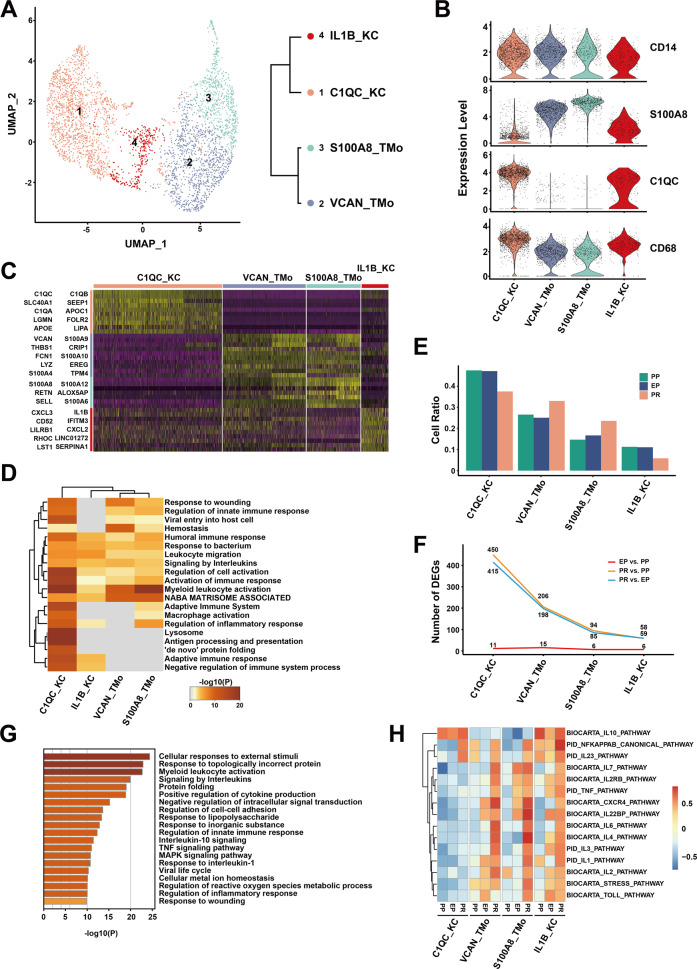
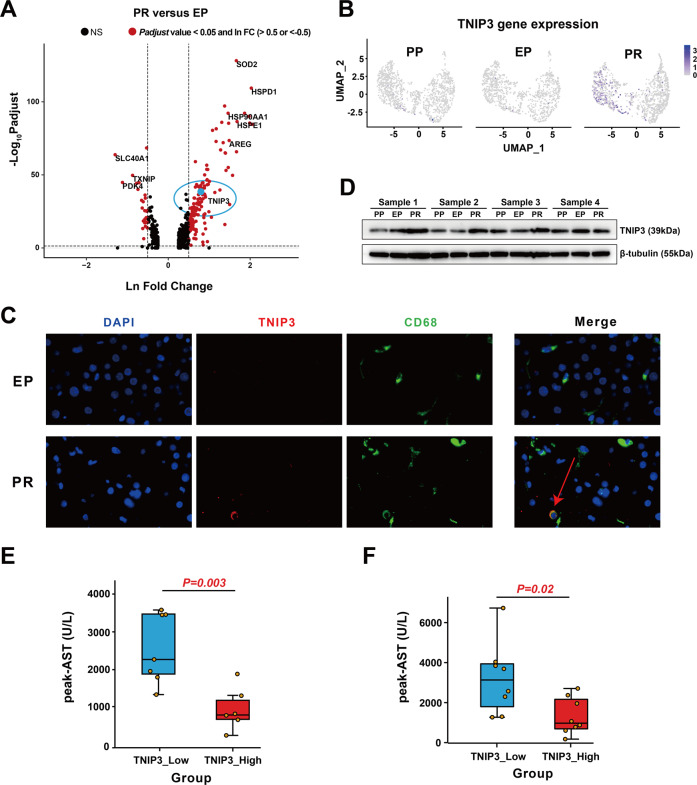
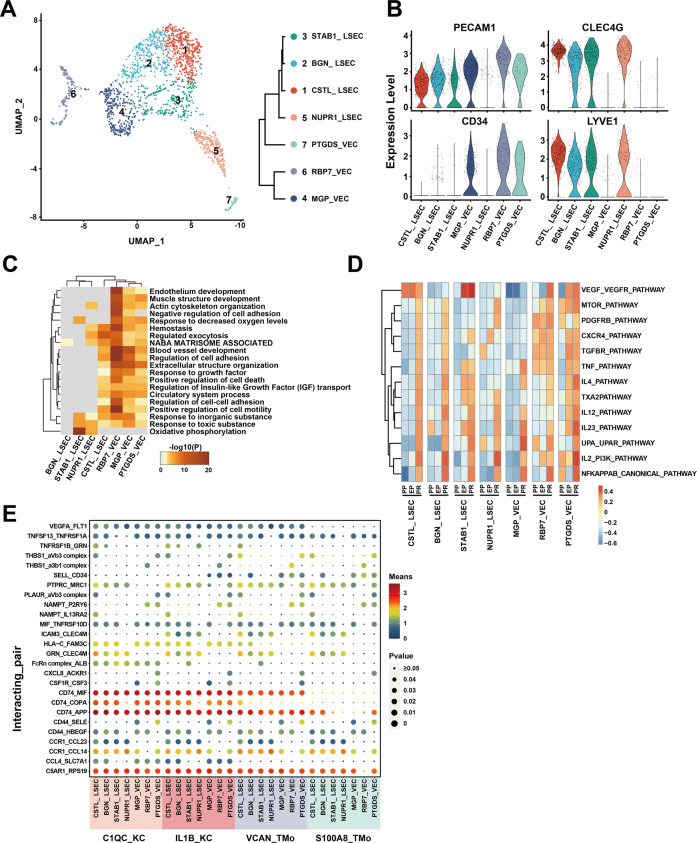
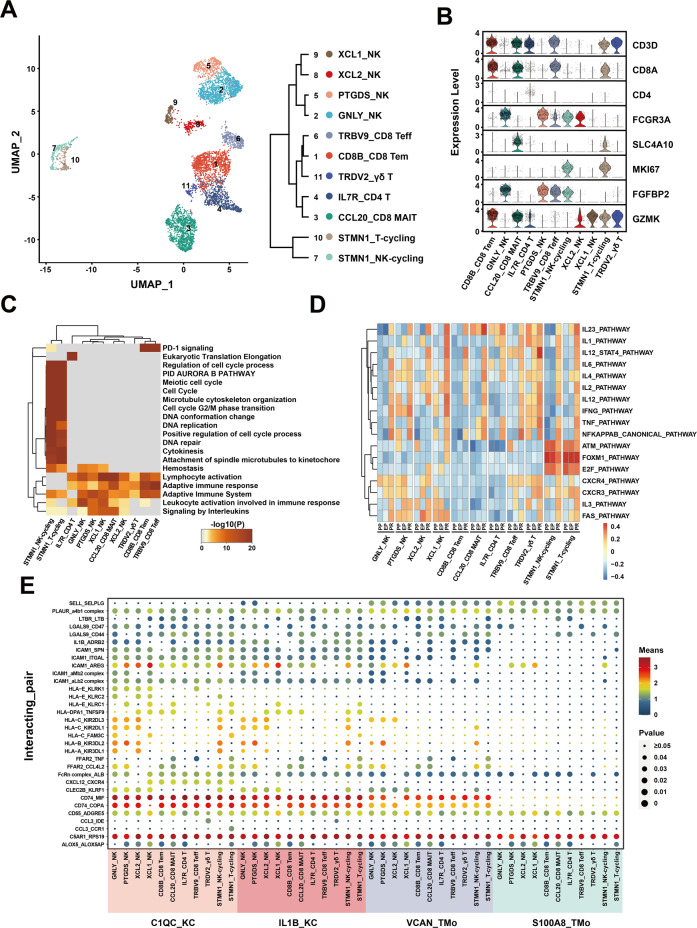
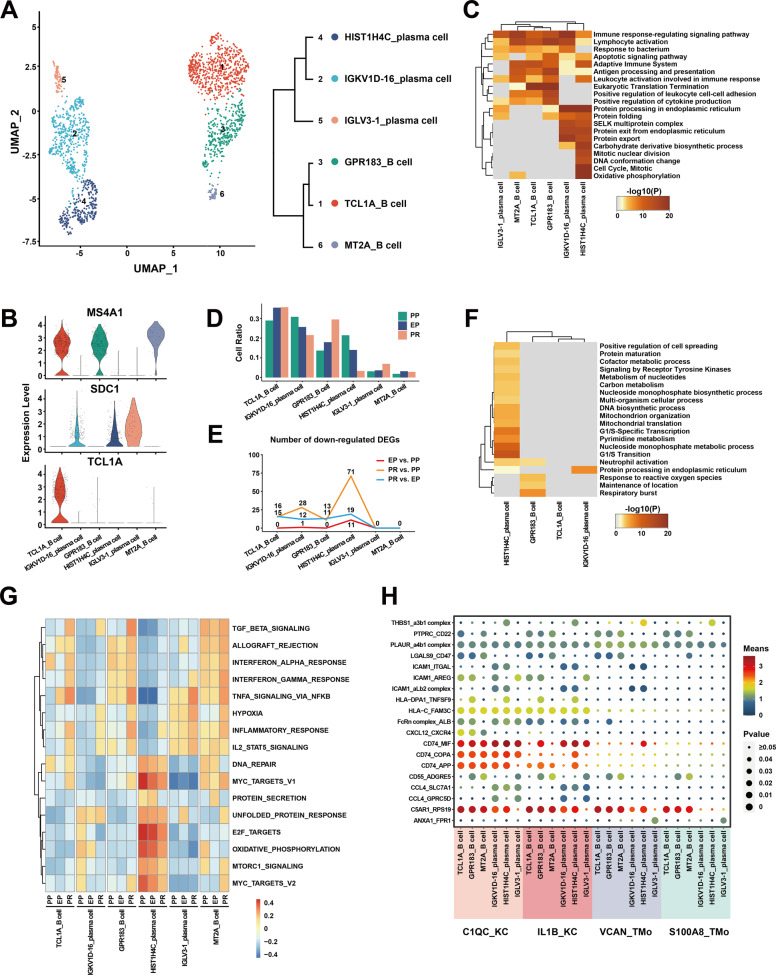
Ischemia-reperfusion injury (IRI) remains the major reason for impaired donor graft function and increased mortality post-liver transplantation. The mechanism of IRI involves multiple pathophysiological processes and numerous types of cells. However, a systematic and comprehensive single-cell transcriptional profile of intrahepatic cells during liver transplantation is still unclear. We performed a single-cell transcriptome analysis of 14,313 cells from liver tissues collected from pre-procurement, at the end of preservation and 2 h post-reperfusion. We made detailed annotations of mononuclear phagocyte, endothelial cell, NK/T, B and plasma cell clusters, and we described the dynamic changes of the transcriptome of these clusters during IRI and the interaction between mononuclear phagocyte clusters and other cell clusters. In addition, we found that TNFAIP3 interacting protein 3 (TNIP3), specifically and highly expressed in Kupffer cell clusters post-reperfusion, may have a protective effect on IRI. In summary, our study provides the first dynamic transcriptome map of intrahepatic cell clusters during liver transplantation at single-cell resolution.


Conflict of interest statement

The authors declare no competing interests.

Figures

Fig. 1
Fig. 1. Overview of scRNA-seq from samples in liver transplantation.
A Workflow of tissue collection, sample processing, and data acquisition. Collect samples from three-time points, PP, EP, and PR, for tissue digestion. Next, sort live cells by FACS and construct cDNA libraries, then perform high-throughput sequencing and downstream analyses. B UMAP visualization of all cells (14,313) in 25 clusters. Each dot represents one cell, with colors coded according to the different clusters. Clusters are named by the most specific and highly expressed genes. MP mononuclear phagocytes, Endo endothelial cells. C Dot plots showing the most highly expressed marker genes (x-axis) of major cell types (y-axis) in Fig. 1B. The color of the dots represents the level of gene expression while the size of the dot represents the percentage of cells expressing the gene. D Heatmap of top ten differentially expressed genes between different clusters. The line is colored according to clusters in Fig. 1B. Each cluster lists the top two genes shown on the left.
Fig. 2
Fig. 2. scRNA-seq of mononuclear phagocytes in liver transplantation.
A UMAP plot showing four mononuclear phagocyte clusters (3622 cells) in liver transplantation, colored according to different clusters (left panel). Dendrogram of four clusters by the hierarchical clustering analysis based on their normalized mean expression values (right panel). B Violin plots showing the normalized expression of CD14, S100A8, C1QC, and CD68 genes (y-axis) for TMo and KC clusters (x-axis). C Heatmap of top ten differentially expressed genes between different mononuclear phagocyte clusters. The line is colored according to clusters in Fig. 2A. D Gene Ontology enrichment analysis results of mononuclear phagocyte clusters. Only the top 20 most significant GO terms (p value < 0.05) are shown in rows. E Cell ratio of different mononuclear phagocyte clusters in PP, EP, and PR samples. F Number of upregulated DEGs between different timepoint samples in different mononuclear phagocyte clusters. G Gene Ontology enrichment analysis results of upregulated DEGs in C1QC_KC cluster after reperfusion (PR vs. EP). Only the top 20 significant GO terms (p value < 0.05) are shown in rows. H The gene set variation analysis (GSVA) showing the pathways (PID and BIOCARTA gene sets) with significantly different activation in different samples of mononuclear phagocyte clusters. Different colors represent different activation scores.
Fig. 3
Fig. 3. TNIP3 expression is specifically increased in KC clusters after IRI.
A Volcano plot shows the DEGs of PR vs. EP in the C1QC_KC cluster. The red dots represent p adjust value less than 0.05 and lnFC greater than 0.5 or less than −0.5, the blue dot represents TNIP3, and the rest are black dots. B Feature plots showing the normalized expression of TNIP3 in mononuclear phagocyte clusters of PP, EP, and PR. Color represents the level of gene expression. C Immunofluorescence showed that the expression of TNIP3 (red), CD68 (green), and DAPI (purple) in EP and PR samples. CD68+ TNIP3+ cells only appeared in partly cells in the PR sample. D Western Blot results showed that the expression of TNIP3 in PR samples was higher than that in the EP and PP samples. E The postoperative peak-AST level in the TNIP3_low group was higher than the TNIP3_high group (n = 13, 880 vs. 2506 U/L, p = 0.003) according to bulk RNA-seq data analysis results, each point represents a patient. F The postoperative peak-AST level in the TNIP3_low group was higher than the TNIP3_high group (n = 16, 1316 vs. 3216 U/L, p = 0.02) according to the RT-PCR results of 16 pairs of liver samples.
Fig. 4
Fig. 4. scRNA-seq of endothelial cells in liver transplantation.
A UMAP plot showing seven endothelial cell clusters in liver transplantation, colored according to different clusters (left panel). Dendrogram of seven clusters by hierarchical clustering analysis based on their normalized mean expression values (right panel). B Violin plots showing the normalized expression of PECAM1, CLEC4G, CD34, and LYVE1 genes (y-axis) for endothelial cell clusters (x-axis). C Gene Ontology enrichment analysis results of endothelial cell clusters. Only the top 20 most significant GO terms (p value < 0.05) are shown in rows. D GSVA showing the pathways (PID gene sets) with significantly different activation in different samples of endothelial cell clusters. Different colors represent different activation scores. E Cell–cell interaction analysis between mononuclear phagocyte clusters and different endothelial cell clusters in PR samples. Ligand–receptor pairs are labeled in y-axis. The size of the circle represents the level of p value while different colors represent different means value. Ligands come from mononuclear phagocyte clusters, and receptors come from endothelial cell clusters.
Fig. 5
Fig. 5. scRNA-seq of NK/T cells in liver transplantation.
A UMAP plot showing 11 NK/T cell clusters in liver transplantation, colored according to different clusters (left panel). Dendrogram of 11 clusters by the hierarchical clustering analysis based on their normalized mean expression values (right panel). B Violin plots showing the normalized expression of marker genes (y-axis) for NK/T cell clusters (x-axis). C Gene Ontology enrichment analysis results of NK/T cell clusters. Only the top 20 most significant GO terms (p value < 0.05) are shown in rows. D GSVA showing the pathways (PID gene sets) with significantly different activation in different samples of NK/T cell clusters. Different colors represent different activation scores. E Cell–cell interaction analysis between mononuclear phagocyte clusters and different NK/T cell clusters in PR samples. Ligand–receptor pairs labeled in y-axis. The size of the circle represents the level of p value, and different colors represent different means values. Ligands come from mononuclear phagocyte clusters, and receptors come from NK/T cell clusters.
Fig. 6
Fig. 6. scRNA-seq of B/plasma cells in liver transplantation.
A UMAP plot showing six B/plasma cell clusters in liver transplantation, colored according to different clusters (left panel). Dendrogram of six clusters by hierarchical clustering analysis based on their normalized mean expression values (right panel). B Violin plots showing the normalized expression of MS4A1, SDC1, and TCL1A genes (y-axis) for B/plasma cell clusters (x-axis). C Gene Ontology enrichment analysis results of B/plasma cell clusters. Only the top 20 most significant GO terms (p value < 0.05) are shown in rows. D Cell ratio of different B/plasma cell clusters in PP, EP, and PR samples. GSVA showing the pathways (PID gene sets) with significantly different activation in different samples of B/plasma cell clusters. Different colors represent different activation scores. E Number of down-regulated DEGs between different samples in different B/plasma cell clusters. F Gene Ontology enrichment analysis results of downregulated DEGs from PR vs. PP. Only the top 20 most significant GO terms (p value < 0.05) are shown in rows. G GSVA showing the pathways (HALLMARK gene sets) with significantly different activation in different samples of B/plasma cell clusters. Different colors represent different activation scores. H Cell–cell interaction analysis between mononuclear phagocyte clusters and different B/plasma cell clusters in PR samples. Ligand-receptor pairs labeled in y-axis. The size of the circle represents the level of p value, and different colors represent different means values. Ligands come from mononuclear phagocyte clusters, and receptors come from B/plasma cell clusters.

Similar articles

Cited by

References

    1. Crismale JF, Ahmad J. Expanding the donor pool: hepatitis C, hepatitis B and human immunodeficiency virus-positive donors in liver transplantation. World J. Gastroenterol. 2019;25:6799–812. doi: 10.3748/wjg.v25.i47.6799. - DOI - PMC - PubMed
    1. Paulino J, et al. Clinical outcomes and genetic expression profile in human liver graft dysfunction during ischemia/reperfusion injury. Transpl. Proc. 2015;47:882–7. doi: 10.1016/j.transproceed.2015.03.025. - DOI - PubMed
    1. Peralta C, Jiménez-Castro MB, Gracia-Sancho J. Hepatic ischemia and reperfusion injury: effects on the liver sinusoidal milieu. J. Hepatol. 2013;59:1094–106. doi: 10.1016/j.jhep.2013.06.017. - DOI - PubMed
    1. Gracia-Sancho J, et al. Flow cessation triggers endothelial dysfunction during organ cold storage conditions: strategies for pharmacologic intervention. Transplantation. 2010;90:142–9. doi: 10.1097/TP.0b013e3181e228db. - DOI - PMC - PubMed
    1. Selzner N, Rudiger H, Graf R, Clavien PA. Protective strategies against ischemic injury of the liver. Gastroenterology. 2003;125:917–36. doi: 10.1016/S0016-5085(03)01048-5. - DOI - PubMed

Publication types

MeSH terms