. 2021 Jun 8;12(1):3451.
doi: 10.1038/s41467-021-23507-z.

Aβ receptors specifically recognize molecular features displayed by fibril ends and neurotoxic oligomers

Affiliations

Aβ receptors specifically recognize molecular features displayed by fibril ends and neurotoxic oligomers

Ladan Amin et al. Nat Commun. .

Abstract

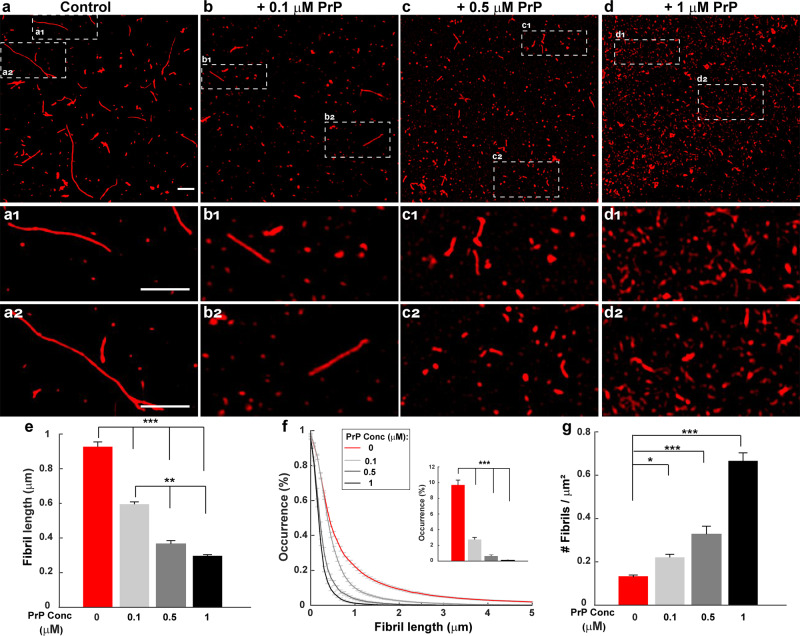
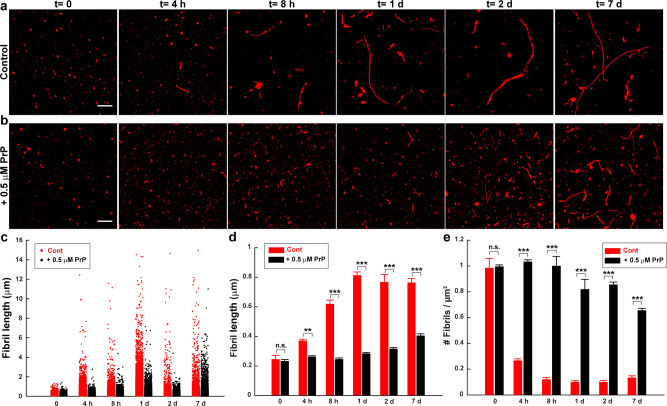
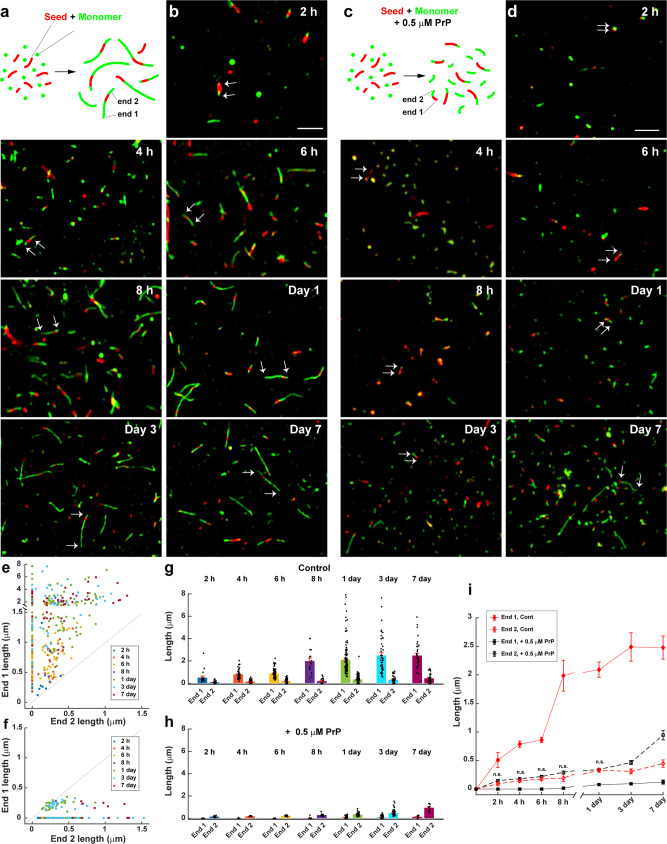
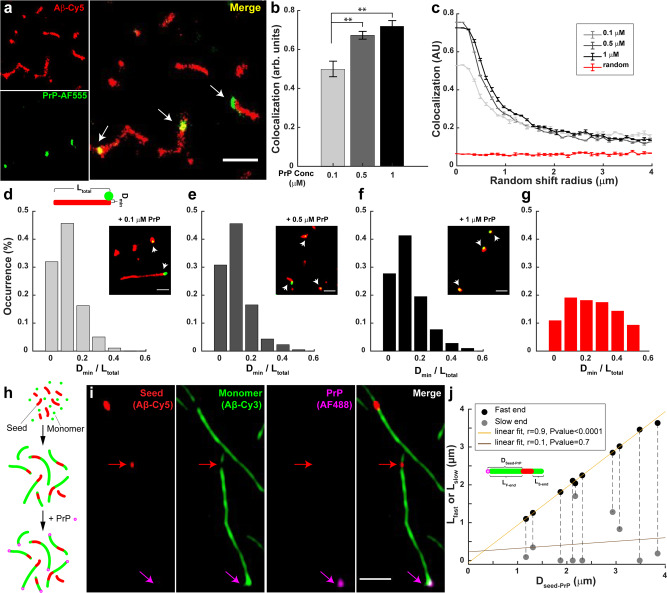
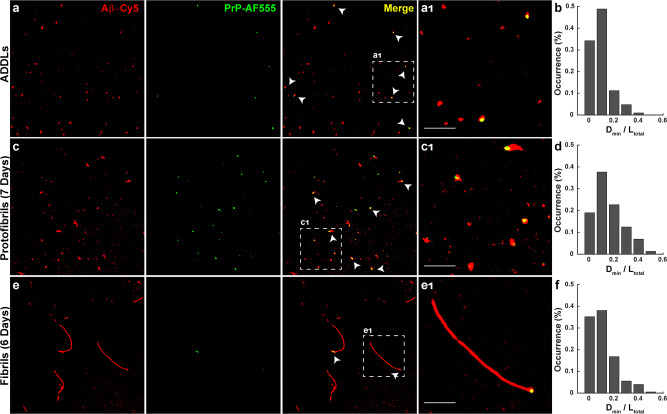
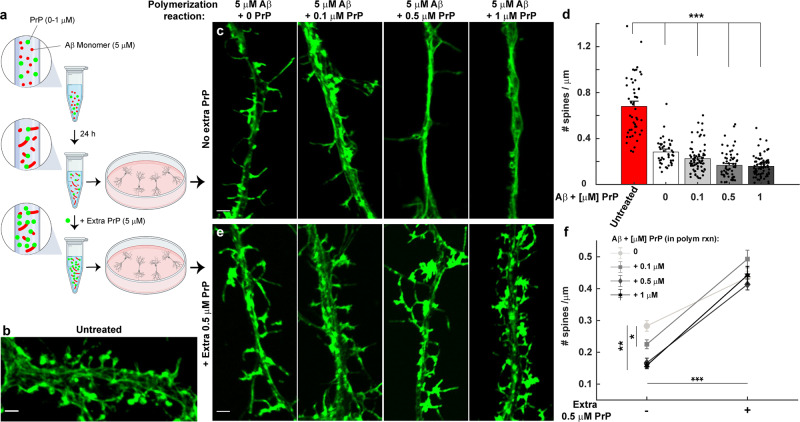
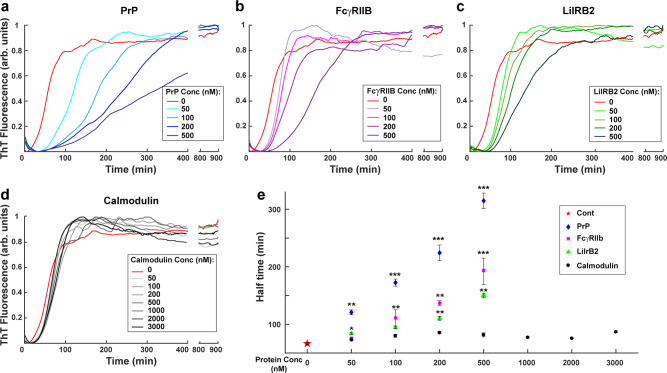
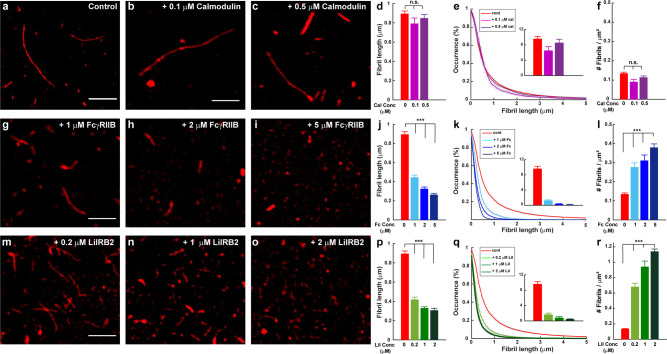
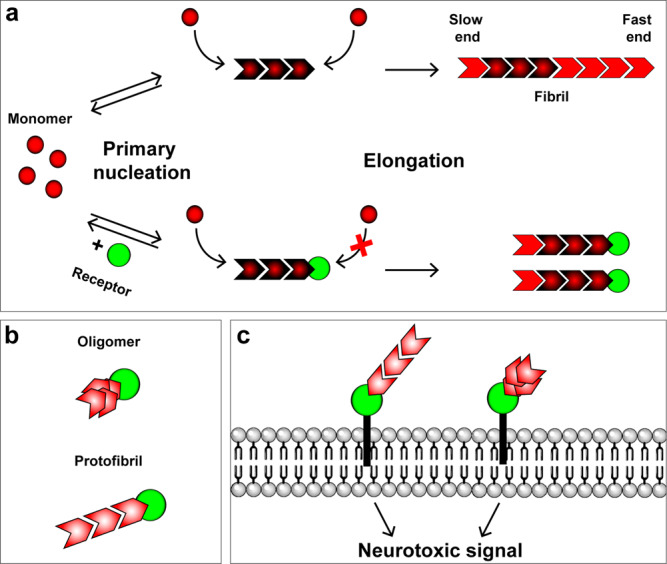
Several cell-surface receptors for neurotoxic forms of amyloid-β (Aβ) have been described, but their molecular interactions with Aβ assemblies and their relative contributions to mediating Alzheimer's disease pathology have remained uncertain. Here, we used super-resolution microscopy to directly visualize Aβ-receptor interactions at the nanometer scale. We report that one documented Aβ receptor, PrPC, specifically inhibits the polymerization of Aβ fibrils by binding to the rapidly growing end of each fibril, thereby blocking polarized elongation at that end. PrPC binds neurotoxic oligomers and protofibrils in a similar fashion, suggesting that it may recognize a common, end-specific, structural motif on all of these assemblies. Finally, two other Aβ receptors, FcγRIIb and LilrB2, affect Aβ fibril growth in a manner similar to PrPC. Our results suggest that receptors may trap Aβ oligomers and protofibrils on the neuronal surface by binding to a common molecular determinant on these assemblies, thereby initiating a neurotoxic signal.


Conflict of interest statement

The authors declare no competing interests.

Figures

Fig. 1
Fig. 1. PrP promotes formation of shorter, more numerous Aβ fibrils.
Aβ-Cy5 monomer (20 µM) was polymerized for 24 h in the presence of 0 µM (a), 0.1 µM (b), 0.5 µM (c), or 1 µM (d) PrP-AF555. Fibrils were then imaged by SIM. Panels a1,2d1,2 show boxed areas in (ad), respectively, at higher magnification. Scale bars are 1 µm. e Bars show mean fibril length at each PrP concentration. f Cumulative distributions of fibril length at each PrP concentration. Inset indicates the number of fibrils larger than 2 µm. g Bars indicate the number of detectable Aβ-Cy5 fibrils/μm2 at each PrP concentration. Data represent mean ± S.E. *P < 0.05, **P < 0.01 and ***P < 0.001 (two-sided Student’s t-test). The numbers of biological independent samples (N) and analyzed images (X) in each conditions are: Control: N = 9, X = 44; +0.1 µM PrP: N = 6, X = 22; +0.5 µM PrP: N = 10, X = 20; +1 µM PrP: N = 5, X = 15.
Fig. 2
Fig. 2. PrP slows the growth of Aβ fibrils.
Aβ-Cy5 monomer (20 µM) was polymerized for the indicated times in the presence of 0 µM (a) or 0.5 µM (b) PrP-AF555. Fibrils were then imaged by SIM. Scale bar in (a, b) (t = 0) is 1 µm. c Distributions of fibril lengths at each time point in the presence of 0 µm (red dots) or 0.5 µM PrP-AF555 (black dots). Each dot represents an individual fibril. d, e Bars indicate the mean length of fibrils (d) and the number of detectable Aβ-Cy5 fibrils/μm2 (e) at each time point for 0 and 0.5 µM PrP-AF555. Data represent mean ± S.E. *P < 0.05, **P < 0.01 and ***P < 0.001 (two-sided Student’s t-test). The numbers of biological independent samples (N) and analyzed images (X) in each conditions are: N ≥ 3, X ≥ 6.
Fig. 3
Fig. 3. Aβ polymerization is strongly polarized, and PrP selectively blocks elongation at the fast-growing end.
a Schematic representation of a seeding assay, in which fresh monomers labeled with Cy3 (green) were added to sheared, preformed fibrils (seeds) labeled with Cy5 (red). The two ends of each seed elongate at different rates, resulting in long and short green extensions, designated End 1 and End 2, respectively. b Two-color SIM images acquired at the indicated times after addition of Aβ-Cy3 monomers (10 µM) to Aβ-Cy5 seeds (10 µM monomer equivalent). Arrows in each panel indicate the elongation of the seed at the two ends. Scale bar in (b) (2 h) is 2 µm. c Schematic representation of the seeding assay in the presence of 0.5 µM PrP. d Two-color SIM images acquired as in (b), but in the presence of 0.5 µM PrP. Arrows in each panel show that seeds elongate at only one end. Scale bar in (d) (2 h) is 2 µm. e, f Scatterplots showing the lengths of End 1 and End 2 over time for each detected seed in the absence of PrP (e) and in the presence of 0.5 µM PrP (f). The total number of seeds measured was 390 and 215 for 0 µM and 0.5 µM PrP, respectively. g, h Bars indicate the mean lengths of End 1 and End 2 over time in the absence of PrP (g) and in the presence of 0.5 µM PrP (h). Data represent mean ± S.E. i Change in the mean lengths of End 1 and End 2 over time, with and without PrP. These are the same data as in (g, h), but plotted to allow easier comparison of the different conditions. n.s., no statistically significant difference between End 2 length with and without PrP at the indicated time points. Error bars represent mean ± S.E. *P < 0.05, **P < 0.01 and ***P < 0.001 (two-sided Student’s t-test). Numbers of biological independent samples (N) and analyzed images (X) in each time point are: N ≥ 3, X ≥ 9.
Fig. 4
Fig. 4. PrP binds exclusively to the fast-growing end of Aβ fibrils.
a dSTORM images of Aβ-Cy5 (20 µM) polymerized for 24 h in the presence of 0.5 µM PrP-AF555. Arrows in the merged image indicate the localization of PrP near the ends of Aβ fibrils. Scale bar is 1 µm. b Bars indicate the colocalization between Aβ and PrP-AF555 at different concentration of PrP. Data represent mean ± S.E. **P < 0.01 and ***P < 0.001 (two-sided Student’s t-test). c Colocalization between Aβ and PrP decays after a set of random direction shifts, and approaches the values derived from unrelated PrP and Aβ images from two different experiments (red line). Error bars represent mean ± S.E. df Aβ-Cy5 (20 µM) was polymerized for 24 h in the presence of either 0.1 µM, 0.5 µM, or 1 µM PrP-AF555, and samples were imaged by SRM. Histograms show the distribution of Dmin/Ltotal values (see cartoon in d) for 95-227 fibrils with associated PrP spots. Insets show the dSTORM images of Aβ fibrils (red) formed in the present of different concentration of PrP-AF555 (green). Scale bars are 0.5 µm. g Random distribution of Dmin/Ltotal values derived from unrelated PrP and Aβ images from two different experiments. The number of analyzed SIM images in +0.1 µM PrP, +0.5 µM PrP, +1 µM PrP and random condition are: X = 14; 10; 10, and 17, respectively. h Schematic representation of three-color imaging assay. i Individual fibrils imaged for Cy5 (Aβ seed), Cy3 (Aβ monomer), AF488 (PrP), and a merge of the three colors. The magenta arrow indicates PrP bound to the fast-growing end of a single fibril. The red arrow indicates the position of the seed. Scale bar is 1 µm. j Distance between the seed and the PrP spot (Dseed-PrP) plotted against the lengths of the fast- and slow-growing ends (Lfast and Lslow, respectively) for 10 separate fibrils. The pairs of black and gray dots connected by a dotted line correspond to the two ends of each fibril. r represent Pearson’s correlation coefficient and corresponding P-value calculated using a two-sided Student’s t test.
Fig. 5
Fig. 5. Localization of PrP on neurotoxic Aβ assemblies.
Pre-formed ADDLs (a), protofibrils (c), and fibrils (e) (all at 20 µM monomer-equivalent concentration) were incubated with 0.5 µM PrP-AF555 and then imaged by dSTORM. Panels a1, c1, and e1 show boxed areas in (a, c, e), respectively, at higher magnification. Scale bars are 1 µm. Histograms (b, d, f) show the distribution of Dmin/Ltotal values, calculated as in Fig. 4, for ADDLs, protofibrils, and fibrils, respectively. The number of analyzed SIM images in oligomer, protofibrils, and fibrils condition are: X = 6; 10 and 18, respectively.
Fig. 6
Fig. 6. Neurotoxicity assay of Aβ fibrils polymerized in the presence of PrP.
a Schematic representation of a neurotoxicity assay, in which Aβ monomers (5 μM) were polymerized in the presence of PrP (0, 0.1, 0.5, and 1 µM) for 24 h. The resulting fibrils were then either diluted ten-fold directly into neuronal culture medium to give a final Aβ concentration of 500 nM (monomer-equivalents); or they were first incubated for 10 min with additional recombinant PrP to give a total concentration of 5 µM (equimolar to Aβ) before dilution into the culture medium (final PrP concentration of 0.5 µM). Neurons were fixed after 1 h of treatment and stained with Alexa 488-labeled phalloidin to visualize dendritic spines. The schematic was created with BioRender.com. b Confocal image of untreated hippocampal neurons, showing many normal, mushroom-shaped dendritic spines. c Neurons treated with Aβ fibrils polymerized in the presence of 0, 0.1, 0.5, and 1 μM PrP. Inclusion of PrP in the polymerization reaction increases the toxicity of the resulting fibrils, reflected in retraction of dendritic spines. Scale bars 2 μm. d Quantitation of spine number per μm for neurons treated as in (c). Data are presented as mean ± S.E. ***P < 0.001 (two-sided Student’s t-test). The numbers of biological independent samples in each condition is ≥2 and the number of analyzed neurites in control, - PrP, +0.1 µM PrP, +0.5 µM PrP and +1 µM PrP condition are: X = 48, 42, 72, 61, and 76, respectively. e Aβ polymerized in the presence of PrP, as in (c, d), were incubated with extra recombinant PrP (5 µM) before dilution into the neuronal culture medium. Incubation with excess PrP at the end of the polymerization reaction blocks the toxicity of fibrils. f Quantitation of spine number per μm with and without addition of excess recombinant PrP. Data are presented as mean ± S.E. *P < 0.05, **P < 0.01, and ***P < 0.001 (two-sided Student’s t-test). This experiments repeated twice and the number of analyzed neurites in - PrP, +0.1 µM PrP, +0.5 µM PrP and +1 µM PrP condition are: X = 59, 44, 55, and 53, respectively.
Fig. 7
Fig. 7. FcγRIIb and LilrB2 affect the kinetics of Aβ polymerization in a manner similar to PrP.
ThT curves for polymerization of unlabeled Aβ (5 μM) in the presence of increasing concentrations of recombinant PrP (a), FcγRIIb (b), LilrB2 (c) and calmodulin (d). e Effect of receptors on the half-times for Aβ polymerization, derived from the data in (ad). Data represent mean ± S.E. Half-time values that are significantly different from control are indicated: *P < 0.05, **P < 0.01, and ***P < 0.001 (two-sided Student’s t-test). Each curve shown in ad is the average of 3 replicates, and each condition repeated at least 5 times.
Fig. 8
Fig. 8. FcγRIIb and LilrB2 promote formation of shorter, more numerous Aβ fibrils.
Aβ-Cy5 monomer (20 µM) was polymerized for 24 h under control conditions, or in the presence of calmodulin (0.1 and 0.5 µM), FcγRIIb (1, 2, and 5 µM), or LilrB2 (0.2, 1, and 2 µM). ac, gi, and mo show SIM images of the resulting fibrils. Scale bars are 2 µm. d, j, and p show mean fibril length under each condition. e, k, and q show cumulative distributions of fibril length; the insets indicate the number of fibrils larger than 2 µm. f, l, and r show the number of fibrils/μm2. Data represent mean ± S.E. and ***P < 0.001 (two-sided Student’s t-test). n.s., not statistically significant. Numbers of biological independent samples (N) and analyzed images (X) in each condition are: N > 3 and X > 10, respectively.
Fig. 9
Fig. 9. Models for the interaction of receptors with Aβ fibrils, protofibrils, and oligomers.
a Schematic showing primary nucleation and elongation steps in the Aβ polymerization process in the absence (upper pathway) and the presence (lower pathway) of a receptor protein, such as PrPC, FcγRIIb, or LilrB2. The receptor binds to the fast-growing end of the fibril, blocking elongation at that end, and restricting elongation to the slow-growing end. Secondary nucleation events are not depicted. b Interaction of a receptor with neurotoxic oligomers and protofibrils. Receptors bind to one end/edge of these assemblies, possibly recognizing the same structural determinant present at the fast-growing end of fibrils. c Binding of Aβ oligomers and protofibrils to membrane-anchored receptors initiates neurotoxic signaling. Receptors may also trap or concentrate oligomers and protofibrils on the cell surface.

Similar articles

Cited by

References

    1. Jack CR, Jr., et al. NIA-AA Research framework: toward a biological definition of Alzheimer’s disease. Alzheimer’s Dement. 2018;14:535–562. doi: 10.1016/j.jalz.2018.02.018. - DOI - PMC - PubMed
    1. Long JM, Holtzman DM. Alzheimer disease: an update on pathobiology and treatment strategies. Cell. 2019;179:312–339. doi: 10.1016/j.cell.2019.09.001. - DOI - PMC - PubMed
    1. Selkoe, D. J. Alzheimer’s disease. Cold Spring Harb. Perspect. Biol. 3, 10.1101/cshperspect.a004457 (2011). - PMC - PubMed
    1. Serrano-Pozo A, Frosch MP, Masliah E, Hyman BT. Neuropathological alterations in Alzheimer disease. Cold Spring Harb. Perspect. Med. 2011;1:a006189. doi: 10.1101/cshperspect.a006189. - DOI - PMC - PubMed
    1. Shankar GM, et al. Amyloid-beta protein dimers isolated directly from Alzheimer’s brains impair synaptic plasticity and memory. Nat. Med. 2008;14:837–842. doi: 10.1038/nm1782. - DOI - PMC - PubMed

Publication types