. 2021 Jun 8;12(1):3464.
doi: 10.1038/s41467-021-23717-5.

Oncogenic BRAF, unrestrained by TGFβ-receptor signalling, drives right-sided colonic tumorigenesis

Collaborators, Affiliations

Oncogenic BRAF, unrestrained by TGFβ-receptor signalling, drives right-sided colonic tumorigenesis

Joshua D G Leach et al. Nat Commun. .

Abstract

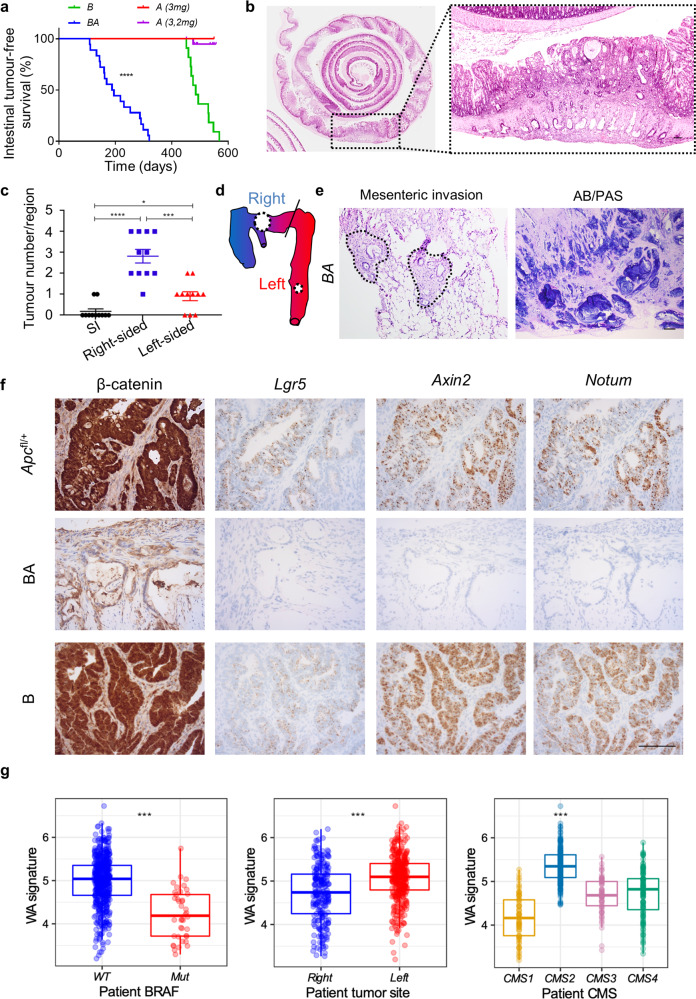
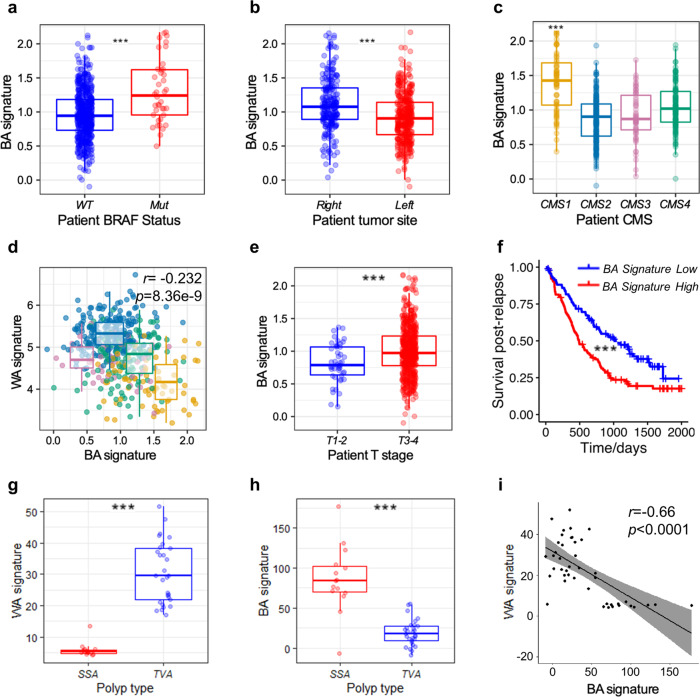
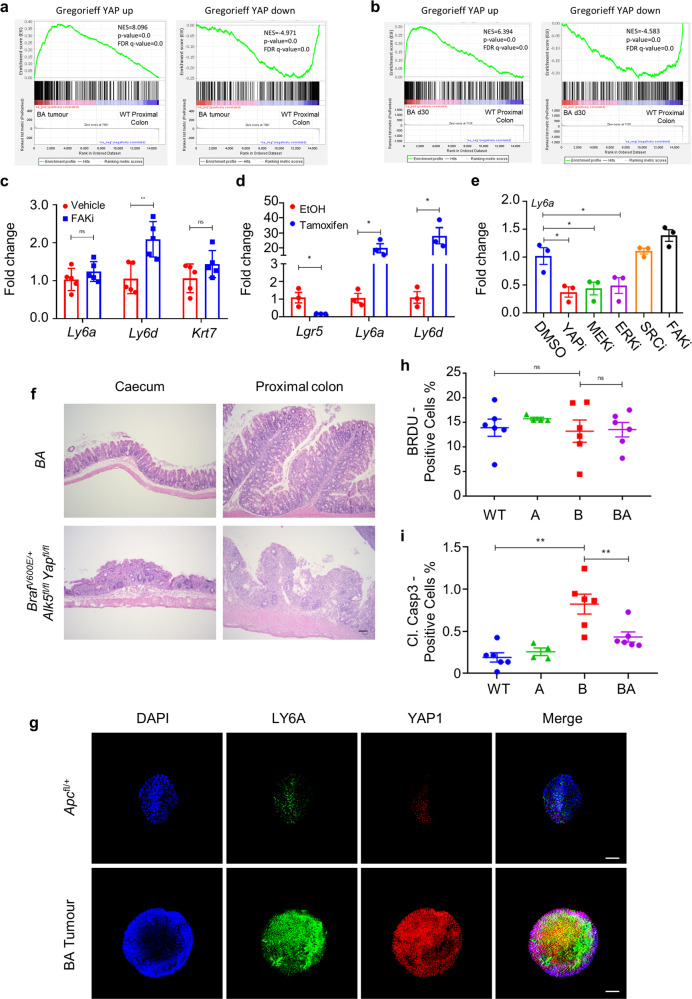
Right-sided (proximal) colorectal cancer (CRC) has a poor prognosis and a distinct mutational profile, characterized by oncogenic BRAF mutations and aberrations in mismatch repair and TGFβ signalling. Here, we describe a mouse model of right-sided colon cancer driven by oncogenic BRAF and loss of epithelial TGFβ-receptor signalling. The proximal colonic tumours that develop in this model exhibit a foetal-like progenitor phenotype (Ly6a/Sca1+) and, importantly, lack expression of Lgr5 and its associated intestinal stem cell signature. These features are recapitulated in human BRAF-mutant, right-sided CRCs and represent fundamental differences between left- and right-sided disease. Microbial-driven inflammation supports the initiation and progression of these tumours with foetal-like characteristics, consistent with their predilection for the microbe-rich right colon and their antibiotic sensitivity. While MAPK-pathway activating mutations drive this foetal-like signature via ERK-dependent activation of the transcriptional coactivator YAP, the same foetal-like transcriptional programs are also initiated by inflammation in a MAPK-independent manner. Importantly, in both contexts, epithelial TGFβ-receptor signalling is instrumental in suppressing the tumorigenic potential of these foetal-like progenitor cells.


Conflict of interest statement

S.T.B. is an employee of AstraZeneca. O.J.S. receives funding from AstraZeneca and Novartis. All other authors declare no conflicts of interest.

Figures

Fig. 1
Fig. 1. Epithelial-specific BrafV600E mutation combines with loss of TGFβ-receptor signalling to drive right-sided tumorigenesis without Wnt-pathway activation.
a Kaplan–Meier survival curves highlighting intestinal tumour-free survival (days after induction) of VillinCreER; BrafV600E/+ (B; n = 11; 3 mg tamoxifen induction), VillinCreER; Alk5fl/fl (A; n = 3; 3 mg tamoxifen induction), and VillinCreER; BrafV600E/+; Alk5fl/fl (BA; n = 18; 2 mg tamoxifen induction) mice. A mice were censored at 550 days post induction (indicated by tick marks on the Kaplan–Meier curve). (****p = 1.835e−7 for comparison of B vs BA; Mantel-Cox log-rank test, two-tailed). b Representative H&E staining of BA mouse colon (n = 8) (Swiss-roll). Right, higher magnification of dashed area in left panel, highlighting the proximal (right-sided) colonic location of adenocarcinomas. Scale bar, 500 μm. c Intestinal tumour location scoring in BA mice (n = 11 mice). Mean ± s.e.m. (*p = 0.0194, ***p = 0.0003, ****p = 8.5e−6; Mann–Whitney U-test, two-tailed). d Schematic representing the tumour distribution in the intestinal tract of BA mice, with circle size proportional to the regional tumour number scored in (c). Blue, caecum, and proximal colon; Red, left colon (descending) to rectum; Diagonal line, splenic flexure. e Representative images of mesenteric invasion, with tumour epithelium highlighted with a dotted outline (H&E; left panel), and mucin staining (Alcian Blue/PAS; right panel) in primary tumour sections from BA mice (n = 5). Scale bar, 500 μm. f Representative tumour sections, from VillinCreER; Apcfl/+, B, and BA mice (n = 5 mice per group), stained for β-catenin (immunohistochemistry) and the Wnt-pathway activation markers Lgr5, Axin2, and Notum (ISH). Scale bar, 100 μm. g Boxplots of the Wnt activation (WA) signature in WT vs BRAF-mutant CRCs from patients, right- vs left-sided CRCs, and across CMS subtypes. Median is shown with boxes which extend from the 25th to the 75th percentile and whiskers which extend an additional 1.5× the interquartile range. Left panel n = 579, middle n = 604 and right n = 467 independent samples (Left and middle panels: ***p < 0.001, T-test, two-tailed; Right panel: ***p < 2e−16, T-test, two tailed).
Fig. 2
Fig. 2. Wnt-low, right-sided tumours express a foetal-like signature, present from early initiation.
a GSEA plots showing enrichment of foetal spheroid and HALLMARK inflammatory response signatures in endpoint BA colonic tumours (n = 4) vs WT proximal colon (n = 3). NES normalised enrichment score, FDR false discovery rate. (p = 0.0, represents p < 0.001 calculated empirically.) b Heatmap showing Z-score-transformed relative expression levels of selected foetal signature genes differentially expressed between endpoint BA intestinal tumours (n = 4) and WT proximal colonic tissue (n = 3). c qRT-PCR of indicated foetal markers in BA intestinal tumours vs WT proximal colon (n = 4 mice per group). Mean ± s.e.m. (*p = 0.0286, compared with WT; Mann–Whitney U-test, two-tailed). d Representative ISH of BA intestinal tumour epithelium stained for foetal markers Ly6a and Anxa1 (n = 5 mice). Scale bar, 100 μm. e GSEA plots showing positive enrichment of the foetal spheroid signature (left panel) and negative enrichment of the Lgr5+ ISC signature (right panel) in BA proximal colonic tissue vs WT control tissue, 30 days post induction (n = 5 per group). NES normalised enrichment score, FDR false discovery rate. (p = 0.0, represents p < 0.001 calculated empirically.) f Heatmap showing Z-score-transformed relative expression levels of selected foetal signature genes in BA proximal colonic tissues (n = 5), compared with WT (n = 4), 30 days post induction. g qRT-PCR of indicated foetal markers in A, B, and BA vs WT proximal colonic tissues, 30 days post induction (n = 4 per group). Mean ± s.e.m. (*p = 0.0286, compared with WT; Mann–Whitney U-test, two-tailed). h Representative ISH of WT and BA proximal colonic tissue, stained for foetal markers Ly6a and Anxa1, 30 days post induction (n = 5 per group). Scale bar, 100 μm.
Fig. 3
Fig. 3. Poor-prognosis BRAF-mutant, right-sided patient CRCs are Wnt-low and express the BA signature from inception.
a Boxplot showing expression of the BA signature in WT vs BRAF-mutant CRCs from patients (n = 579). Median is shown with boxes, which extend from the 25th to the 75th percentile and whiskers which extend an additional 1.5× the interquartile range (***p = 3.58e−5; T-test, two-tailed). b Boxplot showing expression of the BA signature of right- vs left-sided CRCs from patients (n = 604). Median is shown with boxes, which extend from the 25th to the 75th percentile and whiskers which extend an additional 1.5× the interquartile range (***p = 1.28e−9; T-test, two-tailed). c Boxplot showing expression of the BA signature across CMS subtypes (n = 461). Median is shown with boxes, which extend from the 25th to the 75th percentile and whiskers which extend an additional 1.5x the interquartile range (***p = 2.16e−13; T-test, two-tailed). d Scatter plot of WA and BA signature values from human tumours showing a negative correlation (Pearson’s r = −0.232, p = 8.36e−9, two-sided) (n = 467). CMS plots are overlain highlighting the differential expression of the signatures between CMS1 and CMS2 subtypes. CMS1 (MSI-high, immune): orange; CMS2 (canonical Wnt signalling): blue; CMS3 (metabolic dysregulation): pink; CMS4 (mesenchymal): green. Median is shown with boxes, which extend from the 25th to the 75th percentile and whiskers which extend an additional 1.5x the interquartile range. e Expression of the BA signature is higher in T3–4 human tumours than T1–2 (***p = 0.0002; T-test, two-tailed) (n = 604). Median is shown with boxes, which extend from the 25th to the 75th percentile and whiskers which extend an additional 1.5× the interquartile range. f Patients with BA signature-high tumours (red), defined as above the median value, have shorter survival after relapse compared with those harbouring BA signature-low tumours (blue) (***p = 0.00016; Wald test, two-tailed) (n = 197). g Expression of the WA signature is higher in tubulovillous adenomas (TVA) (n = 29) than sessile serrated adenomas (SSA) (n = 15) (***p = 1.538e−05; T-test, two-tailed). Median is shown with boxes, which extend from the 25th to the 75th percentile and whiskers which extend an additional 1.5× the interquartile range. h Expression of the BA signature is higher in sessile serrated adenomas (SSA) than tubulovillous adenomas (TVA) (***p = 1.498e−05; T-test, two-tailed). Median is shown with boxes, which extend from the 25th to the 75th percentile and whiskers which extend an additional 1.5× the interquartile range. i Higher values of the BA signature are significantly associated with lower expression values of the WA signature in pooled TVA/SSA human precancerous lesions (Pearson’s r = −0.66, p = 1.11e−06). The regression line is presented with 95% confidence intervals (shaded area).
Fig. 4
Fig. 4. BRAFV600E drives foetal-like differentiation via YAP activation, underpinning cell viability in the proximal colon.
a GSEA plots showing enrichment of YAP up- and down-regulated gene signatures in endpoint BA tumours (n = 4) vs WT proximal colon (n = 3). NES normalised enrichment score, FDR false discovery rate. (p = 0.0, represents p < 0.001 calculated empirically.) b GSEA plots showing positive enrichment of YAP up- and down-regulated gene signatures in BA proximal colonic tissue vs WT control tissue, 30 days post induction (n = 5 per group). NES normalised enrichment score, FDR false discovery rate. (p = 0.0, represents p < 0.001 calculated empirically.) c qRT-PCR of indicated foetal markers in proximal colonic tissue from vehicle- and FAKi-(VS-4718)-treated BA mice, 30 days post induction (n = 5 mice per treatment). Mean ± s.e.m. (ns not significant; **p = 0.0079; Mann–Whitney U-test, two-tailed). d qRT-PCR of Lgr5 and indicated foetal markers in BA organoids, induced in vitro with 4-hydroxytamoxifen and sampled 5 days post induction (n = 3 organoid lines from 3 separate uninduced BA mice). Fold change is shown relative to uninduced organoids (EtOH-treated). Mean ± s.e.m. (*p = 0.05; Mann–Whitney U-test, two-tailed). e qRT-PCR of Ly6a in BA organoids, induced in vitro with 4-hydroxytamoxifen and sampled 48 h post drug-treatment, 5 days post induction. Drugs were reconstituted in DMSO vehicle (0.1%) at the indicated final concentrations: verteporfin (YAPi; 3 μM), AZD6244 (MEKi; 100 nM), ERKi (100 nM), eCF506 (SRCi; 50 nM), and VS-4718 (FAKi; 1 μM). n = 3 organoid lines from 3 separate uninduced BA mice. Fold change is shown relative to DMSO-treated, induced organoids. Mean ± s.e.m. (*p = 0.05; Mann–Whitney U-test, two-tailed). f Representative H&E-staining of the proximal colon and caecum from BrafV600E/+ Alk5fl/fl Yapfl/fl mice 6 days post induction, highlighting severe epithelial loss and necrosis compared with BA controls (n = 5 mice per group). Scale bar, 500 μm. g Immunofluorescent staining of Matrigel ENRW-cultured BA and VillinCre; Apcfl/+ tumour spheroids for SCA1/LY6A (green) and YAP1 (red). Nuclei were counterstained with DAPI (blue). Merged images are shown on the right. Representative images of n = 3 biological replicates. Scale bar, 100 μm. h Image analysis scoring of the percentage of BrdU+ cells in the proximal colon epithelium of WT (n = 6), A (n = 4), B (n = 6), and BA (n = 6) mice, 30 days post induction. Mean ± s.e.m. (ns not significant; Mann–Whitney U-test, two-tailed). i Image analysis scoring of percentage of cleaved caspase 3+ cells in the proximal colon epithelium of WT (n = 6), A (n = 4), B (n = 6), and BA (n = 6) mice, 30 days post induction. Mean ± s.e.m. (**p = 0.0076, Mann–Whitney U-test, two-tailed).
Fig. 5
Fig. 5. Inflammation and epithelial TGFβ-receptor loss cooperate in the formation of foetal-like tumours.
a Kaplan–Meier survival curves highlighting tumour-free survival (days after tamoxifen-induction) of vehicle-treated (n = 28) and antibiotic-treated (n = 28) BA mice (***p = 0.0006; Mantel-Cox log-rank test, two-tailed). b Total number of intestinal tumours in vehicle-treated (n = 28) and antibiotic-treated (n = 28) BA mice. Mean ± s.e.m. (****p = 2.9e−7; Mann–Whitney U-test, two-tailed). c qRT-PCR of indicated foetal markers in proximal colonic tissue from vehicle- and antibiotic-treated BA mice, 30 days post induction (n = 4 mice per treatment). Fold change is shown relative to vehicle-treated BA mice Mean ± s.e.m. (*p = 0.0286; Mann–Whitney U-test, two-tailed). d Kaplan–Meier survival curves highlighting survival (days after induction) of sulindac-treated A (n = 5) and B (n = 3) mice. e Intestinal tumour location scoring of sulindac-treated A mice (n = 5). Mean ± s.e.m. (ns not significant; *p = 0.0397, **p = 0.0079; Mann–Whitney U-test, two-tailed). f Representative ISH of sulindac-treated A proximal colonic tumours, stained for foetal markers Ly6a and Anxa1 (n = 5 mice). Scale bar, 100 μm. g GSEA plots of RNA-seq data from sulindac-treated A vs WT proximal colonic tissues, 30 days post induction, using the foetal spheroid (left panel) and Lgr5+ ISC (right panel) gene signatures (n = 4 mice per group). NES normalised enrichment score, FDR false discovery rate. (Left panel—p = 0.0, represents p < 0.001, Right panel—p = 0.008, calculated empirically.) h qRT-PCR of indicated foetal markers in proximal colonic tissue from sulindac-treated A mice vs WT counterparts, 30 days post induction (n = 4 mice per group). Fold change is shown relative to untreated WT mice. Mean ± s.e.m. (*p = 0.0286; Mann–Whitney U-test, two-tailed).

References

    1. Minoo, P. Characterization of rectal, proximal and distal colon cancers based on clinicopathological, molecular and protein profiles. Int. J. Oncol.37, 707–718 (2010). - PubMed
    1. Stintzing S, Tejpar S, Gibbs P, Thiebach L, Lenz H-J. Understanding the role of primary tumour localisation in colorectal cancer treatment and outcomes. Eur. J. Cancer. 2017;84:69–80. doi: 10.1016/j.ejca.2017.07.016. - DOI - PMC - PubMed
    1. Baran B, et al. Difference between left-sided and right-sided colorectal cancer: a focused review of literature. Gastroenterol. Res. 2018;11:264–273. doi: 10.14740/gr1062w. - DOI - PMC - PubMed
    1. Fearon ER, Vogelstein B. A genetic model for colorectal tumorigenesis. Cell. 1990;61:759–767. - PubMed
    1. Muzny DM, et al. Comprehensive molecular characterization of human colon and rectal cancer. Nature. 2012;487:330–337. doi: 10.1038/nature11252. - DOI - PMC - PubMed

Publication types

MeSH terms

Substances