. 2021 Jun 8;12(1):3418.
doi: 10.1038/s41467-021-23745-1.

Moderate levels of 5-fluorocytosine cause the emergence of high frequency resistance in cryptococci

Affiliations

Moderate levels of 5-fluorocytosine cause the emergence of high frequency resistance in cryptococci

Yun C Chang et al. Nat Commun. .

Abstract

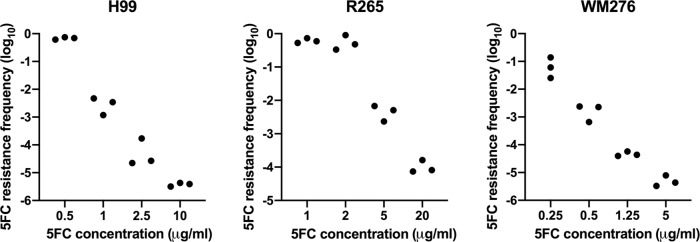
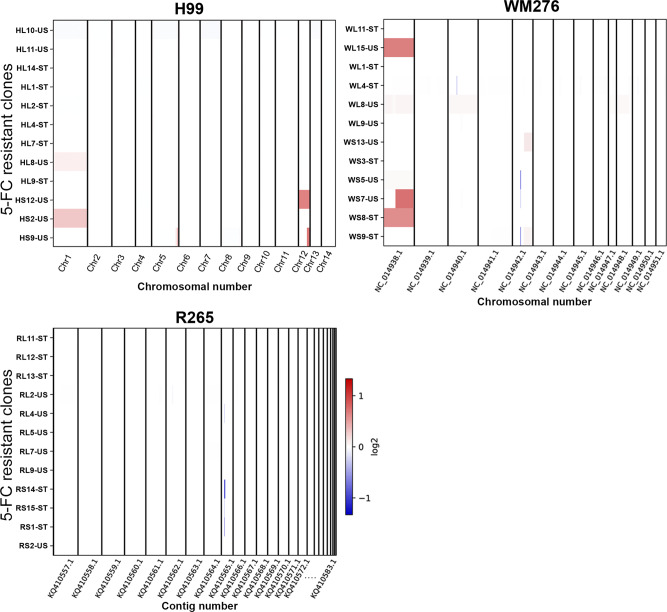
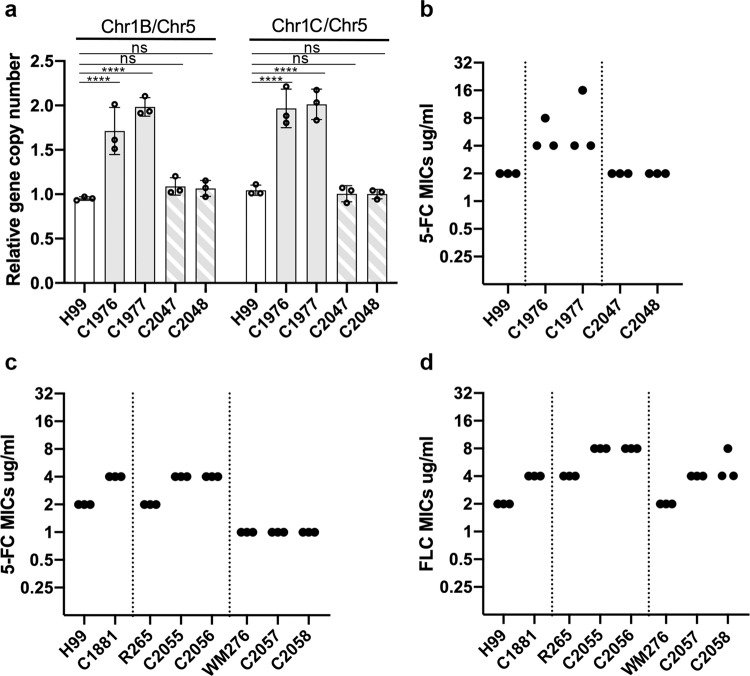
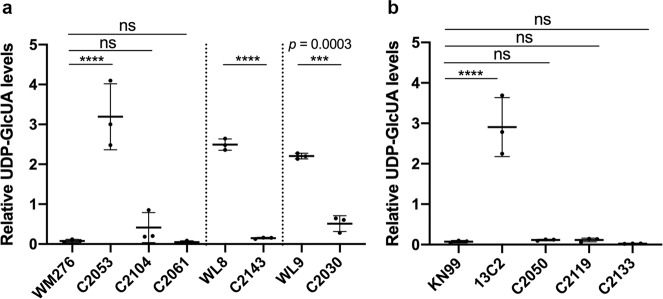
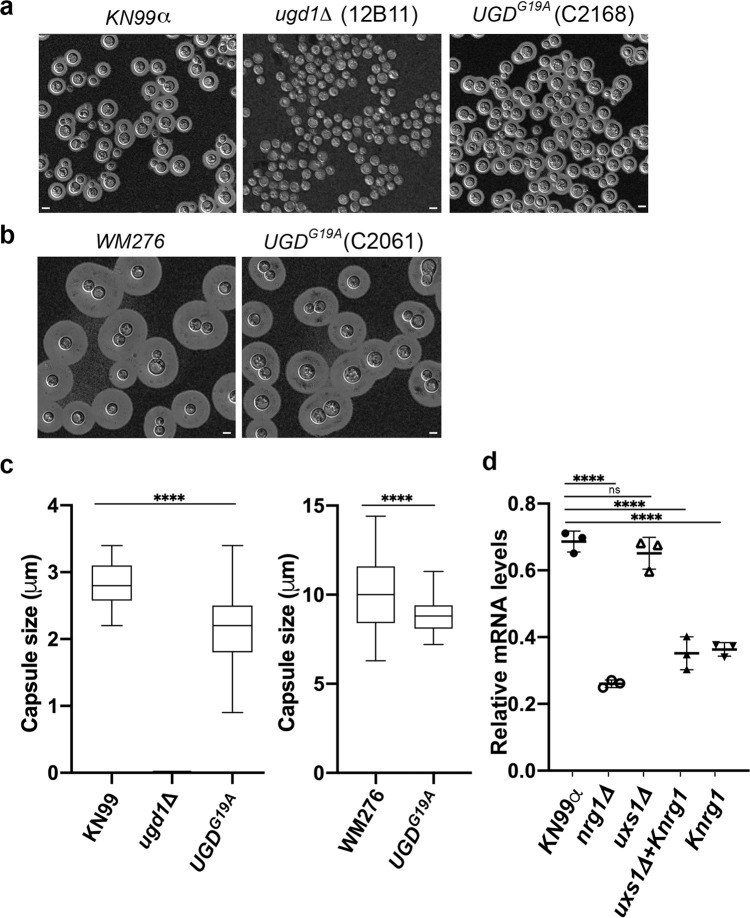
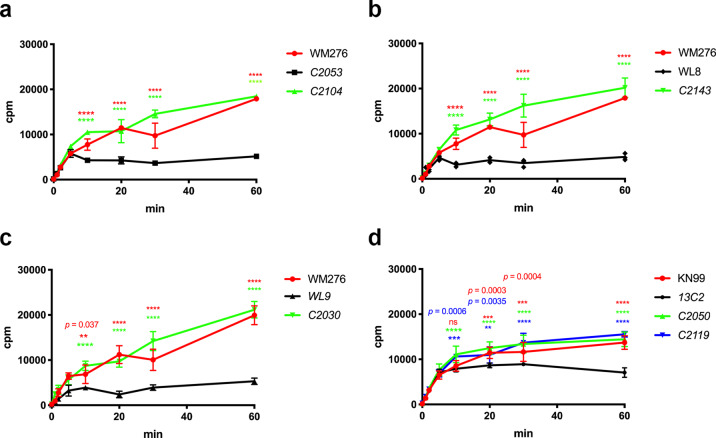
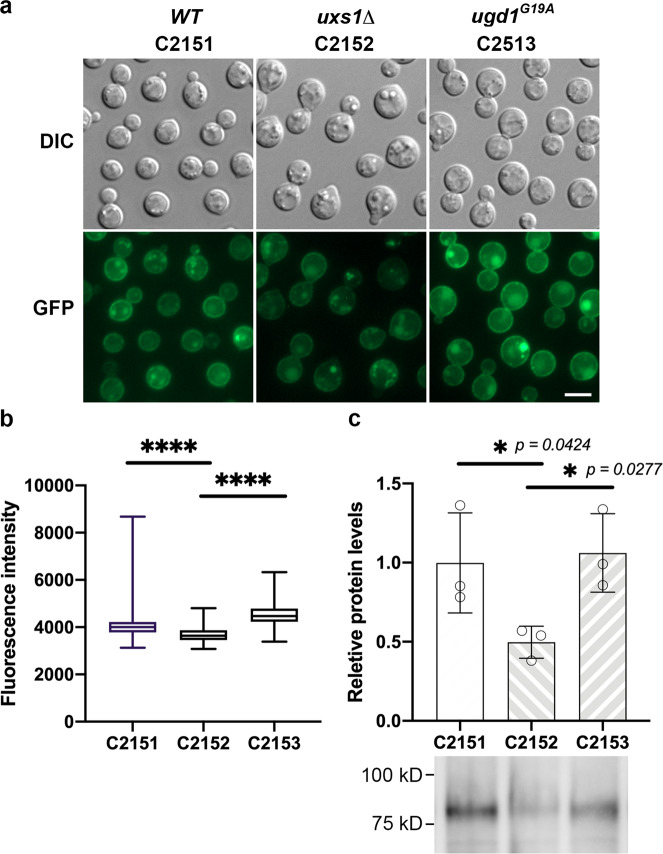
The antifungal agent 5-fluorocytosine (5-FC) is used for the treatment of several mycoses, but is unsuitable for monotherapy due to the rapid development of resistance. Here, we show that cryptococci develop resistance to 5-FC at a high frequency when exposed to concentrations several fold above the minimal inhibitory concentration. The genomes of resistant clones contain alterations in genes relevant as well as irrelevant for 5-FC resistance, suggesting that 5-FC may be mutagenic at moderate concentrations. Mutations in FCY2 (encoding a known permease for 5-FC uptake), FCY1, FUR1, UXS1 (encoding an enzyme that converts UDP-glucuronic acid to UDP-xylose) and URA6 contribute to 5-FC resistance. The uxs1 mutants accumulate UDP-glucuronic acid, which appears to down-regulate expression of permease FCY2 and reduce cellular uptake of the drug. Additional mutations in genes known to be required for UDP-glucuronic acid synthesis (UGD1) or a transcriptional factor NRG1 suppress UDP-glucuronic acid accumulation and 5-FC resistance in the uxs1 mutants.


Conflict of interest statement

The authors declare no competing interests.

Figures

Fig. 1
Fig. 1. The frequency of 5-FC resistance varies according to 5-FC concentrations.
Cells from H99, R265, and WM276 were plated on YNB media supplemented with indicated amounts of 5-FC which were approximately corresponding to 20-, 40-, 100-, and 400-fold of 5-FC MIC of each tested strain. Plates were incubated at 30 °C for 7 days and photographed. The frequency of 5-FC resistance was calculated by dividing the number of the 5-FC resistant colonies by the total number of the input cells. The experiments were repeated three times.
Fig. 2
Fig. 2. Chromosome copy number analysis.
The genomic sequences of twelve 5-FC resistant clones each from H99, R265, and WM276 were determined, and the copy number of each chromosome was calculated. The change of copy number is represented by the intensity of the color. The red color represents copy gain and blue color represents copy loss in units of log2 as shown by the color scale. The color bar represents the location of copy number change in the chromosome. The name of chromosome or contig is indicated at the bottom of each panel and the width of the column represents the size of chromosome or contig. The name of each clone is on the left side of each panel. The “L” and “S” in the name represent the size of the colony at the time of its isolation and ST and US in the suffix indicates the stability of each 5-FC resistant clone as either stable or unstable, respectively.
Fig. 3
Fig. 3. Chr1 duplication and extra copy of AFR1 affects the 5-FC resistance levels.
a Relative copy number of genes resided on chr1. Probes specific for the genes resided on the left or right arms of chr1 (Chr1B or Chr1C) were chosen to assess the changes in chr1 copy number. The PCR results of the chr1-specific probes were compared to that of chr5, which served as unduplicated internal control in the indicated strains. Data are presented as mean values ± standard deviation from three biological repeats of each strain. Two-way ANOVA with Tukey’s test for multiple comparisons (ns = not significant, **** = p < 0.0001). b Broth 5-FC MIC of the strains containing duplicated chr1 and the strains after repeated transfers which lost the duplicated chr1. c Broth 5-FC MIC of the strains containing extra copies of AFR1. d Broth fluconazole MIC of the strains containing extra copies of AFR1. The MIC determination was repeated three times for each strain.
Fig. 4
Fig. 4. Growth rate is different between the uxs1 suppressor strains in C. neoformans and C. gattii.
The doubling time of indicated strain is determined using a plate reader. a C1933 is a 5-FC sensitive strain derived from repeated transfers of WL8. b C1943 is a 5-FC sensitive strain derived from repeated transfers of WL9. C2030 is a strain containing UGD1G19A that was manually introduced into WL9. c C1952 is a 5-FC sensitive strain derived from repeated transfers of 13C2. C2050 and C2119 are suppressor strains obtained by molecular manipulations which contained Knrg1 and UGDG19A, respectively. The experiments were repeated at least three times (n ≥ 21) and data are presented as mean values ± standard deviation. One-way ANOVA with Tukey’s test for multiple comparisons (ns = not significant, and ****p < 0.0001).
Fig. 5
Fig. 5. The levels of UDP-glucuronic acid are high in the uxs1 mutants and low in the suppressor strains.
Nucleotide sugars were analyzed as described under “Methods”. Relative amounts of UDP-glucuronic acid were determined in strains derived from WM276 (a) and KN99α (b). The experiments were repeated three times and data are presented as mean values ± standard deviation. One-way ANOVA with Tukey’s test for multiple comparisons (ns = not significant, ***p < 0.0002, and ****p < 0.0001).
Fig. 6
Fig. 6. The Ugd1 function or the UGD1 expression levels is affected in suppressor containing strains.
ac Capsule size is affected by the UGD1G19A mutation. Cells were stained by India ink and visualized by microscopy. The experiments were repeated 4 times independently with similar results. The capsule sizes of more than 65 cells were measured from 5 different fields for each indicated strain. Capsular thickness was defined as the distance between the visualized cell wall and the edge of the capsule. The box-and-whiskers plot is used to show median, quartiles (boxes), and range (whiskers). Two-tailed, unpaired t-test (****p < 0.0001). Bar = 5 μm. d UGD1 expression is downregulated in the Knrg1 containing strains. RNA was isolated and the expression levels of UGD1 were determined by qRT-PCR, normalized to the actin gene. The experiments were repeated three times. One-way ANOVA with Tukey’s test for multiple comparisons (ns = not significant and ****p < 0.0001).
Fig. 7
Fig. 7. The accumulation of [3H] 5-FC is low in the uxs1 mutants and high in the suppressor strains.
Cells were incubated with [3H]-flucytosine and the accumulation of [3H]-flucytosine was determined at indicated time. The experiments were repeated three times and data are presented as mean values ± standard deviation. Each panel contains the wild type, the uxs1 mutant and the suppressor strains derived from WM276 (a), WL8 (b), WL9 (c) and KN99α (d). Two-way ANOVA with Tukey’s multiple comparisons test was used to compare the differences at the indicated time point between the uxs1 mutant and the wild type or between the uxs1 mutant and the suppressor strain (ns = not significant, **p < 0.0021, ***p < 0.0002, and ****p < 0.0001).
Fig. 8
Fig. 8. Fcy2 protein levels are low in uxs1 mutants and high in the suppressor strains.
a The localization of Fcy2 in the indicated strains was visualized by microscopy and photographed. Bar = 5 μm. b The mean fluorescence intensity of each strain from (a) were quantified from three separate images. The box-and-whiskers plot is used to show median, quartiles (boxes), and range (whiskers). One-way ANOVA with Tukey’s test for multiple comparisons (****p < 0.0001). c The relative amounts of the FLAG tagged Fcy2 was analyzed by western blot (bottom) and the expression levels of Fcy2 were quantified by measuring the band intensity in the western blots, normalized to that of the total protein from stain-free blot and compared to the expression levels in C2151. For the full scan blots, see the Source data file. Data are presented as mean values ± standard deviation from three biological repeats. One-way ANOVA with Tukey’s test for multiple comparisons (*p < 0.0332 and ****p < 0.0001).

References

    1. Duschinsky R, Pleven E, Heidelberger C. The synthesis of 5-fluoropyrimidines. J. Am. Chem. Soc. 1957;79:4559–4560. doi: 10.1021/ja01573a087. - DOI
    1. Polak A, Grenson M. Evidence for a common transport system for cytosine, adenine and hypoxanthine in Saccharomyces cerevisiae and Candida albicans. Eur. J. Biochem. 1973;32:276–282. doi: 10.1111/j.1432-1033.1973.tb02608.x. - DOI - PubMed
    1. Paluszynski JP, Klassen R, Rohe M, Meinhardt F. Various cytosine/adenine permease homologues are involved in the toxicity of 5-fluorocytosine in Saccharomyces cerevisiae. Yeast. 2006;23:707–715. doi: 10.1002/yea.1387. - DOI - PubMed
    1. Edlind TD, Katiyar SK. Mutational analysis of flucytosine resistance in Candida glabrata. Antimicrob. Agents Chemother. 2010;54:4733–4738. doi: 10.1128/AAC.00605-10. - DOI - PMC - PubMed
    1. Ghannoum MA, Rice LB. Antifungal agents: mode of action, mechanisms of resistance, and correlation of these mechanisms with bacterial resistance. Clin. Microbiol Rev. 1999;12:501–517. doi: 10.1128/CMR.12.4.501. - DOI - PMC - PubMed

Publication types

MeSH terms