Clinical Trial
. 2021 Jun 8;12(1):3427.
doi: 10.1038/s41467-021-23748-y.

Bladder cancer therapy using a conformationally fluid tumoricidal peptide complex

Affiliations
Clinical Trial

Bladder cancer therapy using a conformationally fluid tumoricidal peptide complex

Antonín Brisuda et al. Nat Commun. .

Abstract

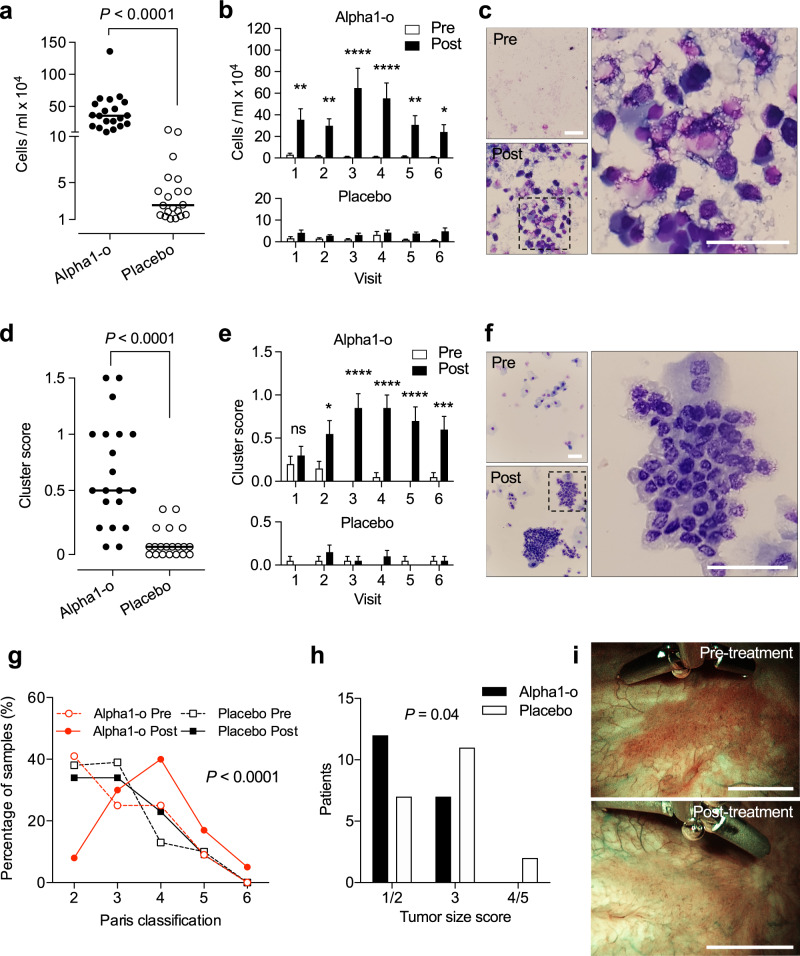
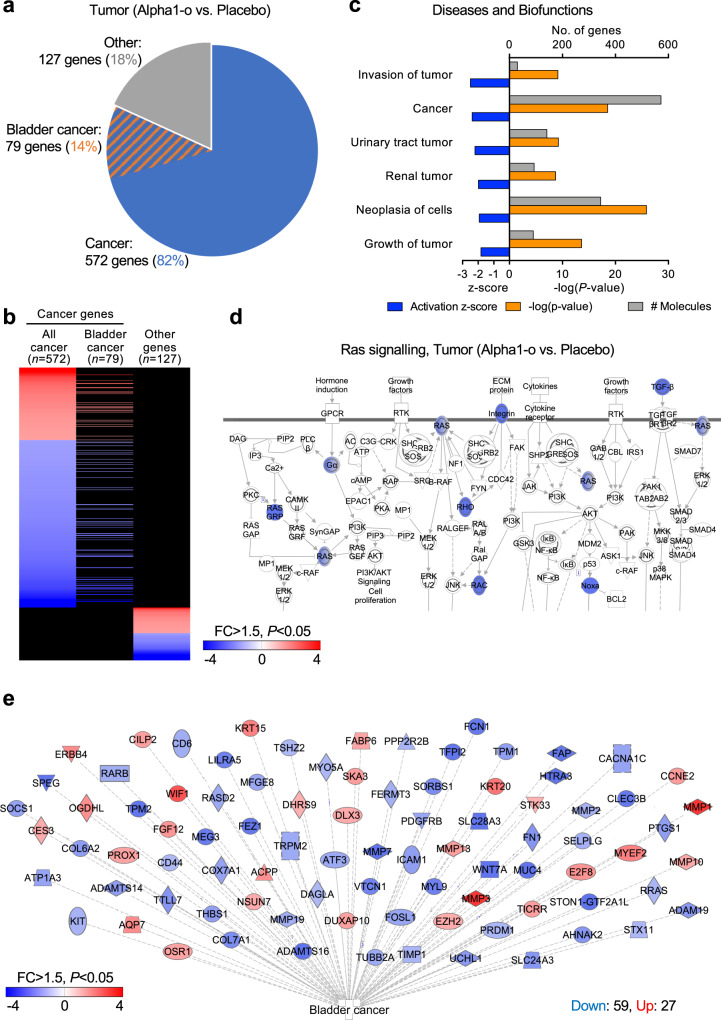
Partially unfolded alpha-lactalbumin forms the oleic acid complex HAMLET, with potent tumoricidal activity. Here we define a peptide-based molecular approach for targeting and killing tumor cells, and evidence of its clinical potential (ClinicalTrials.gov NCT03560479). A 39-residue alpha-helical peptide from alpha-lactalbumin is shown to gain lethality for tumor cells by forming oleic acid complexes (alpha1-oleate). Nuclear magnetic resonance measurements and computational simulations reveal a lipid core surrounded by conformationally fluid, alpha-helical peptide motifs. In a single center, placebo controlled, double blinded Phase I/II interventional clinical trial of non-muscle invasive bladder cancer, all primary end points of safety and efficacy of alpha1-oleate treatment are reached, as evaluated in an interim analysis. Intra-vesical instillations of alpha1-oleate triggers massive shedding of tumor cells and the tumor size is reduced but no drug-related side effects are detected (primary endpoints). Shed cells contain alpha1-oleate, treated tumors show evidence of apoptosis and the expression of cancer-related genes is inhibited (secondary endpoints). The results are especially encouraging for bladder cancer, where therapeutic failures and high recurrence rates create a great, unmet medical need.


Conflict of interest statement

C.S. holds shares in HAMLET Pharma, as a representative of scientists in the HAMLET group. Patents protecting the use of the alpha1 peptide were filed previously (Biologically active complexes and therapeutic uses thereof; GB 201707715 priority date 14/05/2017, PCT/EP2018/062396 filing date 14/05/2018; inventors: C.S., A.N., J.Ho). No specific patents have been filed based on this study. Other authors declare no competing or conflicts of interests.

Figures

Fig. 1
Fig. 1. Tumoricidal activity of two non-homologous alpha-helical peptide–oleate complexes.
a Ribbon representation of the crystallographically determined three-dimensional structure of human α-lactalbumin (PDB ID: 1B9O), indicating the alpha1 (blue), beta (green), and alpha2 (gray) domains. The calcium ion is not shown. b Far-UV circular dichroism spectra of synthetic alpha1 peptide, beta peptide, and their respective peptide–oleate complexes. c, d Death response in human lung (A549), kidney (A498), and murine bladder (MB49) carcinoma cells, quantified as a reduction in ATP levels (c, P = 3.26E−5 for A549, 0.013 for A498 and 0.005 for MB49, alpha1–oleate compared to beta–oleate) or PrestoBlue fluorescence (d, P = 0.007 for A549, 0.003 for A498 and 0.002 for MB49, alpha1–oleate compared to beta–oleate). Cells were treated with the alpha1–oleate complex (blue) or the beta–oleate complex (green), (3 h, 35 μM, cell death compared to PBS controls). For controls exposed to the naked peptides or oleate alone, see Supplementary Fig. 1d. e Colony assay showing dose-dependent long-term effects of alpha1-oleate. A representative image is shown from two independent experiments. Scale bar = 5 mm. f Alpha1–oleate triggers rapid membrane blebbing in A549 lung carcinoma cells (35 μM, 10 min). Scale bar = 10 μm. A representative image is shown from three independent experiments. g K+ efflux in A549 lung carcinoma cells exposed to alpha1–oleate and inhibition with BaCl2. h Inhibition of cell death by the ion flux inhibitors Amiloride and BaCl2 (100 μM), measured by PrestoBlue fluorescence (P = 0.031 for 21 μM + BaCl2, 0.005 for 21 μM + Amiloride, 0.028 for 35 μM + BaCl2, and 0.014 for 35 μM + Amiloride, compared to no inhibitor). i DNA strand breaks detected by TUNEL staining in alpha1–oleate-treated A549 lung carcinoma cells (n = 50 cells per group). Scale bar = 20 μm. j AlexaFluor568-labeled alpha1–oleate (red) is internalized by A549 lung carcinoma cells. Nuclei are counterstained with DAPI (blue) (n = 52 cells per group). Scale bar = 10 μm. Data are presented as mean ± SEM from three independent experiments, *P < 0.05, **P < 0.01, ***P < 0.001, analyzed by two-tailed unpaired t-test (c, d, h, j) and 2-way ANOVA using Dunnett’s correction (i).
Fig. 2
Fig. 2. Biomolecular NMR analysis of naked alpha1- and sar1alpha peptides and their oleate complexes.
a, b One-dimensional 1H NMR spectra. The naked alpha1- (a, black) and sar1alpha- (b, black) peptides assume an ensemble of structures that interconvert rapidly and are therefore seen as sharp peaks. The alpha1–oleate (a, red) and sar1alpha–oleate complexes (b, red) show broader peaks. Arrows indicate the indole 1H signals arising from the three Trp side chains present in the sar1alpha peptide. c, d Two-dimensional 1H NOESY spectra of alpha1–oleate and sar1alpha–oleate complexes, showing atomic-level proximities of the fatty acid to the respective peptide. The spectra highlight NOEs between the 9,10 olefinic protons (5.23 ppm) of oleic acid with the Hα protons and aromatic protons of the alpha1–oleate complex (c) and the sar1alpha–oleate complex (d). e, f Two-dimensional 1H–13C Heteronuclear Single Quantum Coherence (HSQC) spectra overlays of the alpha1 peptide (red) and alpha1-oleate complex (black). Chemical shift perturbation is detected in the aromatic side-chain region and the imidazole ring protons (e, green circled regions), and in the aliphatic side chain regions (f). g Size-exclusion HPLC (SE-HPLC) of the alpha1 peptide and the alpha1–oleate complex, mapped onto a standard calibration curve. h Diffusion-ordered NMR spectroscopy (DOSY) of the alpha1 peptide, alpha1–oleate complex, human serum albumin (HSA), and oleate suspension.
Fig. 3
Fig. 3. Free energy surface analyses of the peptide- and peptide–oleate system.
a, b Superimposition of dihedral principal component analysis (PCA) plots of alpha1 (black points) and alpha1–oleate (red points) systems (a), and sar1alpha (cyan points) and sar1alpha–oleate (magenta points) systems (b). Principal component (PC)1 and PC2 represent the axes of the two greatest variances after mathematical transformation for dimension reduction. cf Free-energy surfaces as a function of the first two principal components for alpha1–oleate (c), naked alpha1 (d), sar1alpha–oleate (e), and naked sar1alpha (f). The representative structures of peptides or peptide–oleate complexes, along with their respective local minima annotations, are colored from the N termini (blue) to the C termini (orange/brown). The free-energy surface of the alpha1–oleate complex contains 2 minima basins, A1 and B1, with A1 representing the major conformational ensemble. The free-energy surface of the sar1alpha–oleate complex contains 3 minima basins, A3, B3, and C3 (with the A3 basin harboring the major structural ensemble), which are characterized by a prominent alpha-helical secondary structural element, as shown from simulation calculated alpha-helical propensities. By contrast, the free-energy surface of the naked sar1alpha shows large structural heterogeneity. Here, minima basins A4 and D4 are represented by helical structures, B4 by beta structure, and C4 and E4 by random coil structures.
Fig. 4
Fig. 4. Clinical study protocol, demographic data, and adverse events.
a Study CONSORT diagram. b Study protocol. After diagnosis and informed consent, the subjects received intravesical instillations of either alpha1–oleate or placebo on six occasions during one month preceding a scheduled transurethral resection (TURB). A safety follow-up was performed 52 days after the first instillation. c Number of adverse events (AEs) in the active and placebo groups. No drug-related adverse events were recorded. There were totally 29 AEs reported by 12 subjects in the active group and by 11 subjects in the placebo group. None of the AEs were related to the investigational product. One AE was severe and two were moderate in the placebo group. The active group had one moderate AE. Two subjects in the placebo group reported severe AE (SAEs). The AEs were evaluated descriptively, and the AE profiles were similar between the placebo and the active groups.
Fig. 5
Fig. 5. Primary endpoints: shedding of tumor cells and reduction in tumor size following intra-vesical instillation of alpha1–oleate.
ac Cell shedding increased significantly after alpha1–oleate instillation. a Scatterplot showing individual means of six visits per patient in the treatment group (n = 20) compared to patients receiving placebo (n = 20). Line represents the median. b Comparison of cell numbers in urine before (pre = white) and after (post = black) alpha1–oleate inoculation on visits 1–6 showing increased cell numbers post-inoculation in the treatment group (n = 20 patients per group, P = 0.0030 for visit 1, 0.0098 for visit 2, <0.0001 for visits 3 and 4, 0.0073 for visit 5 and 0.0336 for visit 6) but not in the placebo group. Data are presented as mean ± SEM. c Representative images, illustrating the increase in cell shedding after alpha1–oleate instillation. Magnification = ×400. Scale bar = 50 μm. df Difference in the shedding of tumor cell clusters between the treatment and placebo group. d Scatterplot showing individual means of six visits per patient in the treatment group compared to patients receiving placebo. Line represents the median. e Increased numbers of cell clusters in post-inoculation samples of patients receiving alpha1–oleate (n = 20 patients per group, P = 0.9743 for visit 1, 0.0212 for visit 2, <0.0001 for visits 3, 4, and 5, and 0.0005 for visit 6). Data are presented as mean ± SEM. f Representative images of cancer cell clusters after alpha1–oleate instillation. Magnification = ×400. Scale bar = 50 μm. g Paris grade of shed cells before or after alpha1–oleate instillation. An increase is observed in the treatment group (χ2 test). h Reduction in tumor size in patients receiving alpha1–oleate treatment. Images were compared between the time of diagnosis and the time of TURB (P = 0.04, χ2 test for trend compared to placebo, n = 19 for treatment group and n = 20 for placebo group). i Examples of cystoscopy photographs obtained by A.B. at the time of diagnosis and after treatment at the time of TURB. Scale bars = 5 mm. *P < 0.05, **P < 0.01, ***P < 0.001, ****P < 0.0001. The data were analyzed by two-tailed unpaired Mann–Whitney U-test (a, d) or by repeated-measures two-way ANOVA with Sidak’s correction (b, e).
Fig. 6
Fig. 6. Apoptotic response to alpha1–oleate and cellular uptake by tumor cells.
Apoptosis was quantified in tumor biopsies, using the TUNEL assay. Arbitrary units were calculated after subtraction of background staining in TUNEL negative healthy tissue samples. a Representative image of TUNEL staining (green = TUNEL, blue = DAPI) in tumor tissue from individual patients receiving alpha1–oleate instillations. Scale bars = 200 μm. b Representative images of TUNEL staining in tumor tissue from individual patients receiving placebo. Scale bars = 200 μm. c Scatter plot demonstrating elevated TUNEL staining intensity in tumor biopsies from patients receiving alpha1–oleate instillations compared to placebo. TUNEL staining was not significantly altered in healthy tissue biopsies from patients receiving alpha1–oleate instillations or placebo (n = 40 tumors and 38 healthy biopsies, two data points were further removed due to medical conditions from patients and confirmed by Grubbs’s outlier test) (two-tailed unpaired Mann–Whitney U-test). Line represents the median. d Correlation of TUNEL staining intensity with cell shedding (P = 0.03, 95% CI 0.0220– 0.6010) and alpha1–oleate uptake (P = 0.01, 95% CI 0.0957–0.6461) (Spearman correlation, two-tailed, approximate P-value, n = 20 for alpha1–o and n = 19 for placebo). e Representative images of alpha1–oleate (red) uptake with counter-stained nuclei (blue). Alpha1–oleate uptake by tumor cells was quantified by staining of shed cells in urine with polyclonal anti-alpha1–oleate antibodies. Scale bars = 20 μm. f Scatterplots of cellular uptake in individual patients receiving alpha1–oleate. Each dot represents the mean fluorescence intensity of six post-instillation samples per patient treated with alpha1–oleate. Comparison of alpha1–oleate uptake by the cell in urine before (pre = white) and after (post = black) alpha1–oleate inoculation on visits 1-6 (repeated-measures two-way ANOVA with Sidak’s correction, P = 0.0049 for visit 1, 0.1913 for visit 2, 0.0067 for visit 3, 0.0025 for visit 4, 0.3807 for visit 5 and 0.0043 for visit 6, n = 20 per group and time point). Line represents the median and bars represent mean ± SEM.
Fig. 7
Fig. 7. Reprogramming of gene expression.
RNA sequencing was used to compare gene expression profiles in tumor tissue biopsies from the treatment or placebo groups. a Pie chart of genes regulated in response to treatment (cut-off FC > 1.5, P < 0.05 compared to the placebo group). In the treatment group, 82% of all regulated genes were cancer-related and 14% were bladder cancer-related. Gene categories were identified by biofunction analysis. b Heatmap of specific cancer- and bladder cancer-related genes regulated in tumor biopsies from the treatment group (red = upregulated, blue = downregulated, cut-off FC > 1.5, P <0.05 compared to placebo group). About 60% of all regulated genes were inhibited in the treatment group. c Detailed analysis of data in (a, b). Top regulated, cancer-associated functions are shown. Inhibition is indicated by negative z-scores (blue) and significance by P values (orange). The expression of genes involved in tumor invasion, neoplasia, tumor growth, and urinary tract tumors was strongly inhibited. d Inhibition of Ras signaling in the treatment group compared to placebo. e Bladder cancer gene network regulated specifically in patients receiving alpha1–oleate treatment compared to placebo.

Comment in

  • Uro-Science.
    Atala A. Atala A. J Urol. 2022 Mar;207(3):727-729. doi: 10.1097/JU.0000000000002363. Epub 2021 Dec 14. J Urol. 2022. PMID: 34903031 No abstract available.

References

    1. Hanahan D, Weinberg RA. Hallmarks of cancer: the next generation. Cell. 2011;144:646–674. - PubMed
    1. Scott AM, Wolchok JD, Old LJ. Antibody therapy of cancer. Nat. Rev. Cancer. 2012;12:278–287. doi: 10.1038/nrc3236. - DOI - PubMed
    1. Håkansson A, Zhivotovsky B, Orrenius S, Sabharwal H, Svanborg C. Apoptosis induced by a human milk protein. Proc. Natl Acad. Sci. USA. 1995;92:8064–8068. doi: 10.1073/pnas.92.17.8064. - DOI - PMC - PubMed
    1. Svensson M, Håkansson A, Mossberg A-K, Linse S, Svanborg C. Conversion of α-lactalbumin to a protein inducing apoptosis. Proc. Natl Acad. Sci. USA. 2000;97:4221–4226. doi: 10.1073/pnas.97.8.4221. - DOI - PMC - PubMed
    1. Gustafsson L, Leijonhufvud I, Aronsson A, Mossberg AK, Svanborg C. Treatment of skin papillomas with topical alpha-lactalbumin–oleic acid. N. Engl. J. Med. 2004;350:2663–2672. doi: 10.1056/NEJMoa032454. - DOI - PubMed

Publication types

Associated data