. 2021 Jun 8;12(1):3428.
doi: 10.1038/s41467-021-23827-0.

Low chorionic villous succinate accumulation associates with recurrent spontaneous abortion risk

Affiliations

Low chorionic villous succinate accumulation associates with recurrent spontaneous abortion risk

Xiao-Hui Wang et al. Nat Commun. .

Abstract

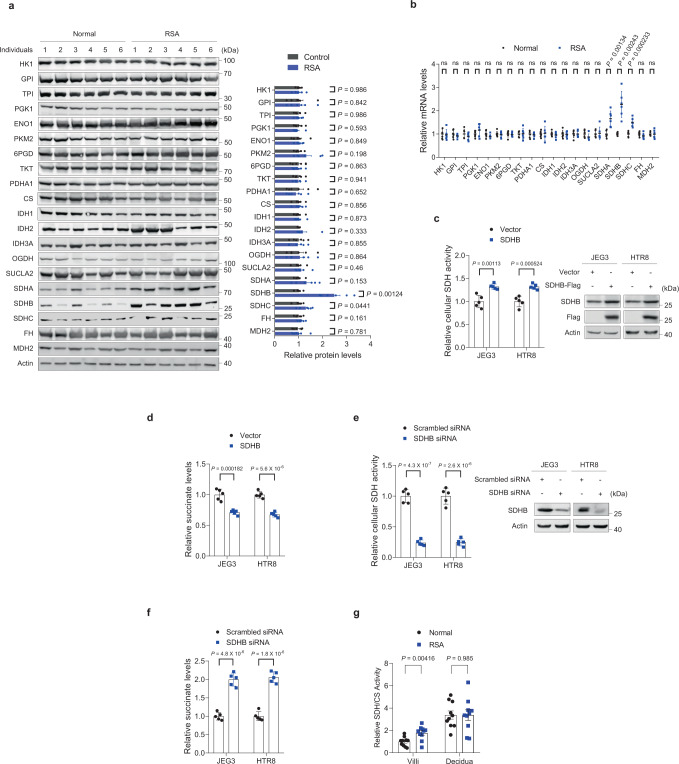
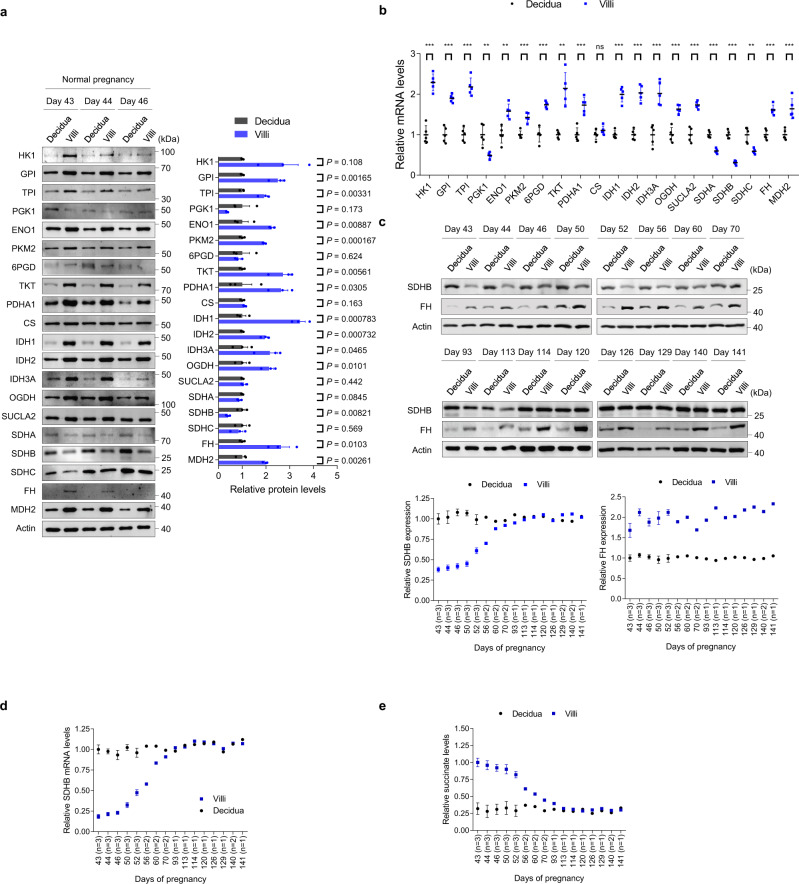
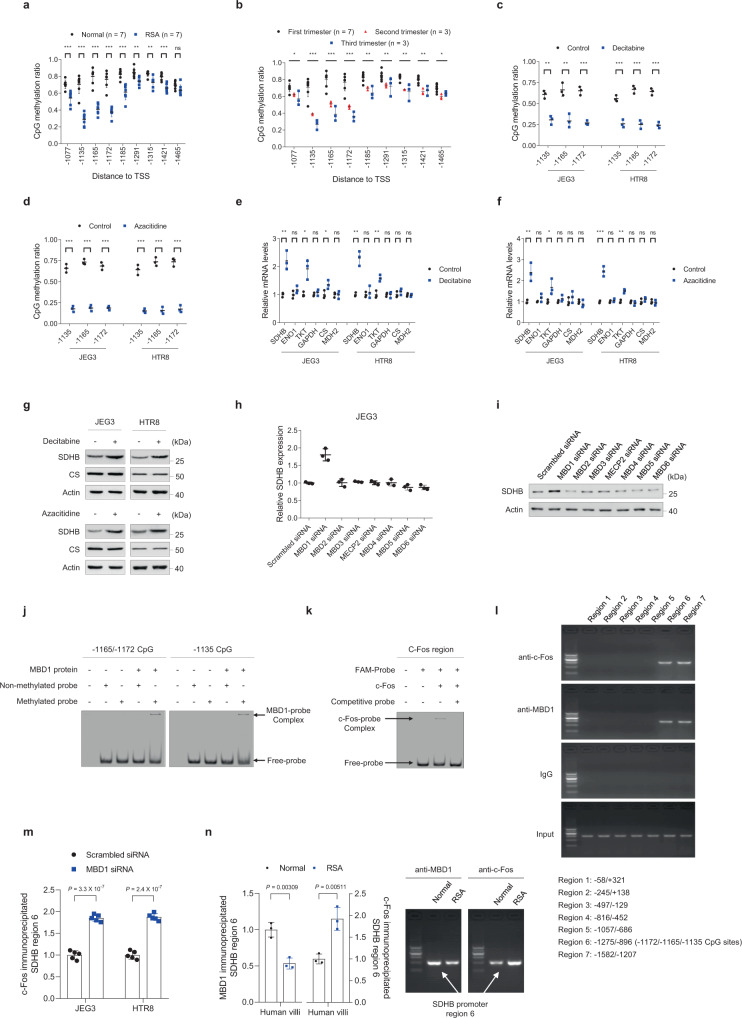
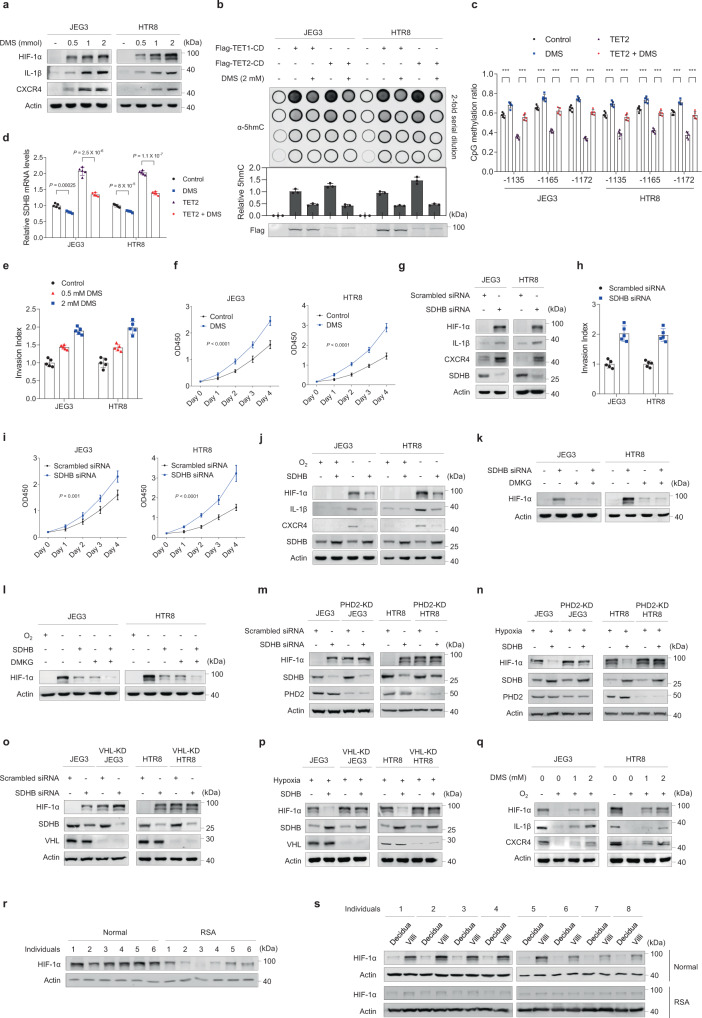
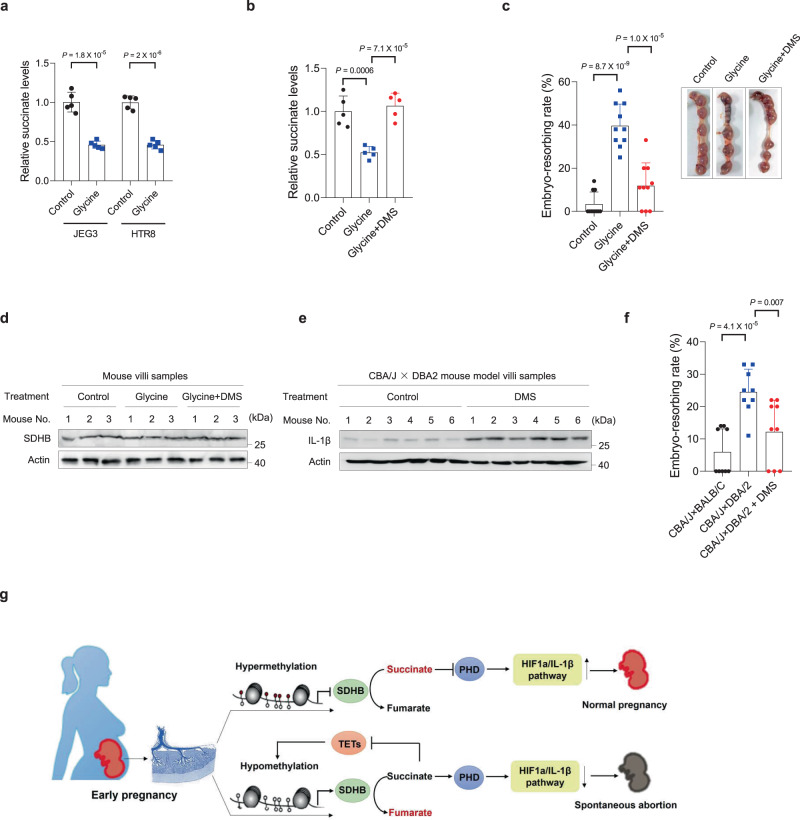
Dysregulated extravillous trophoblast invasion and proliferation are known to increase the risk of recurrent spontaneous abortion (RSA); however, the underlying mechanism remains unclear. Herein, in our retrospective observational case-control study we show that villous samples from RSA patients, compared to healthy controls, display reduced succinate dehydrogenase complex iron sulfur subunit (SDHB) DNA methylation, elevated SDHB expression, and reduced succinate levels, indicating that low succinate levels correlate with RSA. Moreover, we find high succinate levels in early pregnant women are correlated with successful embryo implantation. SDHB promoter methylation recruited MBD1 and excluded c-Fos, inactivating SDHB expression and causing intracellular succinate accumulation which mimicked hypoxia in extravillous trophoblasts cell lines JEG3 and HTR8 via the PHD2-VHL-HIF-1α pathway; however, low succinate levels reversed this effect and increased the risk of abortion in mouse model. This study reveals that abnormal metabolite levels inhibit extravillous trophoblast function and highlights an approach for RSA intervention.


Conflict of interest statement

The authors declare no competing interests.

Figures

Fig. 1
Fig. 1. Low villous SDHB expression reduces succinate accumulation and correlates with RSA.
a Western blot analysis of glycolysis and citrate cycle enzymes in villi from individuals with RSA or normal controls (n = 6 persons/group). Right panel: quantitative western blot results of six samples per group. b mRNA expression of glycolytic and citrate cycle genes in villi from individuals with RSA and normal controls (n = 6 persons/group). Exact P values in b are listed below: HK1 0.800, GPI 0.326, TPI 0.369, PGK1 0.202, ENO1 0.145, PKM2 0.685, 6PGD 0.715, TKT 0.914, PDHA1 0.691, CS 0.841, IDH1 0.546, IDH2 0.801, IDH3A 0.969, OGDH 0.163, SUCLA2 0.816, SDHA 0.00134, SDHB 0.00243, SDHC 0.000233, FH 0.222, and MDH2 0.938. c Relative SDH activities in SDHB-overexpressing JEG3 and HTR8 cells and control cells (n = 5 independent experiments). The SDHB overexpression efficiency is shown in the right panel. d Succinate levels in SDHB-overexpressing JEG3 and HTR8 cells and control cells (n = 5 independent experiments). e Relative SDH activities in SDHB-knockdown JEG3 and HTR8 cells and control cells (n = 5 independent experiments). The SDHB-knockdown efficiency is shown in the right panel. f Succinate levels in SDHB-knockdown JEG3 and HTR8 cells and control cells (n = 5 independent experiments). g The relative SDH activities in villi and decidua tissues from both RSA patients and normal controls (n = 10 persons/group). ag Data represent the mean ± standard error; ns not significant, *P < 0.05, **P < 0.01, ***P < 0.001, ns not significant. Two-tailed unpaired Student’s t tests in ag. Source data are provided as a Source Data file.
Fig. 2
Fig. 2. Dynamic changes in SDHB regulate villous succinate levels and pregnancy progression.
a Western blot analysis of glycolysis and citrate cycle enzymes in villi (n = 3 biologically independent samples) and decidua (n = 3 biologically independent samples) from normal controls. The timing of pregnancy termination (day) is shown for each sample. Right panel: quantitative western blot results of three samples per group. b mRNA levels of glycolytic and citrate cycle genes (n = 5 persons). Exact P values in b are listed below: HK1 1.3 × 10−5, GPI 1.4 × 10−5, TPI 1.3 × 10−5, PGK1 0.00247, ENO1 0.00142, PKM2 0.000206, 6PGD 3.4 × 10−5, TKT 0.00225, PDHA1 0.000238, CS 0.164, IDH1 5.9 × 10−6, IDH2 8.5 × 10−6, IDH3A 0.000383, OGDH 0.000115, SUCLA2 2.8 × 10−5, SDHA 1.8 × 10−5, SDHB 6.4 × 10−7, SDHC 0.00162, FH 4.6 × 10−5, and MDH2 0.000902. c SDHB and FH expression during pregnancy progression. The timing of pregnancy termination (Day) is shown for each sample. Lower panel: quantitative western blot results. d SDHB mRNA levels in villi and decidua during pregnancy progression. e Succinate levels in villi and decidua during pregnancy progression. The number of samples at each pregnancy termination (n) is shown on the horizontal coordinate (ce). a, b Data represent the mean ± standard error, *P < 0.05, **P < 0.01, ***P < 0.001, ns not significant. Two-tailed unpaired Student’s t tests in a, b. Source data are provided as a Source Data file.
Fig. 3
Fig. 3. DNA methylation regulates SDHB expression.
a CpG methylation levels in the SDHB promoter region of villi from individuals with RSA and normal controls (n = 7 persons/group). Exact P values in a are listed below: [−1077] 0.000624, [−1135] 2.5 × 10−6, [−1165] 7.6 × 10−7, [−1172] 9.9 × 10−7, [−1185] 0.000193, [−1291] 0.00272, [−1315] 0.00234, [−1421] 9.6 × 10−5, and [−1465] 0.0625. Other CpG sites besides those presented here are shown in Supplementary Fig. 2c. b SDHB promoter CpG methylation levels in villi from normal controls in different trimesters (n = 7 persons of the first trimester; n = 3 persons of the second trimester; n = 3 persons of the third trimester). Exact P values in b are listed below: [−1077] 0.00489, [−1135] 2.2 × 10−5, [−1165] 2.7 × 10−5, [−1172] 2.2 × 10−5, [−1185] 0.000316, [−1291] 0.00575, [−1315] 0.00011, [−1421] 0.000128 and [−1465] 0.00521. Other CpG sites besides those presented here are shown in Supplementary Fig. 2d. c, d CpG methylation levels in JEG3 and HTR8 cells treated with decitabine (c) (n = 3 independent experiments) or azacitidine (d) (n = 3 independent experiments). Exact P values in c are listed below: JEG3: [−1135] 0.00158, [−1165] 0.00463, and [−1172] 0.000308; HTR8: [−1135] 0.000877, [−1165] 0.000448, and [−1172] 0.000206. Exact P values in d are listed below: JEG3: [−1135] 0.000164, [−1165] 3.8 × 10−5, and [−1172] 7.4 × 10−5; HTR8: [−1135] 0.000202, [−1165] 1.0 × 10−5, and [−1172] 0.000112. e, f Gene expression in JEG3 and HTR8 cells treated with decitabine (e) (n = 3 independent experiments) or azacitidine (f) (n = 3 independent experiments). Exact P values in e are listed below: JEG3: SDHB 0.00377, ENO1 0.181, TKT 0.0112, GAPDH 0.339, CS 0.0436, and MDH2 0.973; HTR8: SDHB 0.00112, ENO1 0.559, TKT 0.00433, GAPDH 0.933, CS 0.283, and MDH2 0.763. Exact P values in f are listed below: JEG3: SDHB 0.000527, ENO1 0.171, TKT 0.0362, GAPDH 0.204, CS 0.303, and MDH2 0.398; HTR8: SDHB 0.000527, ENO1 0.383, TKT 0.00184, GAPDH 0.349, CS 0.271, and MDH2 0.638. g SDHB protein levels in cells treated with decitabine or azacitidine. h, i SDHB mRNA (h) (n = 3 independent experiments) and protein levels (i) in cells with knockdown of each methyl-CpG-binding protein. The knockdown efficiencies for each siRNA are shown in Supplementary Fig. 3b, c. j Binding abilities between MBD1 and double-strand DNA in the −1165/−1172 or −1135 CpG sites in EMSA. k Binding ability between c-Fos and double-strand DNA in the −1165/−1135 CpG sites in EMSA. l ChIP followed by PCR showing c-Fos and MBD1 occupancy at the SDHB promoter in cultured JEG3 cells. m ChIP-qPCR shows c-Fos occupancy at the SDHB promoter in MBD1-knockdown cells and control cells (n = 5 independent experiments). n ChIP followed by PCR/qPCR shows c-Fos and MBD1 occupancy at the SDHB promoter in villi from individuals with RSA (n = 3 biologically independent samples) and normal controls (n = 3 biologically independent samples). The left panel shows the ChIP-qPCR results. The right panel shows a representative result of ChIP-PCR. af, h, m, n Data represent the mean ± standard error, *P < 0.05, **P < 0.01, ***P < 0.001, ns not significant. Two-tailed unpaired Student’s t tests in a, cf, h, m, n; one-way ANOVA in b. Source data are provided as a Source Data file.
Fig. 4
Fig. 4. Succinate increases HIF-1α by mimicking cellular hypoxia.
a Western blot analysis of HIF-1α and its downstream targets in cells treated with different dimethyl succinate (DMS) concentrations. b Genomic DNAs were isolated from the cultured cells with various treatments, spotted on nitrocellulose membranes, and immunoblotted with an antibody specific to 5hmC. Quantification of 5hmC was calculated from three independent assays. c CpG methylation levels of SDHB promoter in JEG3 and HTR8 cells with different treatments (n = 5 biological repeats). d SDHB mRNA levels in JEG3 and HTR8 cells with different treatments (n = 5 biological repeats). e, f Invasion (e) and proliferation (f) of JEG3 and HTR8 cells treated with different DMS concentrations (n = 5 biological repeats). g Western blot analysis of HIF-1α and its downstream targets in SDHB-knockdown cells and control cells. h, i Invasion (h) and proliferation (i) of SDHB-knockdown cells and control cells (n = 5 biological repeats). jq Western blot analysis of HIF-1α and its downstream targets in cells with various treatments. r, s Western blot analysis of HIF-1α in tissues from individuals with RSA and normal controls. cf, i Data represent the mean ± standard error, *P < 0.05, **P < 0.01, ***P < 0.001, ns not significant. One-way ANOVA in cf, i. Source data are provided as a Source Data file.
Fig. 5
Fig. 5. Decreased succinate accumulation contributes toward the onset of abortion in mice.
a Succinate levels in cells treated with or without glycine (n = 5 biological repeats). b Succinate levels in villi of mice with various treatments (n = 5 biological repeats). c Embryo-resorption rates in mouse models with various treatments (n = 10 biological repeats). Representative macroscopic appearance of uteri on gestational day 13.5 in pregnancies with various treatments were shown in right panel. d SDHB expression levels in villi from mice with various treatments. e IL-1β expression levels in villi from mice after indicated treatments. f Embryo-resorption rates in mouse models with indicated treatments (n = 9 biological repeats). g Schematic illustration indicating how low embryonic villous succinate accumulation increases RSA risk. ac, f Data represent the mean ± standard error, *P < 0.05, **P < 0.01, ***P < 0.001, ns not significant. Two-tailed unpaired Student’s t tests in a; one-way ANOVA in b, c, f. Source data are provided as a Source Data file.

References

    1. Ford HB, Schust DJ. Recurrent pregnancy loss: etiology, diagnosis, and therapy. Rev. Obstet. Gynecol. 2009;2:76–83. - PMC - PubMed
    1. Martinez-Zamora MA, Cervera R, Balasch J. Recurrent miscarriage, antiphospholipid antibodies and the risk of thromboembolic disease. Clin. Rev. Allergy Immunol. 2012;43:265–274. doi: 10.1007/s12016-012-8316-0. - DOI - PubMed
    1. Dahl M, Hviid TV. Human leucocyte antigen class Ib molecules in pregnancy success and early pregnancy loss. Hum. Reprod. Update. 2012;18:92–109. doi: 10.1093/humupd/dmr043. - DOI - PubMed
    1. Teklenburg G, Salker M, Heijnen C, Macklon NS, Brosens JJ. The molecular basis of recurrent pregnancy loss: impaired natural embryo selection. Mol. Hum. Reprod. 2010;16:886–895. doi: 10.1093/molehr/gaq079. - DOI - PubMed
    1. Jeve YB, Davies W. Evidence-based management of recurrent miscarriages. J. Hum. Reprod. Sci. 2014;7:159–169. doi: 10.4103/0974-1208.142475. - DOI - PMC - PubMed

Publication types

MeSH terms