. 2021 Jun 8;11(1):12109.
doi: 10.1038/s41598-021-91297-x.

Identifying and characterizing high-risk clusters in a heterogeneous ICU population with deep embedded clustering

Affiliations

Identifying and characterizing high-risk clusters in a heterogeneous ICU population with deep embedded clustering

José Castela Forte et al. Sci Rep. .

Abstract

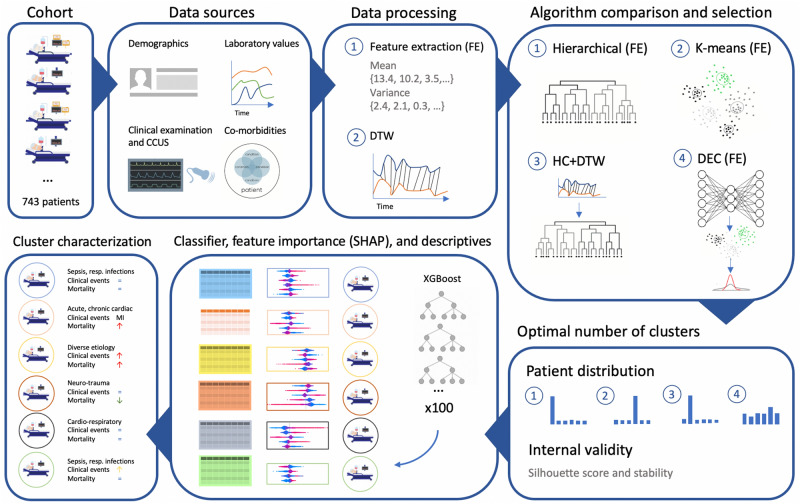
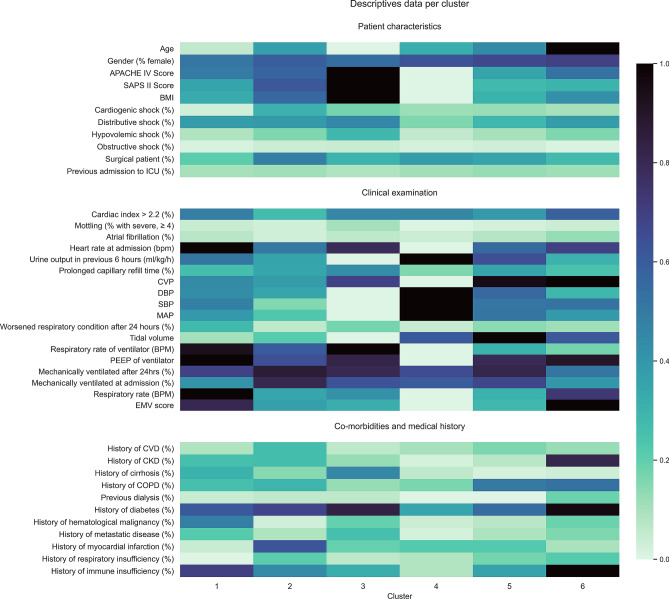
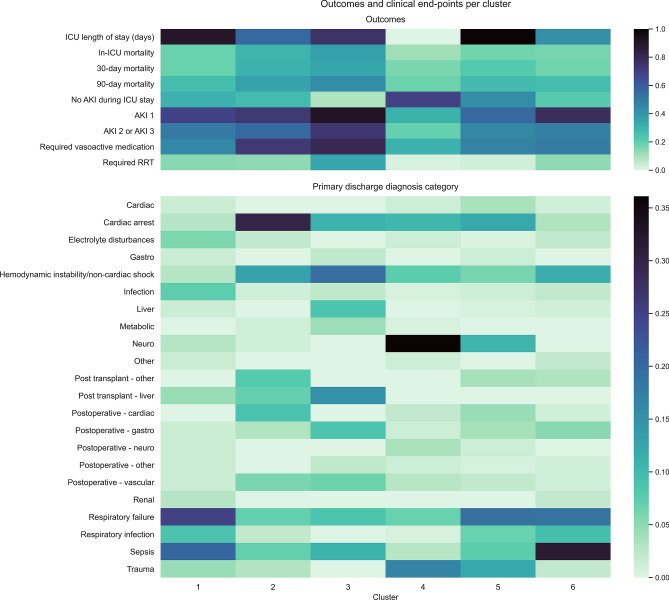
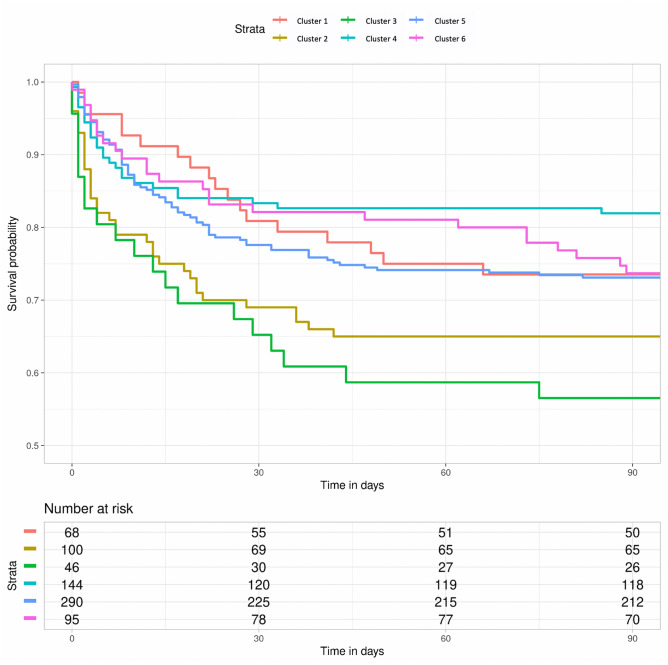
Critically ill patients constitute a highly heterogeneous population, with seemingly distinct patients having similar outcomes, and patients with the same admission diagnosis having opposite clinical trajectories. We aimed to develop a machine learning methodology that identifies and provides better characterization of patient clusters at high risk of mortality and kidney injury. We analysed prospectively collected data including co-morbidities, clinical examination, and laboratory parameters from a minimally-selected population of 743 patients admitted to the ICU of a Dutch hospital between 2015 and 2017. We compared four clustering methodologies and trained a classifier to predict and validate cluster membership. The contribution of different variables to the predicted cluster membership was assessed using SHapley Additive exPlanations values. We found that deep embedded clustering yielded better results compared to the traditional clustering algorithms. The best cluster configuration was achieved for 6 clusters. All clusters were clinically recognizable, and differed in in-ICU, 30-day, and 90-day mortality, as well as incidence of acute kidney injury. We identified two high mortality risk clusters with at least 60%, 40%, and 30% increased. ICU, 30-day and 90-day mortality, and a low risk cluster with 25-56% lower mortality risk. This machine learning methodology combining deep embedded clustering and variable importance analysis, which we made publicly available, is a possible solution to challenges previously encountered by clustering analyses in heterogeneous patient populations and may help improve the characterization of risk groups in critical care.


Conflict of interest statement

The authors declare no competing interests.

Figures

Figure 1
Figure 1
Schematic overview of the different steps in the analysis. Patient selection, integration of different data sources, data processing with feature extraction (FE) or dynamic time warping (DTW), comparison of the four clustering algorithms, selection of the best algorithm based on patient distribution and internal validity measures, training of the classifier for attributing true labels to the clusters and calculating feature importance with SHAP, and cluster characterization based on input data from diagnoses, feature importance, and differences in outcomes including mortality, AKI, and other clinical events.
Figure 2
Figure 2
Heatmap of patient characteristics, clinical examination and co-morbidity data per cluster. Bars on the right show the colour scale representing the proportion of patients with each characteristic regarding demographics, clinical examination, and co-morbidities. For continuous variables, such as SBP or urine output, it represents a scaled value from highest cluster mean (1.0) to lowest cluster mean (0.0).
Figure 3
Figure 3
Heatmap of outcomes and clinical end-points per cluster. Bars on the right show the colour scale representing the proportion of patients within the cluster with the outcome (upper panel) or the discharge diagnosis (lower panel).
Figure 4
Figure 4
Kaplan–Meier curves stratified per cluster for mortality during and after ICU stay. Survival curves for all six clusters, with the number of patients at risk at 30 and 90 days per cluster.

References

    1. Castela Forte J, Perner A, van der Horst ICC. The use of clustering algorithms in critical care research to unravel patient heterogeneity. Intensive Care Med. 2019;45:1025–1028. doi: 10.1007/s00134-019-05631-z. - DOI - PubMed
    1. Vranas KC, et al. Identifying distinct subgroups of intensive care unit patients: A machine learning approach. Crit. Care Med. 2017;45(10):1607–1615. doi: 10.1097/CCM.0000000000002548. - DOI - PMC - PubMed
    1. van Smeden M, Harrell FE, Dahly DL. Novel diabetes subgroups. Lancet Diabetes Endocrinol. 2018;6(6):439–440. doi: 10.1016/S2213-8587(18)30124-4. - DOI - PubMed
    1. Sinha P, et al. Latent class analysis of ARDS subphenotypes: A secondary analysis of the statins for acutely injured lungs from sepsis (SAILS) study. Intensive Care Med. 2018;44(11):1859–1869. doi: 10.1007/s00134-018-5378-3. - DOI - PMC - PubMed
    1. Bhatraju PK, et al. Identification of acute kidney injury subphenotypes with differing molecular signatures and responses to vasopressin therapy. Am. J. Respir. Crit. Care Med. 2019;199(7):863–872. doi: 10.1164/rccm.201807-1346OC. - DOI - PMC - PubMed