

A model and predictions for COVID-19 considering population behavior and vaccination
- PMID: 34103618
- PMCID: PMC8187461
- DOI: 10.1038/s41598-021-91514-7
A model and predictions for COVID-19 considering population behavior and vaccination
Abstract
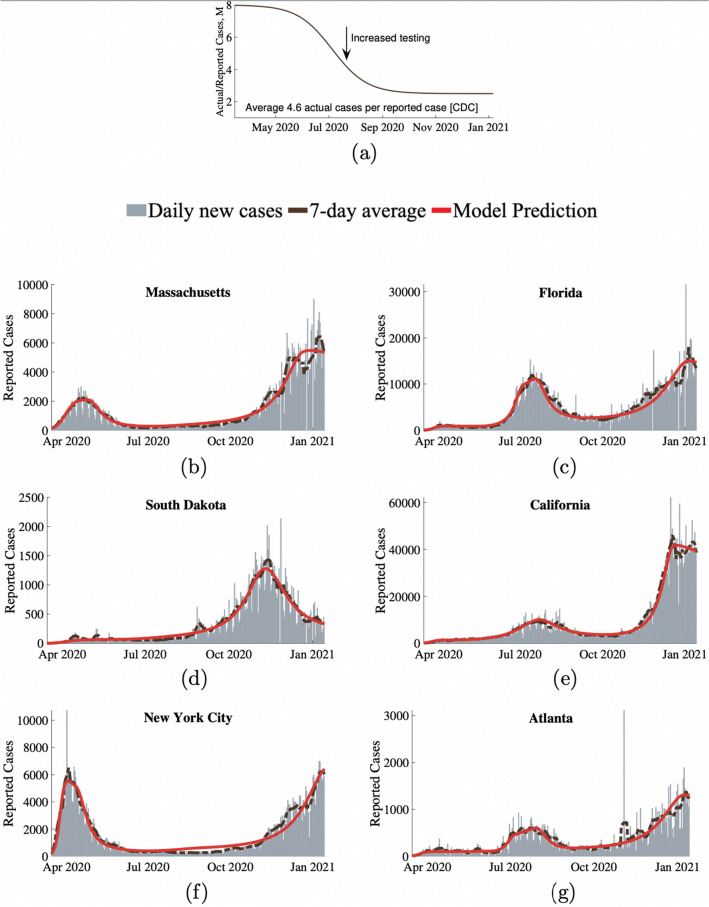
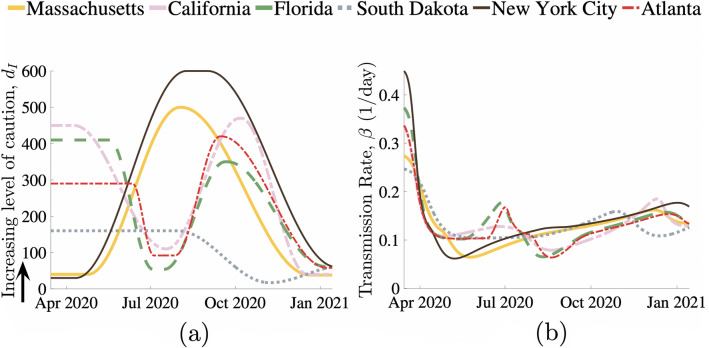
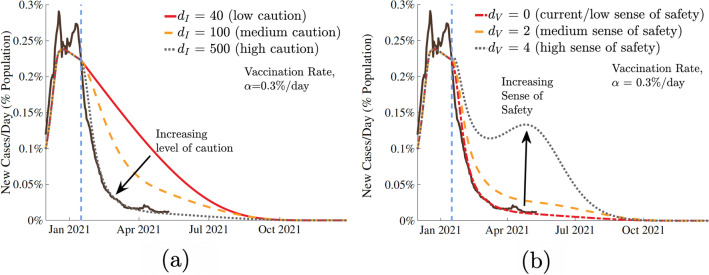
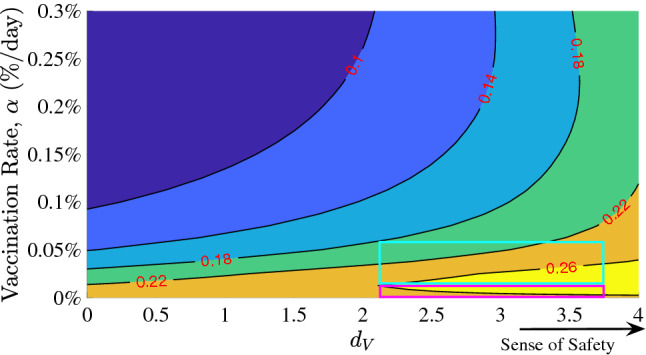
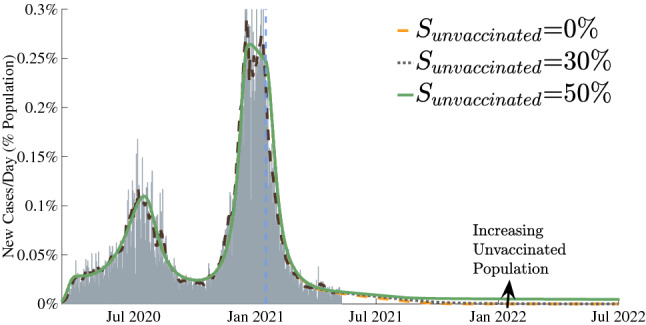
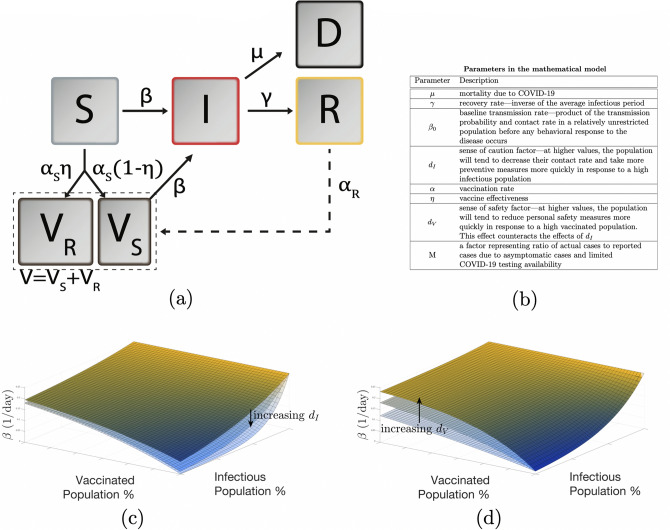
The effect of vaccination coupled with the behavioral response of the population is not well understood. Our model incorporates two important dynamically varying population behaviors: level of caution and sense of safety. Level of caution increases with infectious cases, while an increasing sense of safety with increased vaccination lowers precautions. Our model accurately reproduces the complete time history of COVID-19 infections for various regions of the United States. We propose a parameter [Formula: see text] as a direct measure of a population's caution against an infectious disease that can be obtained from the infectious cases. The model provides quantitative measures of highest disease transmission rate, effective transmission rate, and cautionary behavior. We predict future COVID-19 trends in the United States accounting for vaccine rollout and behavior. Although a high rate of vaccination is critical to quickly ending the pandemic, a return towards pre-pandemic social behavior due to increased sense of safety during vaccine deployment can cause an alarming surge in infections. Our results predict that at the current rate of vaccination, the new infection cases for COVID-19 in the United States will approach zero by August 2021. This model can be used for other regions and for future epidemics and pandemics.
Conflict of interest statement
The authors declare no competing interests.
Figures

Similar articles
-
Dynamic Panel Data Modeling and Surveillance of COVID-19 in Metropolitan Areas in the United States: Longitudinal Trend Analysis.J Med Internet Res. 2021 Feb 9;23(2):e26081. doi: 10.2196/26081. J Med Internet Res. 2021. PMID: 33481757 Free PMC article.
-
Impact of vaccination on the COVID-19 pandemic in U.S. states.Sci Rep. 2022 Jan 28;12(1):1554. doi: 10.1038/s41598-022-05498-z. Sci Rep. 2022. PMID: 35091640 Free PMC article.
-
COVID-19 pandemic predictions using the modified Bateman SIZ model and observational data for Heidelberg, Germany: Effect of vaccination with a SARS-CoV-2 vaccine, coronavirus testing and application of the Corona-Warn-App.Int J Clin Pharmacol Ther. 2020 Aug;58(8):417-425. doi: 10.5414/CP203846. Int J Clin Pharmacol Ther. 2020. PMID: 32646540
-
Guidance for Implementing COVID-19 Prevention Strategies in the Context of Varying Community Transmission Levels and Vaccination Coverage.MMWR Morb Mortal Wkly Rep. 2021 Jul 27;70(30):1044-1047. doi: 10.15585/mmwr.mm7030e2. MMWR Morb Mortal Wkly Rep. 2021. PMID: 34324480 Free PMC article.
-
Modeling vaccination strategies in an Excel spreadsheet: Increasing the rate of vaccination is more effective than increasing the vaccination coverage for containing COVID-19.PLoS One. 2021 Jul 19;16(7):e0254430. doi: 10.1371/journal.pone.0254430. eCollection 2021. PLoS One. 2021. PMID: 34280210 Free PMC article.
Cited by
-
A COVID-19 model incorporating variants, vaccination, waning immunity, and population behavior.Sci Rep. 2022 Nov 27;12(1):20377. doi: 10.1038/s41598-022-24967-z. Sci Rep. 2022. PMID: 36437375 Free PMC article.
-
Characteristics and Comparison of Adverse Events of Coronavirus Disease 2019 Vaccines Reported to the United States Vaccine Adverse Event Reporting System Between 14 December 2020 and 8 October 2021.Front Med (Lausanne). 2022 Apr 5;9:826327. doi: 10.3389/fmed.2022.826327. eCollection 2022. Front Med (Lausanne). 2022. PMID: 35449806 Free PMC article.
-
Incorporating the mutational landscape of SARS-COV-2 variants and case-dependent vaccination rates into epidemic models.Infect Dis Model. 2022 Jun;7(2):75-82. doi: 10.1016/j.idm.2022.02.003. Epub 2022 Mar 11. Infect Dis Model. 2022. PMID: 35291223 Free PMC article.
-
Comparative evaluation of behavioral epidemic models using COVID-19 data.Proc Natl Acad Sci U S A. 2025 Jun 17;122(24):e2421993122. doi: 10.1073/pnas.2421993122. Epub 2025 Jun 12. Proc Natl Acad Sci U S A. 2025. PMID: 40504146 Free PMC article.
-
Transmission trends of the global COVID-19 pandemic with combined effects of adaptive behaviours and vaccination.Epidemiol Infect. 2023 Feb 20;151:e39. doi: 10.1017/S0950268823000274. Epidemiol Infect. 2023. PMID: 36803678 Free PMC article.
References
-
- World Health Organization. WHO Coronavirus Disease (COVID-19) Dashboard (2021). - PubMed
-
- Commissioner, O. o. t. COVID-19 Vaccines. FDA (2021).
MeSH terms
LinkOut - more resources
Full Text Sources
Medical
