. 2021 May 19:2021:5587441.
doi: 10.1155/2021/5587441. eCollection 2021.

Identification of Molecular Characteristics and New Prognostic Targets for Thymoma by Multiomics Analysis

Affiliations

Identification of Molecular Characteristics and New Prognostic Targets for Thymoma by Multiomics Analysis

Dazhong Liu et al. Biomed Res Int. .

Abstract

Background: Thymoma is a heterogeneous tumor originated from thymic epithelial cells. The molecular mechanism of thymoma remains unclear.

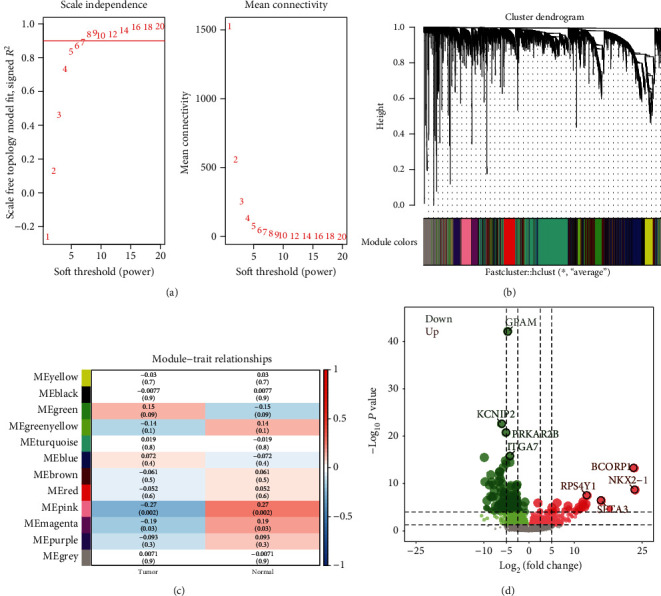
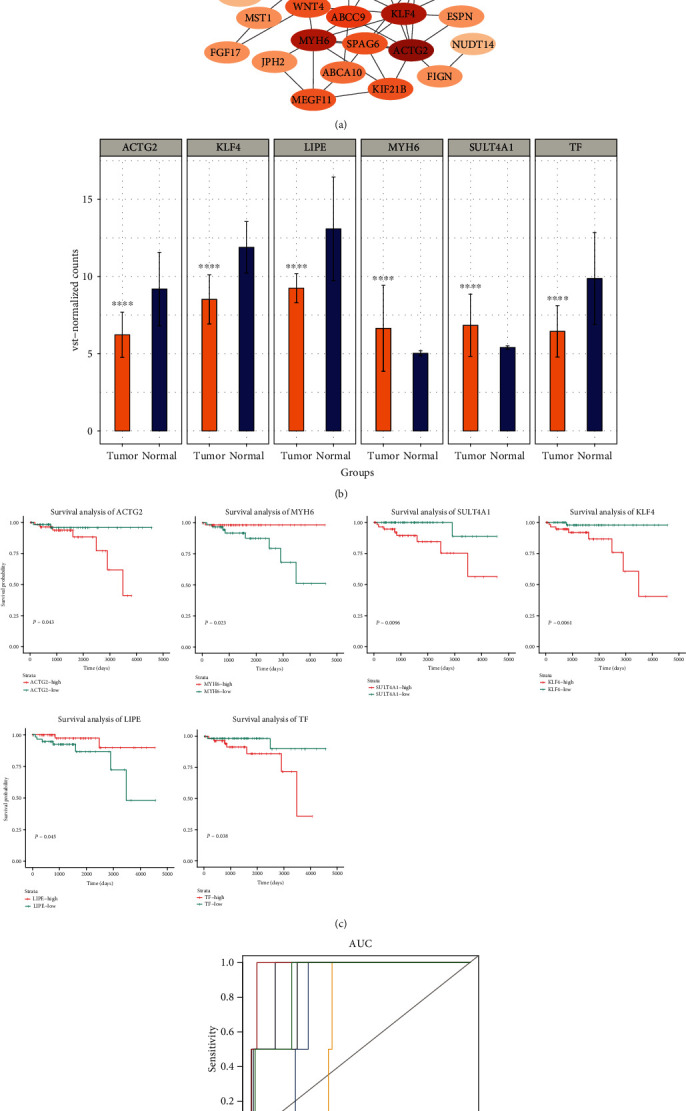
Methods: The expression profile, methylation, and mutation data of thymoma were obtained from TCGA database. The coexpression network was constructed using the variance of gene expression through WGCNA. Enrichment analysis using clusterProfiler R package and overall survival (OS) analysis by Kaplan-Meier method were carried out for the intersection of differential expression genes (DEGs) screened by limma R package and important module genes. PPI network was constructed based on STRING database for genes with significant impact on survival. The impact of key genes on the prognosis of thymoma was evaluated by ROC curve and Cox regression model. Finally, the immune cell infiltration, methylation modification, and gene mutation were calculated.

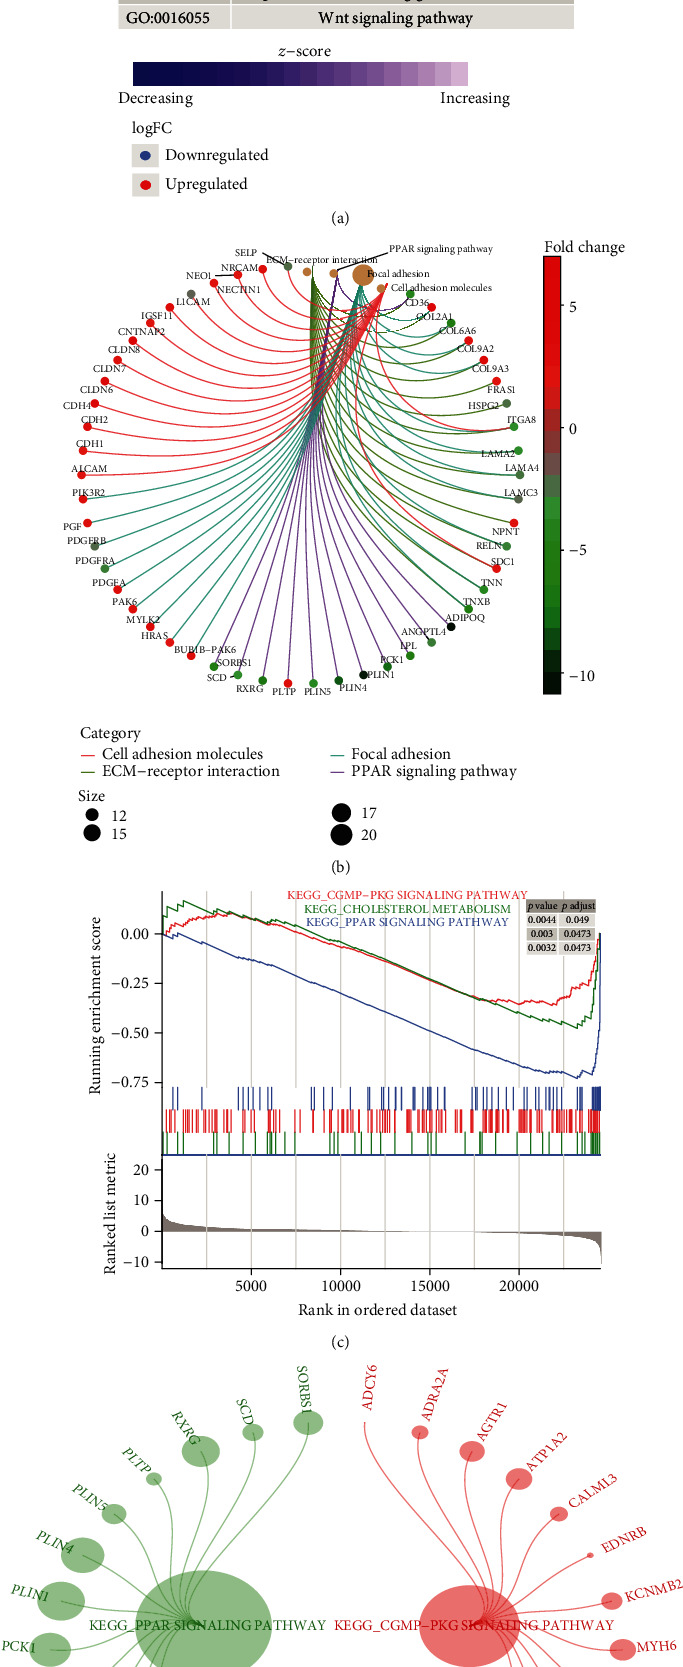
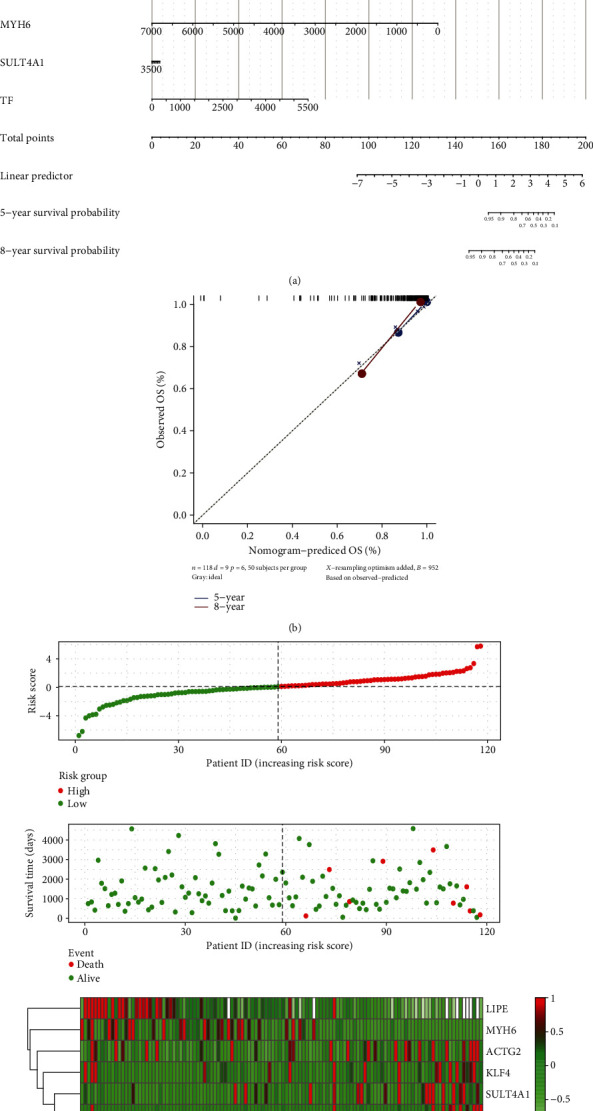
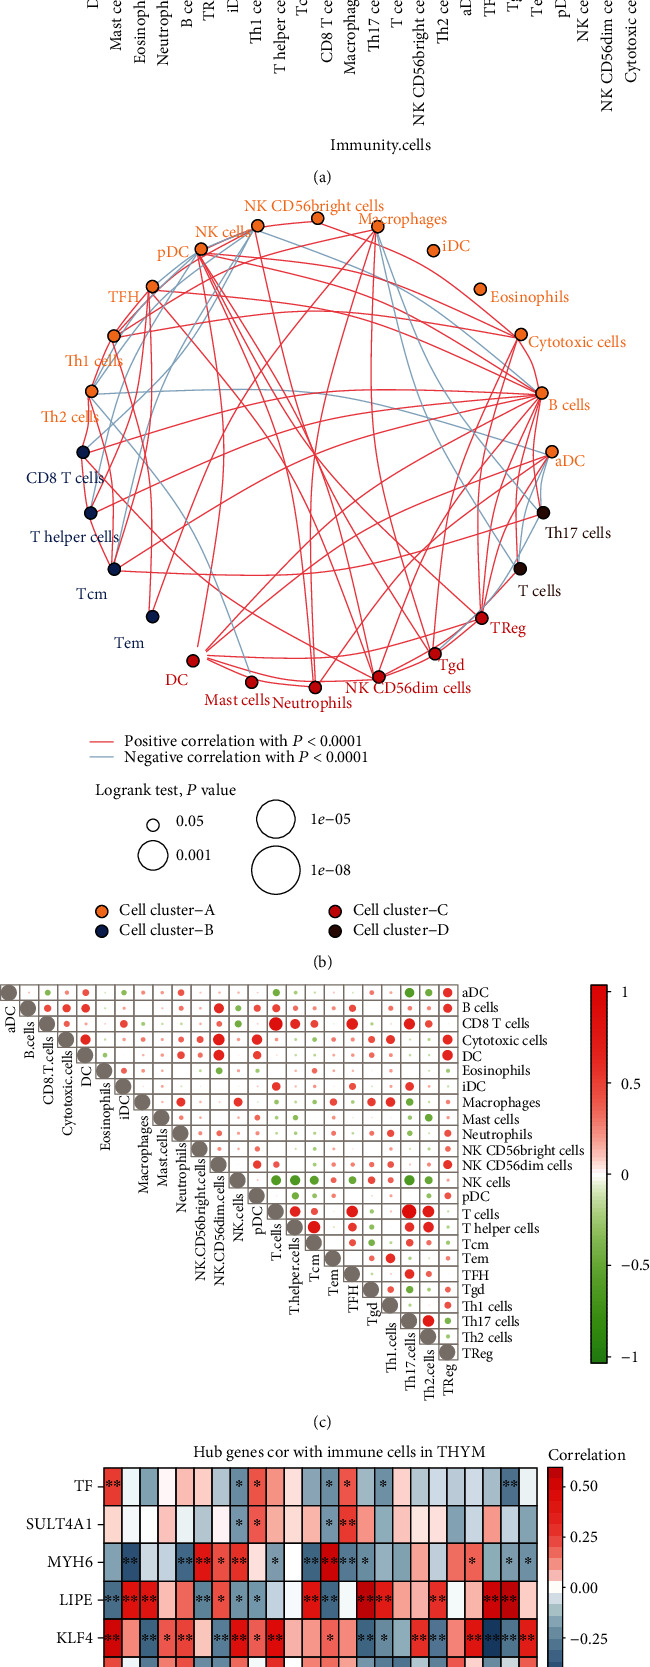
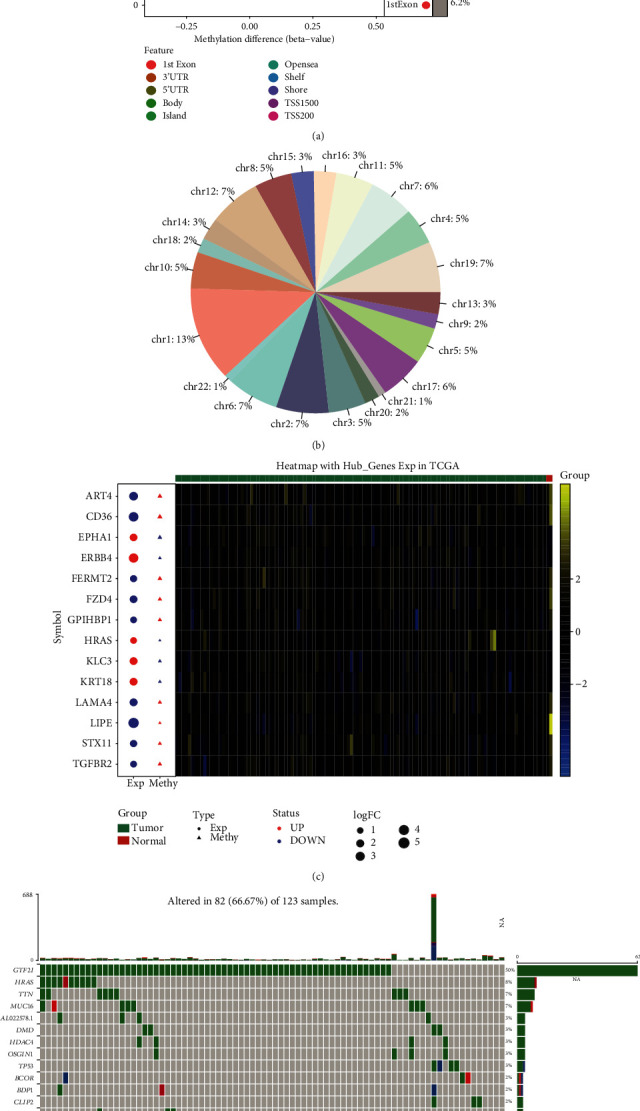
Results: We obtained eleven coexpression modules, and three of them were higher positively correlated with thymoma. DEGs in these three modules mainly involved in MAPK cascade and PPAR pathway. LIPE, MYH6, ACTG2, KLF4, SULT4A1, and TF were identified as key genes through the PPI network. AUC values of LIPE were the highest. Cox regression analysis showed that low expression of LIPE was a prognostic risk factor for thymoma. In addition, there was a high correlation between LIPE and T cells. Importantly, the expression of LIPE was modified by methylation. Among all the mutated genes, GTF2I had the highest mutation frequency.

Conclusion: These results suggested that the molecular mechanism of thymoma may be related to immune inflammation. LIPE may be the key genes affecting prognosis of thymoma. Our findings will help to elucidate the pathogenesis and therapeutic targets of thymoma.


Conflict of interest statement

The authors declare that the research was conducted in the absence of any commercial or financial relationships that could be construed as a potential conflict of interest.

Figures

Figure 1
Figure 1
Coexpression analysis of gene expression in thymoma. (a) Determination of soft threshold power in coexpression analysis. The left image shows the scale-free fit index (y-axis) as a function of the soft-thresholding power (x-axis). The right image shows the average connectivity (degree, y-axis) as a function of the soft-thresholding power (x-axis). (b) Module cluster tree of thymoma genes with large variance. Branches with different colors correspond to different modules. (c) The correlation between module and clinical trait. Each row corresponds to a module, and each column corresponds to a feature. Each cell contains the corresponding correlation and P value. (d) The differentially expressed genes between thymoma and control. Red nodes were significantly upregulated genes, and green nodes were significantly downregulated genes.
Figure 2
Figure 2
Enrichment analysis of thymoma-related module genes. (a) Important genes were involved in biological processes. Red nodes are upregulated genes, and blue nodes are downregulated genes. (b) Important genes were involved in KEGG pathway. Different line colors represent different signaling pathways which genes involved in. (c) KEGG pathway in GSEA for important genes. These pathways were significantly upregulated in thymoma. (d) The DEGs involved in the same KEGG pathway in the results of enrichment and GSEA. Different colors represent genes involved in different signaling pathways.
Figure 3
Figure 3
Identification of key genes affecting overall survival of thymoma. (a) Cytoscape software shows the PPI network of important genes based on the STRING database. (b) The expression of six genes with the highest connectivity in the PPI network. ∗∗∗P < 0.001. (c) The effect of six genes with the highest connectivity in the PPI network on the overall survival of thymoma (Kaplan-Meier plot). Red and green curves are for high expression and low expression, respectively. (d) ROC curve of key genes. Different color curves represent different genes.
Figure 4
Figure 4
The expression of key genes affects the prognosis of patients with thymoma. (a) Nomogram for predicting overall survival in patients with thymoma. (b) Plots depict the calibration of each model in terms of agreement between predicted and observed 5-year and 8-year outcomes. (c) Risk factor correlation diagram. The green dot was the survival thymoma patient, and the red dot was the dead thymoma patient. The dotted line was the median risk score, the left side was the low-risk group, and the right side was the high-risk group.
Figure 5
Figure 5
Immune cell infiltration in thymoma. (a) The difference of immune cell infiltration between thymoma and control. The blue line represents a significant difference. (b) Clustering of immunocytes with differential infiltration. The red line represents the positive correlation between immune cells, and the blue line represents the negative correlation. (c) Correlation between immune cells in thymoma. Red represents positive correlation between immune cells, and blue line represents negative correlation. The size of the node represents the size of the correlation coefficient. (d) Correlation between key genes and immune cells. Red represents positive correlation between immune cells, and blue line represents negative correlation. P < 0.05 and ∗∗P < 0.01.
Figure 6
Figure 6
Methylation and mutation in thymoma. (a) Differential methylation sites between thymoma and control. (b) The proportion of methylation sites in different chromosomes. (c) The expression and methylation of methylation factors. Red node represents upregulation, and blue node represents downregulation. Yellow represents positive gene expression, while blue represents negative gene expression. (d) The top 20 genes with the highest mutation frequency in thymoma. Each cell represents a sample.

References

    1. Yu L., Ke J., du X., Yu Z., Gao D. Genetic characterization of thymoma. Scientific Reports. 2019;9(1):p. 2369. doi: 10.1038/s41598-019-38878-z. - DOI - PMC - PubMed
    1. den Bakker M. A., Roden A. C., Marx A., Marino M. Histologic classification of thymoma: a practical guide for routine cases. Journal of Thoracic Oncology. 2014;9(9):S125–S130. doi: 10.1097/JTO.0000000000000297. - DOI - PubMed
    1. Aydemir B. The effect of myasthenia gravis as a prognostic factor in thymoma treatment. Northern Clinics of Istanbul. 2016;3(3):194–200. doi: 10.14744/nci.2016.60352. - DOI - PMC - PubMed
    1. Sun Y., Gu C., Shi J., et al. Reconstruction of mediastinal vessels for invasive thymoma: a retrospective analysis of 25 cases. Journal of Thoracic Disease. 2017;9(3):725–733. doi: 10.21037/jtd.2017.03.03. - DOI - PMC - PubMed
    1. Kim D. J., Yang W. I., Choi S. S., Kim K. D., Chung K. Y. Prognostic and clinical relevance of the World Health Organization schema for the classification of thymic epithelial tumors: a clinicopathologic study of 108 patients and literature review. Chest. 2005;127(3):755–761. doi: 10.1378/chest.127.3.755. - DOI - PubMed