. 2021 Jun:5:100087.
doi: 10.1016/j.lanepe.2021.100087. Epub 2021 Mar 21.

Evolution of outcomes for patients hospitalised during the first 9 months of the SARS-CoV-2 pandemic in France: A retrospective national surveillance data analysis

Affiliations

Evolution of outcomes for patients hospitalised during the first 9 months of the SARS-CoV-2 pandemic in France: A retrospective national surveillance data analysis

Noémie Lefrancq et al. Lancet Reg Health Eur. 2021 Jun.

Abstract

Background: As SARS-CoV-2 continues to spread, a thorough characterisation of healthcare needs and patient outcomes, and how they have changed over time, is essential to inform planning.

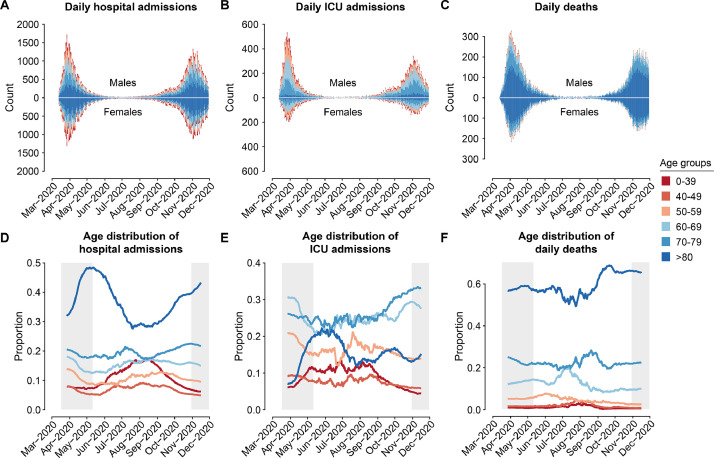
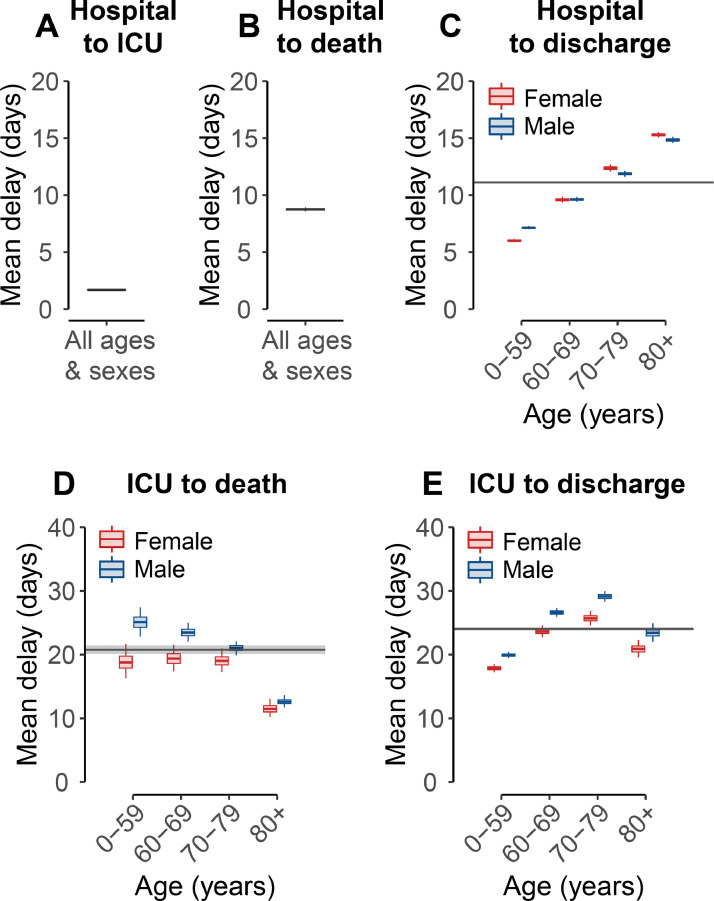
Methods: We developed a probabilistic framework to analyse detailed patient trajectories from 198,846 hospitalisations in France during the first nine months of the pandemic. Our model accounts for the varying age- and sex- distribution of patients, and explore changes in outcome probabilities as well as length of stay.

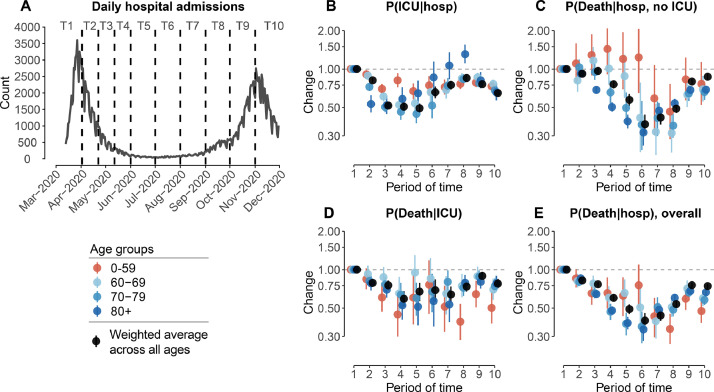
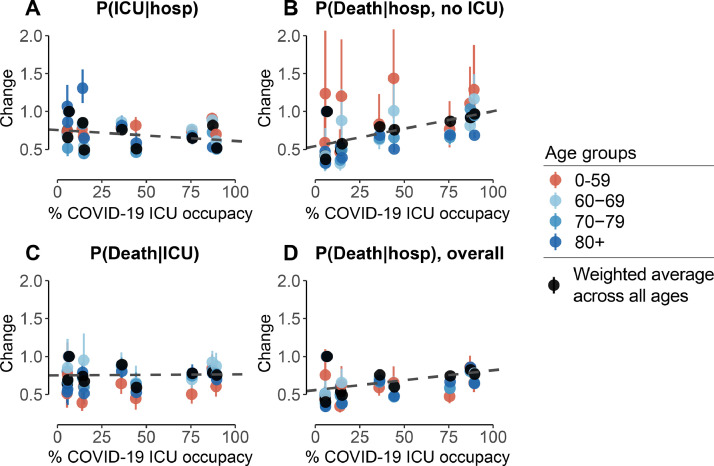
Findings: We found that there were marked changes in the age and sex of hospitalisations over the study period. In particular, the proportion of hospitalised individuals that were >80y varied between 27% and 48% over the course of the epidemic, and was lowest during the inter-peak period. The probability of hospitalised patients entering ICU dropped from 0·25 (0·24-0·26) to 0·13 (0·12-0·14) over the four first months as case numbers fell, before rising to 0·19 (0·19-0·20) during the second wave. The probability of death followed a similar trajectory, falling from 0·25 (0·24-0·26) to 0·10 (0·09-0·11) after the first wave before increasing again during the second wave to 0·19 (0·18-0·19). Overall, we find both the probability of death and the probability of entering ICU were significantly correlated with COVID-19 ICU occupancy.

Interpretation: There are large scale trends in patients outcomes by age, sex and over time. These need to be considered in ongoing healthcare planning efforts.

Funding: INCEPTION.


Conflict of interest statement

N.L, J.P., N.H., N.C., L.B., P.-Y.B., Y.Y., F.C. and S.C. have nothing to disclose. YY has been a board member receiving consultancy fees from ABBVIE, BMS, Gilead, MSD, J&J, Pfizer, and ViiV Healthcare, however, all these activities have been stopped in the 3 past years. H.S. reports personal fees from AstraZeneca Data Safety Monitoring Board, outside the submitted work.

Figures

Fig 1:
Fig. 1
Hospitalisation, ICU and death data. A. Daily number of hospital admissions, as a function of time. B. Daily number of ICU admissions, as a function of time. C. Daily number of deaths, as a function of time. In each panel, males counts are shown at the top, females counts are shown at the bottom. D. Age distribution of hospital admissions, as a function of time. E. Age distribution of ICU admissions, as a function of time. F. Age distribution of deaths, as a function of time. Distributions are computed on rolling 28-day windows. Colours represent the age group. Shaded areas on the bottom represent the lockdown periods in France (17 March - 11 May and 30 October - 15 December).
Fig 2:
Fig. 2
Probabilities of ICU admission and death. A. Probability of ICU admission given hospitalisation, as a function of age. B. Probability of death given hospitalisation and no ICU admission, as a function of age. C. Probability of death given ICU admission, as a function of age. D. Overall probability of death given hospitalisation, irrespective of ICU admission, as a function of age. Probabilities are computed as a weighted average on the period from March to November 2020. Females are shown in red, males in blue. The horizontal lines and shaded areas represent the overall mean across all ages and sexes. The boxplots represent the 2.5, 25, 50, 75, and 97.5 percentiles of the posterior distributions. .
Fig 3:
Fig. 3
Mean delays to ICU admission, death and hospital discharge. A. Mean delay from hospitalisation to ICU admission B. Mean delay from hospitalisation to death, given that the patient was not admitted in ICU. C. Mean delay from hospitalisation to hospital discharge, given that the patient was not admitted in ICU, as a function of age. D. Mean delay from ICU admission to death, as a function of age. E. Mean delay from ICU admission to hospital discharge, as a function of age and sex. Means are computed as a weighted average on the period from March to November 2020. Parameters characterising delay distributions are given in Tables S3–5. The horizontal lines and shaded areas represent the overall mean across all ages and sexes. Females are shown in red, males in blue. The boxplots represent the 2.5, 25, 50, 75, and 97.5 percentiles of the posterior distributions.
Fig 4:
Fig. 4
Changes in probabilities of ICU admission and death. A. Daily number of hospital admissions as a function of time, from 13th March to 30th June 2020. Dashed lines denote the different windows of time (named T1-T5) used to estimate the changes in probabilities. B. Changes in probability of ICU admission given hospitalization, as a function of time. C. Changes in probability of death given hospitalization and no ICU admission, as a function of time. D. Changes in probability of death given ICU admission, as a function of time. E. Changes in overall probability of death given hospitalization, as a function of time. We divide the epidemic into different periods of time: T1: 13 March - 1 April; T2: 2 April - 21 April; T3: 22 April - 11 May; T4: 12 May - 31 May; T5: 1 June - 30 June, T6: 1 July - 31 July, T7: 1 August - 31 August, T8: 1 September - 30 September, T9: 1 October - 31 October, T10: 1 November - 30 November. All changes are weighted by the proportion of patients that are of each sex. Changes are computed relatively to T1 (reference), estimates are presented in Tables S7–10. The dots and lines represent 2.5, 50 and 97.5 percentiles of the posterior distributions.
Fig 5:
Fig. 5
Correlation between changes in outcome probabilities and COVID-19 ICU occupancy. A. Changes in probability of ICU admission given hospitalization, as a function of COVID-19 ICU occupancy. B. Changes in probability of death given hospitalization and no ICU admission, as a function of COVID-19 ICU occupancy. C. Changes in probability of death given ICU admission, as a function of COVID-19 ICU occupancy. D. Changes in overall probability of death given hospitalization, as a function of ICU occupancy. The COVID-19 ICU occupancy corresponds to the mean occupancy of ICU by COVID-19 patients on each time period. All changes are weighted by the proportion that are of each sex. The dashed line represents the average trend (linear fit). .

References

    1. Flaxman S., Mishra S., Gandy A., Unwin H.J.T., Mellan T.A., Coupland H. Estimating the effects of non-pharmaceutical interventions on COVID-19 in Europe. Nature. 2020;584(7820):257–261. - PubMed
    1. Brauner J.M., Mindermann S., Sharma M., Johnston D., Salvatier J., Gavenčiak T. Inferring the effectiveness of government interventions against COVID-19. Science. 2020 doi: 10.1126/science.abd9338. Available from. - DOI - PMC - PubMed
    1. Moghadas S.M., Shoukat A., Fitzpatrick M.C., Wells C.R., Sah P., Pandey A. Projecting hospital utilization during the COVID-19 outbreaks in the United States. Proc Natl Acad Sci USA. 2020;117(16):9122–9126. - PMC - PubMed
    1. Massonnaud C., Roux J., Crépey P. COVID-19: forecasting short term hospital needs in France. medRxiv. 2020 https://www.medrxiv.org/content/10.1101/2020.03.16.20036939v1.abstract Available from: - DOI
    1. Andronico A., Kiem C.T., Paireau J., Succo T., Bosetti P., Lefrancq N. Evaluating the impact of curfews and other measures on SARS-CoV-2 transmission in French Guiana. medRxiv. 2020 https://www.medrxiv.org/content/10.1101/2020.10.07.20208314v1.abstract Available from. - DOI - PMC - PubMed