. 2021 Jul 26;60(31):17123-17130.
doi: 10.1002/anie.202105019. Epub 2021 Jun 27.

On the Biology of Werner's Complex

Affiliations

On the Biology of Werner's Complex

Raphael E F de Paiva et al. Angew Chem Int Ed Engl. .

Abstract

Werner's Complex, as a cationic coordination complex (CCC), has hitherto unappreciated biological properties derived from its binding affinity to highly anionic biomolecules such as glycosaminoglycans (GAGs) and nucleic acids. Competitive inhibitor and spectroscopic assays confirm the high affinity to GAGs heparin, heparan sulfate (HS), and its pentasaccharide mimetic Fondaparinux (FPX). Functional consequences of this affinity include inhibition of FPX cleavage by bacterial heparinase and mammalian heparanase enzymes with inhibition of cellular invasion and migration. Werner's Complex is a very efficient condensing agent for DNA and tRNA. In proof-of-principle for translational implications, it is demonstrated to display antiviral activity against human cytomegalovirus (HCMV) at micromolar concentrations with promising selectivity. Exploitation of non-covalent hydrogen-bonding and electrostatic interactions has motivated the unprecedented discovery of these properties, opening new avenues of research for this iconic compound.

Keywords: Antiviral efficacy; Biological Effects; DNA Binding and Condensation; Glycosaminoglycan interactions; Werner's Complex.


Figures

Fig. 1.
Fig. 1.
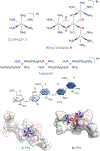
Structures of Co compounds [Co(NH3)6]3+ (I) and Werner’s complex, WC (II), TriplatinNC (TriPtNC) and the model glycosaminoglycan Fondaparinux (FPX). Bottom: DFT-optimized adducts between I or II with FPX. See the SI for full computational details. Complexes I and II have counter-ions omitted for clarity throughout text.
Fig. 2.
Fig. 2.. Werner’s Complex cellular entry is GAG-dependent
(a,b) TAMRA-R9 (R9) competition assay; CHO-K1 cells were treated with the indicated concentration of compound for 10 min. followed by treatment with 1 μM TAMRA-R9 for 1 h at 37 °C. The cells were harvested with trypsin, collected, washed and analysed at 488–585 nm by flow cytometry. (c) Cobalt cellular accumulation assay; CHO-K1 and CHO-pgsA745 cells were treated with 10 μM WC for the indicated time, harvested, washed. Cell pellets were digested with nitric acid and cobalt levels measured using inductively coupled plasma mass spectrometry. (d) Cell proliferation (MTT) assay; CHO-K1 and CHO-pgsA745 cells were treated with the indicated concentration of WC for 48h. MTT reagent was added for 3h, removed and precipitates dissolved in DMSO. Relative absorbance was determined as treated/untreated controls x100.
Fig. 3.
Fig. 3.. Werner’s Complex inhibits the function of GAG-interacting proteins
(a) Hep I activity assay (FPX cleavage); FPX was incubated for 1h with hep I. Reactions were stopped by adding 100 μl 1.69 mM WST-1, plates heated to 60°C for 1h and absorbance readings measured at 584 nm. (b) Various concentrations of compound were incubated for 15 min at 37°C with 50 μM FPX in buffer. After addition of 0.25U hep I for 1h, reactions were stopped by adding 100 μl 1.69mM WST-1, plates heated to 60°C for 1h and absorbance readings measured at 584 nm. (c) Hep I activity assay (HS cleavage); Growth factor-reduced matrigel in a Boyden chamber was treated with either PBS or equimolar amounts (50 μM) of the indicated compound for 1 h, followed by treatment with additional PBS or 0.3 units of hep I for 16 h. After extensive washes, inserts were filled with media containing 0.2% FBS, and placed into wells containing media containing 10% FBS.​ Serum-starved MDA-MB-231 cells were seeded onto matrigel or control inserts without matrigel. After 12h, cells which had invaded through matrigel were fixed and stained using methanol/crystal violet. Percent invasion was determined by dividing the no. of cells invaded through matrigel to cells that migrated through the control insert. ​(d) Serum-induced cell migration assay; HUVECs were grown to ~90% confluence in each well of a 24-well plate containing endothelial media. The cell monolayer was scratched with a p200 pipette tip. The media was removed and replaced with unsupplemented media, or supplemented media with equimolar doses (100 μM) of the indicated compound. The closure of the scratch was monitored by light microscopy. (e) Photographs of (d) at time 0 and 6h were analyzed with Image J.
Fig. 4.
Fig. 4.
Plots of the scattered light intensity versus the concentration of WC (left panel) or [Co(NH3)6]3+ (right panel) in the presence of CT DNA (●) or tRNA (■). The calculated EC50 values (μM) are 0.23 ± 0.01 and 0.31 ± 0.02 for WC DNA and tRNA condensation respectively. For [Co(NH3)6]3+, the equivalent values are 35 ± 4 and > 70 for CT DNA and tRNA respectively.
Fig. 5.
Fig. 5.
Top: Representative AFM images of linearized plasmid pSP73 DNA in the presence of WC at (A) 1.56, (B, C) 3.125 and (D) 6.25 μM. Bottom: Representative AFM images of tRNA in the presence of WC at (A) 6.25 and (B-D) 12.5 μM. The protocol followed published procedures [–29].
Fig. 6:
Fig. 6:
Plots of the relative transcriptional activity of pBR322 plasmid DNA as a function of Cobalt complex concentrations. Transcription and detection of RNA products was performed according to the procedure described in [27,30].
Fig. 7.
Fig. 7.
Antiviral Activity of WC. Left, anti-HCMV activity and cytotoxicity of WC was determined using luciferase-based assays. Right, 10 μM WC does not inhibit viral-encoded GFP-expression (top), immediate early protein (IE) expression (middle), or late protein pp28 expression (bottom). See SI for details.
Fig. 8.
Fig. 8.
Time of Addition Studies. Confluent monolayers of MRC-5 fibroblasts were treated with 8 μM BAY 38–4766, 150 μg/ml heparin, or 25 μM WC 1 h before, concurrent with, or at various times after infection with luciferase-tagged HCMV RC2626 (125 PFU/well). Following incubation for five days, 100 μL of culture media was removed from each well and transferred to wells of a fresh 96-well plate containing confluent uninfected MRC-5 cells. Following an additional two-day incubation, luciferase expression was quantified. Data are means of triplicate wells ± standard deviations.

References

    1. Farrell NP. “Medicinal Inorganic Chemistry. New Perspectives and Targets for the Periodic Table.” Adv. Inorg. Chem. (AINC) 2020, Vol. 75. A thematic volume devoted to ‘Medicinal Chemistry’; Eds. van Eldik R and Sadler PJ. pp 57–86.
    1. Komeda S, Moulaei T, Woods KK, Chikuma M, Farrell N, Williams LD. J. Amer. Chem. Soc 2006, 128, 16092–16103. - PubMed
    1. Komeda S, Qu Y, Mangrum JB, Hegmans A, Williams LD, Farrell, NP NP. Inorg. Chim. Acta 2016, 452, 25–33.
    1. Calnan BJ, Tidor B, Biancalana S, Hudson D, Frankel AD. Science 1991, 252, 1167–1171. - PubMed
    1. Gorle A, Haselhorst T, Katner SJ, Everest-Dass AV, Hampton JD, Peterson EJ, Koblinski JE, Katsuta E, Takabe K, von Itzstein M, Berners-Price SJ, Farrell NP. Angew. Chem. Intl. Edn 202010.1002/anie.202013749. - DOI - PMC - PubMed

Publication types

MeSH terms

LinkOut - more resources