. 2021 Jun;8(11):e2003743.
doi: 10.1002/advs.202003743. Epub 2021 Mar 18.

AIDeveloper: Deep Learning Image Classification in Life Science and Beyond

Affiliations

AIDeveloper: Deep Learning Image Classification in Life Science and Beyond

Martin Kräter et al. Adv Sci (Weinh). 2021 Jun.

Abstract

Artificial intelligence (AI)-based image analysis has increased drastically in recent years. However, all applications use individual solutions, highly specialized for a particular task. Here, an easy-to-use, adaptable, and open source software, called AIDeveloper (AID) to train neural nets (NN) for image classification without the need for programming is presented. AID provides a variety of NN-architectures, allowing to apply trained models on new data, obtain performance metrics, and export final models to different formats. AID is benchmarked on large image datasets (CIFAR-10 and Fashion-MNIST). Furthermore, models are trained to distinguish areas of differentiated stem cells in images of cell culture. A conventional blood cell count and a blood count obtained using an NN are compared, trained on >1.2 million images, and demonstrated how AID can be used for label-free classification of B- and T-cells. All models are generated by non-programmers on generic computers, allowing for an interdisciplinary use.

Keywords: artificial intelligence; deep neural networks; graphical user interface; image processing; software.


Conflict of interest statement

The authors declare no conflict of interest.

Figures

Figure 1
Figure 1
AIDeveloper user interface and workflow. A) A representative workflow of setting up a training process. B) Representative grayscale images of all CIFAR‐10 classes (out of 6000 images per class). C) Screenshot showing the “history”‐tab of AID, which was used to load the training history file of the training process for grayscale images. The scatterplot shows the accuracy (red dots) and the validation accuracy (cyan dots) for each training iteration (also called “epoch”). Arrowheads indicate seven different real‐time user adjustments (I to VII) of image augmentation or hyper‐parameters. CNNgray indicates the model at epoch 6311, which reaches the maximum validation accuracy. D) A confusion matrix indicating the true and the predicted label when classifying the testing set of CIFAR‐10 using CNNgray. Matrix items with blue and orange color indicate correctly and incorrectly predicted classes, respectively. Representative images of incorrect predictions from model CNNgray on CIFAR‐10 of class “cat” is shown. The testing accuracy is 81.2%.
Figure 2
Figure 2
Classifying image tiles containing adipogenic differentiated mesenchymal stromal cells. A) Schematic representation of a light microscope to image cells in 2D culture. Human mesenchymal stromal cells were induced to differentiate into the adipogenic lineage and imaged following Oil Red O staining. B) Image acquisition strategy. Cells were cultured in a six‐well plate and five fixed positions within each well were imaged. Representative images of the center and edge position of two different examples are shown, indicating the variability in image color and staining quality. C) Image‐processing pipeline to obtain training data. Areas of cell differentiation were labeled and the original 320 × 320 pixels images were divided into 100 tiles (32 × 32 pixels). Tiles containing more than 5 labeled pixels were assigned to class 1, others to class 0. D) The bar graph presents the averaged validation accuracy over eight images ± S.D. The image presents the classification of a new image neither contained in the training‐set nor the validation set. The numbers indicate whether a tile was predicted to belong to class 1 (“with differentiation“) or class 0 (”without differentiation”). Scale bars = 50 µm.
Figure 3
Figure 3
Image‐based whole blood count using RT‐DC and AID. A) Schematic representation of RT‐DC, a high‐throughput imaging technology. A cell suspension is flushed through a channel constriction in a microfluidic chip. Cells are illuminated by an LED and recorded by a high‐speed camera. Multiple parameters including area and average brightness of the cells are determined in real‐time. Scale bar = 10 µm B) The brightness versus area scatter‐plot of whole blood measurements is used to distinguish populations of the major blood cells (I thrombocytes, II erythrocytes, III erythrocyte doublets, IV lymphocytes, V monocytes, VI neutrophils, and VII eosinophils).[ 29 ] Corresponding images of each population highlight the phenotype of these cells. Manual gating of these populations was carried out to assemble a dataset for training a CNN to perform an image‐based whole blood count. Scale bar = 10 µm C) The bar‐graphs present the relative fraction of enucleated cells (I thrombocytes, II erythrocytes, and III erythrocyte doublets) as well as the leucocytes (IV lymphocytes, V monocytes, VI neutrophils, and VII eosinophils), determined using the CNN and a conventional blood count. Mean ± S.D. of 17 independent blood measurements is displayed.
Figure 4
Figure 4
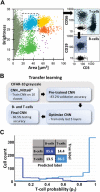
Label‐free classification of B‐ and T‐cells from human blood. A) Gating strategy for acquiring training data for B‐ and T‐cell classification. A scatter‐plot (brightness vs area) of human fractionated blood, measured using real‐time deformability and fluorescence cytometry (RT‐FDC) is shown. Lymphocytes were gated (dashed square) based on brightness and area.[ 29 ] B‐ and T‐cells were labeled according to standard surface CD markers (CD3—T‐cells, CD19—B‐cells, and CD56—NK‐cells). B) A representative schema of a transfer learning process, which can be easily applied in AID. The pre‐trained CNNgray, with a validation accuracy of 83.2% on the CIFAR‐10 dataset, was loaded into AID and optimized to classify images of B‐ and T‐cells, acquired from fractionated blood using RT‐FDC. A final validation accuracy of 89.3% and a testing accuracy of 86.2% was achieved. C) Confusion matrix of B‐ versus T‐cells as well as the probability histogram showing the performance of the model on the testing set. The abscissa in the histogram shows the predicted probability to be a T‐cell (p T).

References

    1. Jones T. R., Kang I., Wheeler D. B., Lindquist R. A., Papallo A., Sabatini D. M., Golland P., Carpenter A. E., BMC Bioinformatics 2008, 9, 482. - PMC - PubMed
    1. Schindelin J., Arganda‐Carreras I., Frise E., Kaynig V., Longair M., Pietzsch T., Preibisch S., Rueden C., Saalfeld S., Schmid B., Tinevez J.‐Y., White D. J., Hartenstein V., Eliceiri K., Tomancak P., Cardona A., Nat. Methods 2012, 9, 676. - PMC - PubMed
    1. Schneider C. A., Rasband W. S., Eliceiri K. W., Nat. Methods 2012, 9, 671. - PMC - PubMed
    1. Nitta N., Sugimura T., Isozaki A., Mikami H., Hiraki K., Sakuma S., Iino T., Arai F., Endo T., Fujiwaki Y., Fukuzawa H., Hase M., Hayakawa T., Hiramatsu K., Hoshino Y., Inaba M., Ito T., Karakawa H., Kasai Y., Koizumi K., Lee S., Lei C., Li M., Maeno T., Matsusaka S., Murakami D., Nakagawa A., Oguchi Y., Oikawa M., Ota T., Shiba K., Shintaku H., Shirasaki Y., Suga K., Suzuki Y., Suzuki N., Tanaka Y., Tezuka H., Toyokawa C., Yalikun Y., Yamada M., Yamagishi M., Yamano T., Yasumoto A., Yatomi Y., Yazawa M., Di Carlo D., Hosokawa Y., Uemura S., Ozeki Y., Goda K., Cell 2018, 175, 266. - PubMed
    1. Buggenthin F., Buettner F., Hoppe P. S., Endele M., Kroiss M., Strasser M., Schwarzfischer M., Loeffler D., Kokkaliaris K. D., Hilsenbeck O., Schroeder T., Theis F. J., Marr C., Nat. Methods 2017, 14, 403. - PMC - PubMed

Publication types

MeSH terms

LinkOut - more resources