. 2021 Jun;8(11):e2003897.
doi: 10.1002/advs.202003897. Epub 2021 Mar 23.

Single-Cell Transcriptome Analysis Uncovers Intratumoral Heterogeneity and Underlying Mechanisms for Drug Resistance in Hepatobiliary Tumor Organoids

Affiliations

Single-Cell Transcriptome Analysis Uncovers Intratumoral Heterogeneity and Underlying Mechanisms for Drug Resistance in Hepatobiliary Tumor Organoids

Yan Zhao et al. Adv Sci (Weinh). 2021 Jun.

Abstract

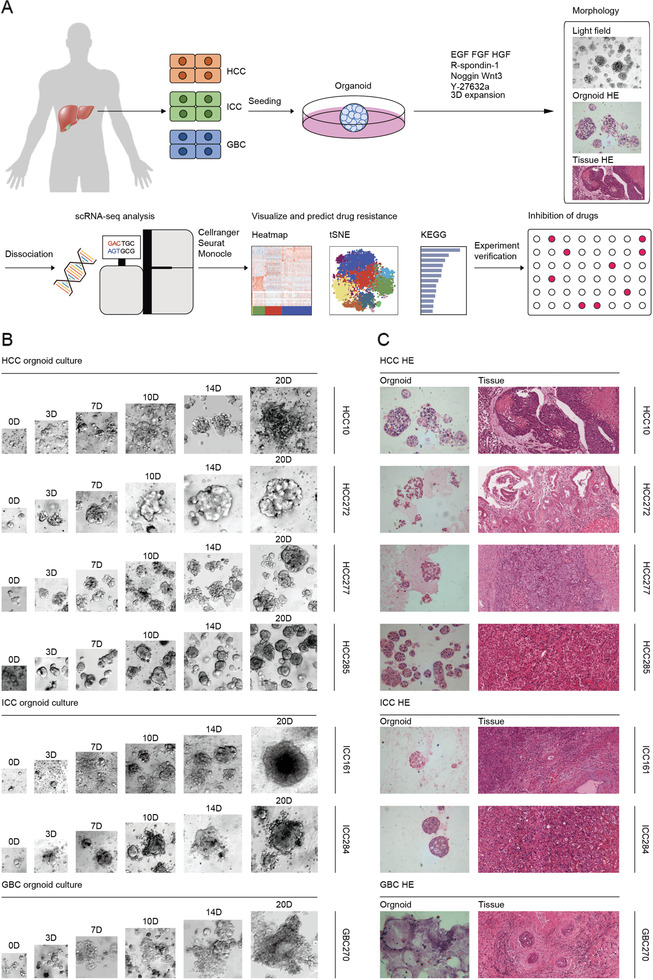
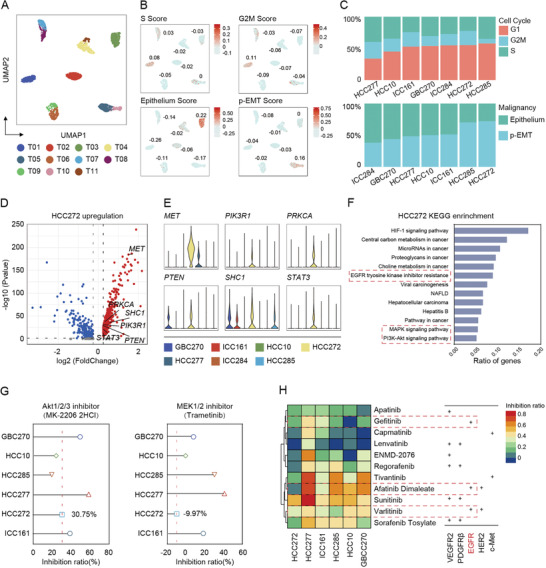
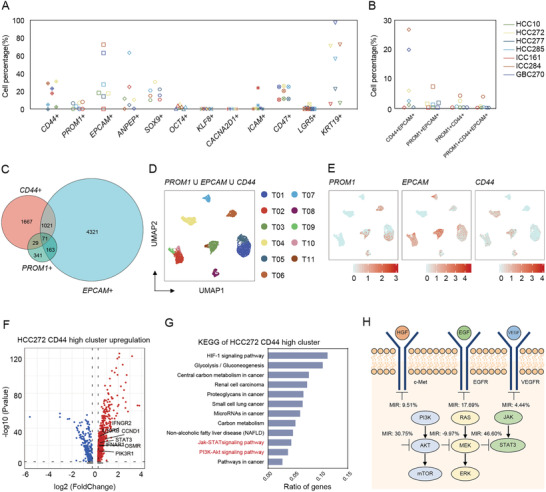
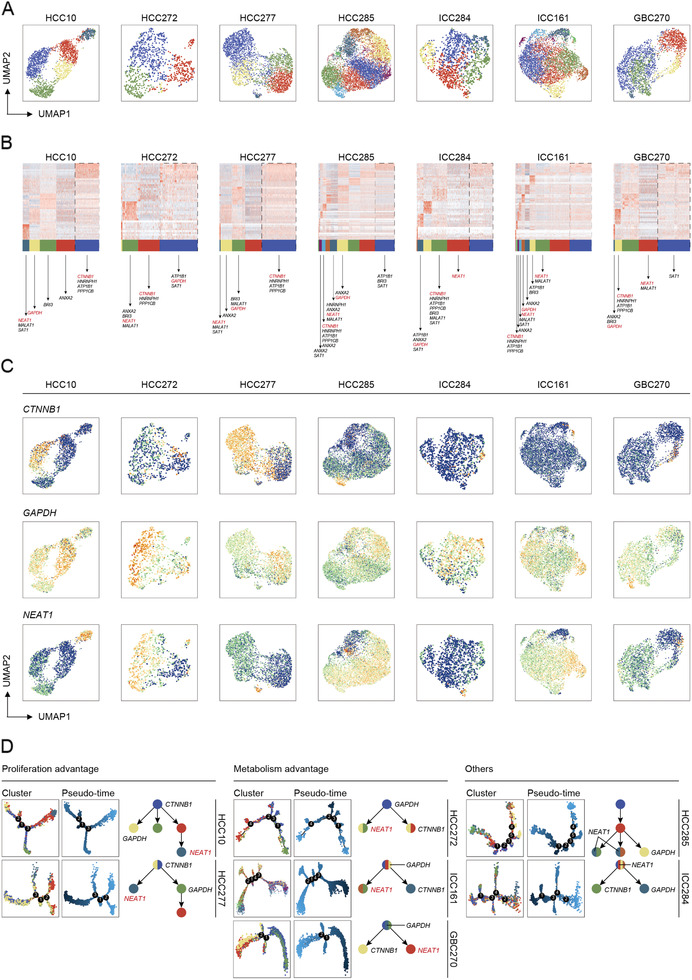
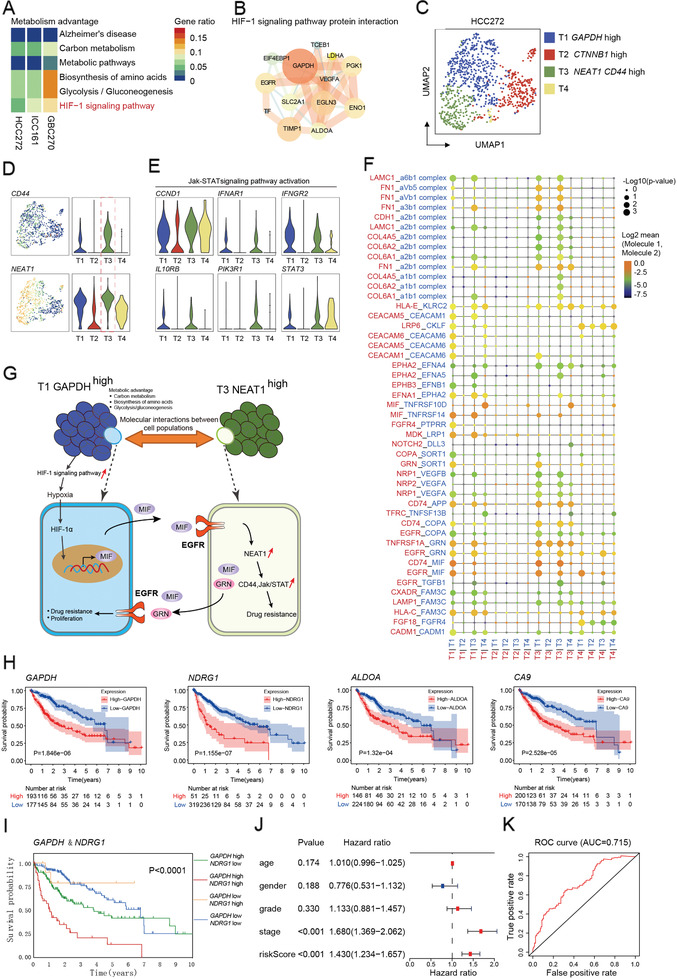
Molecular heterogeneity of hepatobiliary tumor including intertumoral and intratumoral disparity always leads to drug resistance. Here, seven hepatobiliary tumor organoids are generated to explore heterogeneity and evolution via single-cell RNA sequencing. HCC272 with high status of epithelia-mesenchymal transition proves broad-spectrum drug resistance. By examining the expression pattern of cancer stem cells markers (e.g., PROM1, CD44, and EPCAM), it is found that CD44 positive population may render drug resistance in HCC272. UMAP and pseudo-time analysis identify the intratumoral heterogeneity and distinct evolutionary trajectories, of which catenin beta-1 (CTNNB1), glyceraldehyde-3-phosphate dehydrogenase (GAPDH), and nuclear paraspeckle assembly transcript 1 (NEAT1) advantage expression clusters are commonly shared across hepatobiliary organoids. CellphoneDB analysis further implies that metabolism advantage organoids with enrichment of hypoxia signal upregulate NEAT1 expression in CD44 subgroup and mediate drug resistance that relies on Jak-STAT pathway. Moreover, metabolism advantage clusters shared in several organoids have similar characteristic genes (GAPDH, NDRG1 (N-Myc downstream regulated 1), ALDOA, and CA9). The combination of GAPDH and NDRG1 is an independent risk factor and predictor for patient survival. This study delineates heterogeneity of hepatobiliary tumor organoids and proposes that the collaboration of intratumoral heterogenic subpopulations renders malignant phenotypes and drug resistance.

Keywords: drug resistance; hepatobiliary tumor organoid; single-cell analysis; tumor ecosystem; tumor heterogeneity.


Conflict of interest statement

The authors declare no conflict of interest.

Figures

Figure 1
Figure 1
Establishment of organoids from patient‐derived hepatobiliary tumors. A) Workflow shows collection and processing of specimens of patient‐derived hepatobiliary tumor organoids for scRNA‐seq and drug screening. B) Representative bright field images of HCC, ICC, and GBC tumor organoids from seven different patients. HCC organoids form solid/compact structures, ICC tends to more irregularly shaped cyst‐like structures, and GBC organoids grow as glandular and tubular structures. Case ID was named according to histological subtypes of hepatobiliary tumor. Scale bar: 100 µm. C) Representative H&E staining of hepatobiliary tumor and derived organoid lines. Tissues generally present tumor epithelium surrounded by mesenchymal and inflammatory cells, while organoids are exclusively epithelial with tumor cell organization being remarkably well conserved. Scale bar: 200 µm. See Table 1 for detailed clinicopathological information.
Figure 2
Figure 2
Single‐cell transcriptome atlas of patient‐derived hepatobiliary tumor organoids. A) UMAP plot of all the single cells from seven patient‐derived hepatobiliary tumor organoids reveals tumor‐specific clusters. 500 cells were extracted randomly from each sample. B) UMAP plot of all the single cells colored by different score, including S Score, G2M Score, Epithelium Score, and p‐EMT Score. Related score was determined by the average expression of representative markers genes. Color key from gray to red indicates relative score levels from low to high. For scoring gene list and scoring, see Tables S5–S7 in the Supporting Information. C) The proportions of cells with different cell cycle or malignancy of each tumor organoid. D) Volcano plots of differential expression genes of HCC272. Upregulated tumoral malignancy‐related genes were labeled. E) Violin plots showing tumoral malignancy‐related genes of each tumor organoid. The width of a violin plot indicates the kernel density of the expression values. F) KEGG enrichment analysis of HCC272 participated in a wide range of cancer‐related functions. G) Forest plot depicts inhibition ratio of MK‐2206 2HCl (Akt1/2/3 inhibitor) or Trametinib (MEK1/2 inhibitor) in six organoid lines. The assessment of each drug has been independently repeated at least twice. Data were presented as mean of multiple inhibition ratios. H) Heatmap shows inhibition ratio of 11 drugs in six organoid lines. Detailed drug information is listed in Table S3 and related inhibition ratio in Table S8 in the Supporting Information. Color key from blue to red indicates relative inhibition ratio from low to high.
Figure 3
Figure 3
Characterizing individual organoid CSCs and its heterogeneity by single‐cell RNA‐seq. A) Scatterplots showing the cell percentage (%) of representative cell surface markers (reported as a stem marker of hepatobiliary system tumors) in individual organoids. Also see Table S4 in the Supporting Information. B) Scatterplots showing the cell percentage (%) of representative double or triple cell surface marker expressing cells in individual organoids (PROM1, EPCAM, and CD44). Also see Tables S9 and S10 in the Supporting Information. C) A Venn diagram is shown of single cells that expresses the representative most common hepatobiliary CSC‐like markers (PROM1, EPCAM, and CD44). D) UMAP plot of all the single cells marked by three hepatobiliary CSC‐like markers PROM1, EPCAM, and CD44. E) Expression levels of representative liver CSC‐like marker genes in each subgroup are plotted onto the UMAP map. Color key from gray to red indicates relative expression levels from low to high. The “expression level” was normalized by “logNormalize” method in “Seurat.” F) Volcano plots of differential expression genes of HCC272 CD44 high cluster. Upregulation related genes were labeled. G) KEGG‐enrichment analysis of HCC272 CD44 high cluster. H) Simplified scheme of the signaling pathway including target of used drugs and related inhibition ratio in HCC272 organoid line.
Figure 4
Figure 4
Intratumoral heterogeneity and tumor evolution trajectory of patient‐derived hepatobiliary tumor organoids. A) UMAP plot of all the single cells in individual hepatobiliary tumor organoids. Also see Table S11 in the Supporting Information. B) Heatmap shows genes (rows) that are differentially expressed in seven individual organoids clusters (columns). Ten co‐expressed genes were listed and critical genes were labeled. C) UMAP plot of all the single cells marked by CTNNB1, GAPDH, and NEAT1 in each organoid. Color key from blue to yellow indicates relative expression levels from low to high. D) Single‐cell trajectory and pseudo‐time analysis of all the seven organoids defined the proliferation advantage cluster and the metabolism advantage one.
Figure 5
Figure 5
Diversified metabolic circuitry in resistant subgroups. A) Gene set enrichment analysis of metabolism advantage subpopulation in three individual organoids. B) A simplified scheme showing protein interaction in the functional interaction network of HIF‐1 signaling pathway. The interactions were generated using ingenuity pathway analysis (IPA, Ingenuity Systems). C) UMAP representation of four subgroups generated from HCC272 organoid line. D) Left: UMAP plot of HCC272 organoid line marked by CD44 or NEAT1. Color key from blue to yellow indicates relative expression levels from low to high. Right: Violin plots depict corresponding gene expression of CD44 or NEAT1 in HCC272 organoid line. E) Violin plots of Jak‐STAT signaling pathway activation‐related genes of the subgroup in HCC272 organoid line. F) Ligand–receptor complexes specific to T1‐GAPDH high and T3‐NEAT1 high clusters using CellPhoneDB. G) Overview of molecular interactions between T1‐GAPDH high and T3‐NEAT1 high clusters in developing drug resistance in HCC272. H) KM plots of TCGA data divided by GAPDH, NDRG1, ALDOA, and CA9 expression. I) Expression of GAPDH and NDGR1 indicating different outcome in clinical. J) Forest plot of clinical indicators and riskScore (calculated by GAPDH and NDGR1). K) ROC curve of riskScore.

References

    1. Jamal‐Hanjani M., Quezada S. A., Larkin J., Swanton C., Clin. Cancer Res. 2015, 21, 1258. - PMC - PubMed
    1. Burrell R. A., McGranahan N., Bartek J., Swanton C., Nature 2013, 501, 338. - PubMed
    1. a) Meacham C. E., Morrison S. J., Nature 2013, 501, 328; - PMC - PubMed
    2. b) Clevers H., Nat. Med. 2011, 17, 313. - PubMed
    1. a) Landau D. A., Tausch E., Taylor‐Weiner A. N., Stewart C., Reiter J. G., Bahlo J., Kluth S., Bozic I., Lawrence M., Bottcher S., Carter S. L., Cibulskis K., Mertens D., Sougnez C. L., Rosenberg M., Hess J. M., Edelmann J., Kless S., Kneba M., Ritgen M., Fink A., Fischer K., Gabriel S., Lander E. S., Nowak M. A., Dohner H., Hallek M., Neuberg D., Getz G., Stilgenbauer S., et al., Nature 2015, 526, 525; - PMC - PubMed
    2. b) Nik‐Zainal S., Van Loo P., Wedge D. C., Alexandrov L. B., Greenman C. D., Lau K. W., Raine K., Jones D., Marshall J., Ramakrishna M., Shlien A., Cooke S. L., Hinton J., Menzies A., Stebbings L. A., Leroy C., Jia M., Rance R., Mudie L. J., Gamble S. J., Stephens P. J., McLaren S., Tarpey P. S., Papaemmanuil E., Davies H. R., Varela I., McBride D. J., Bignell G. R., Leung K., Butler A. P., et al., Cell 2012, 149, 994; - PMC - PubMed
    3. c) Shah S. P., Roth A., Goya R., Oloumi A., Ha G., Zhao Y., Turashvili G., Ding J., Tse K., Haffari G., Bashashati A., Prentice L. M., Khattra J., Burleigh A., Yap D., Bernard V., McPherson A., Shumansky K., Crisan A., Giuliany R., Heravi‐Moussavi A., Rosner J., Lai D., Birol I., Varhol R., Tam A., Dhalla N., Zeng T., Ma K., Chan S. K., et al., Nature 2012, 486, 395. - PMC - PubMed
    1. a) Navin N. E., Genome Res. 2015, 25, 1499; - PMC - PubMed
    2. b) Tanay A., Regev A., Nature 2017, 541, 331. - PMC - PubMed

Publication types

MeSH terms