

COVID-19 in northeast Brazil: first year of the pandemic and uncertainties to come
- PMID: 34105604
- PMCID: PMC8139846
- DOI: 10.11606/s1518-8787.2021055003728
COVID-19 in northeast Brazil: first year of the pandemic and uncertainties to come
Abstract
Objective: To analyze the epidemic of COVID-19 in northeastern Brazil, one of the regions most affected by the virus.
Methods: The official data for COVID-19, from March 2020 to March 2021 in the states of the Northeast Region (NE), were used. The analysis of capital cities and states for accumulated weekly cases and confirmed deaths was made using the JoinPoint Trend Analysis application.
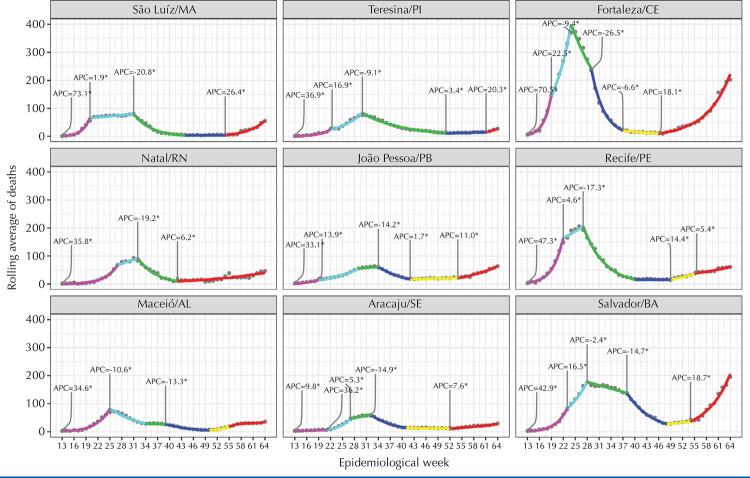
Results: In one year, the Northeast region reported 22.9% of the cases and 21.5% of the deaths in the country due to COVID-19. At the beginning of the pandemic, all states showed a growing number of cases, first in the capitals and then in the interior. Following this wave, decreases are observed in all states and their capitals, but with many still reporting a large number of cases. In the middle of the 2nd semester of 2020 the number of cases begins to increase again simultaneously in states and their capitals-some at explosive speed-especially in late 2020 and early 2021. A similar pattern is observed in deaths, which exceed or approach the peak seen in the first wave. In the first wave, all capitals and northeastern states adopted intense isolation measures. Fortaleza, Recife and Teresina reached the highest isolation index of all capitals, close to 0.60. This index decreases, with a slight growth trend until the end of December. With the exception of Fortaleza and Salvador, the other capitals fell to less than 0.40.
Conclusion: The Brazilian NE and the country are in increasingly complicated health, social and economic situations. It is necessary to speed up vaccinations and maintain non-pharmacological measures: face masks, social distancing measures and hygiene care, in addition to policies to protect workers who have lost their incomes and to subsidize small business owners.
OBJETIVO: Analisar a epidemia da covid-19 na região Nordeste do Brasil, uma das mais atingidas por essa virose.
MÉTODOS: Os dados oficiais para covid-19 dos estados do Nordeste são referentes ao período de março de 2020 a março de 2021. A análise para capitais e estados da série do acumulado semanal de casos e de óbitos confirmados foi feita com emprego do aplicativo JoinPoint Trend Analysis.
RESULTADOS: Em um ano, o Nordeste acumulou 22,9% dos casos e 21,5% dos óbitos do país pela covid-19. No início da pandemia, todos os estados apresentaram um crescimento sustentável de casos, primeiro nas capitais e depois interior. Em seguida, observam-se decréscimos em todos os estados e suas capitais, porém muitos permanecem com números elevados. Em meados do segundo semestre de 2020, o número de casos começa a crescer nos estados e suas capitais, alguns em velocidade explosiva, em especial no final de 2020 e início de 2021. Padrão similar é observado para os óbitos, os quais ultrapassaram ou aproximam-se do teto observado na primeira onda, na qual todas as capitais e estados do Nordeste adotaram intensas medidas de isolamento. Fortaleza, Recife e Teresina atingiram os maiores índices de isolamento de todas as capitais, perto de 0,60. Esse índice decresce, com tendência leve de crescimento até final de dezembro, voltando a decrescer. Com exceção de Fortaleza e Salvador, as demais capitais caíram para menos de 0,40.
CONCLUSÃO: O Nordeste brasileiro e o país estão em uma situação sanitária, social e econômica cada vez mais complexa. É necessário acelerar o processo de vacinação e manter as medidas não farmacológicas – constante uso de máscaras faciais, medidas de distanciamento e cuidados de higiene –, além de políticas de proteção aos trabalhadores que perderam as suas rendas e subsídios aos pequenos empresários.
Conflict of interest statement
Conflict of Interests: The authors declare no conflict of interest.
Figures


References
-
- 1. The Global Change Data Lab. Our world in Data. Daily confirmed deaths. Oxford (UK): Oxford Martin School/University of Oxford; 2021 [cited 2021 Mar 29]. Available from: https://ourworldindata.org/grapher/confirmed-covid-19-deaths-cumulative-...
-
- 2. The Global Change Data Lab. Our world in data. Contry-by-country data on confirmed cases. Oxford (UK): Oxford Martin School/University of Oxford/; 2021 [cited 2021 Mar 29]. Available from: https://ourworldindata.org/covid-cases#global-comparison-where-are-confi...
-
- 3. Brasil. Ministério da Saúde (BR), Secretaria de Vigilância em Saúde. Doença pelo Coronavírus COVID-19. Bol Epidemiol. 2021 [cited 2021 Feb 21_27];(52 Nº espec):1-85. Available from: https://www.gov.br/saude/pt-br/media/pdf/2021/marco/05/boletim_epidemiol...
-
- 5. Tegally H, Wilkinson E, Giovanetti M, Iranzadeh A, Fonseca W, Giandhari J, et al. Emergence and rapid spread of a new severe acute respiratory syndrome-related coronavirus 2 (SARS-CoV-2) lineage with multiple spike mutations in South Africa. medRxiv [Preprint]. 2020. 10.1101/2020.12.21.20248640 - DOI
MeSH terms
LinkOut - more resources
Full Text Sources
Medical
