

Transcriptomics Identify Thrombospondin-2 as a Biomarker for NASH and Advanced Liver Fibrosis
- PMID: 34105780
- PMCID: PMC8596693
- DOI: 10.1002/hep.31995
Transcriptomics Identify Thrombospondin-2 as a Biomarker for NASH and Advanced Liver Fibrosis
Abstract
Background and aims: NAFLD is the most common liver disease worldwide. NASH, the progressive form of NAFLD, and advanced fibrosis are associated with poor outcomes. We searched for their noninvasive biomarkers.
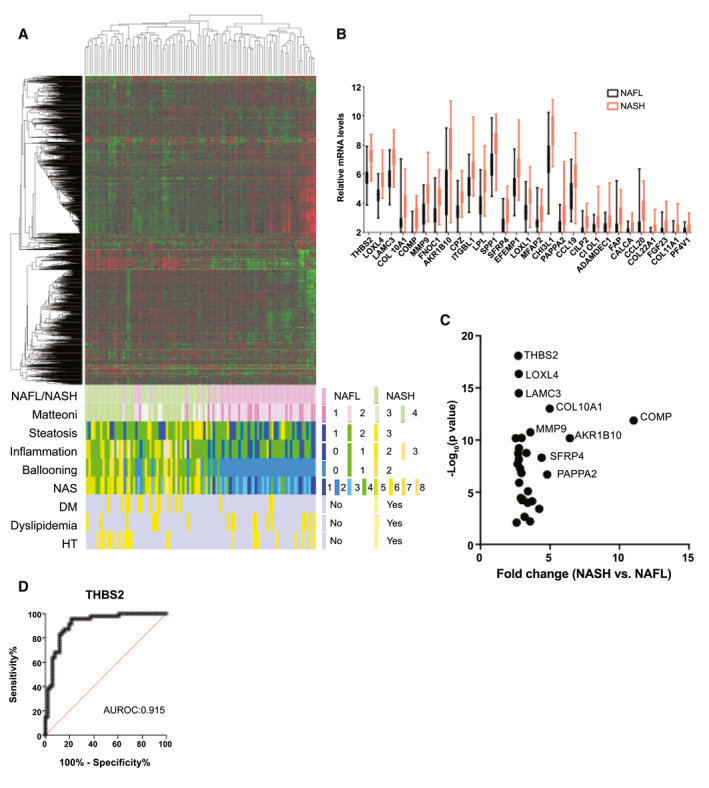
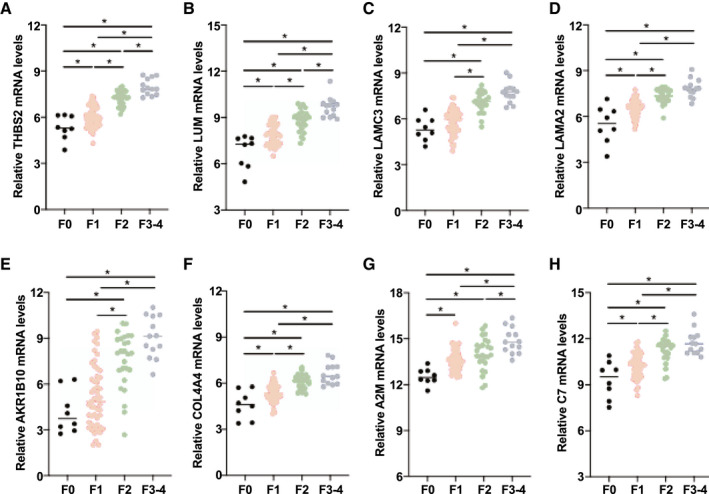
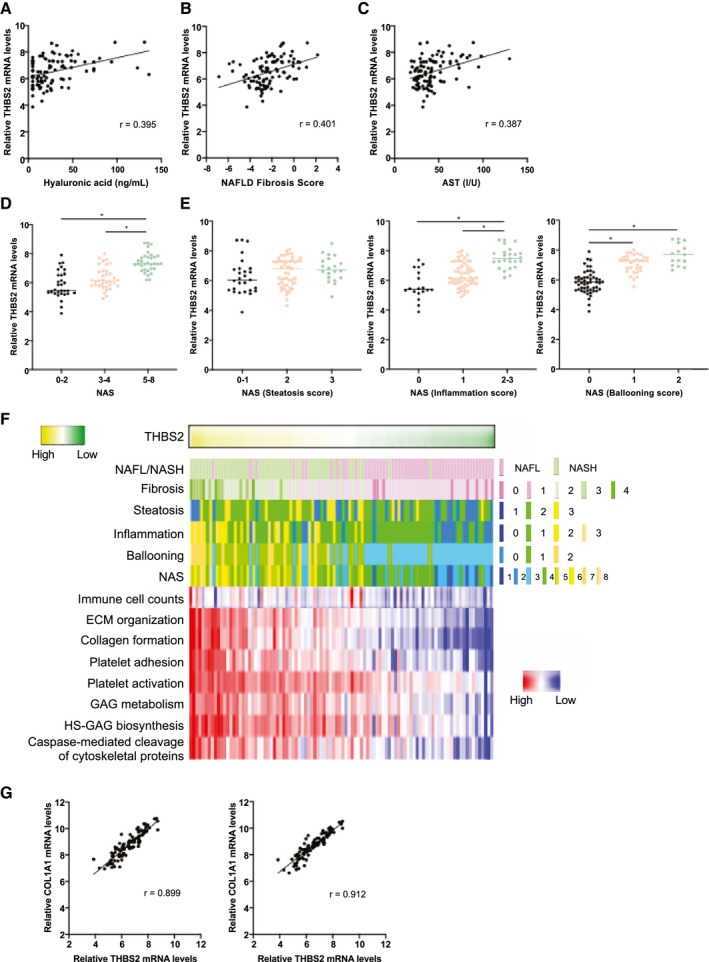
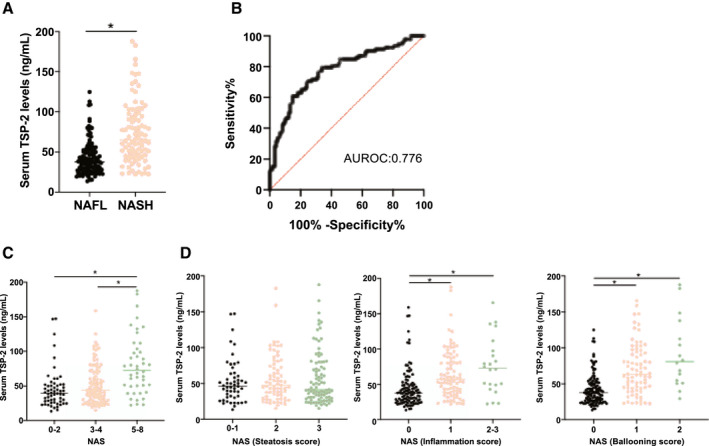
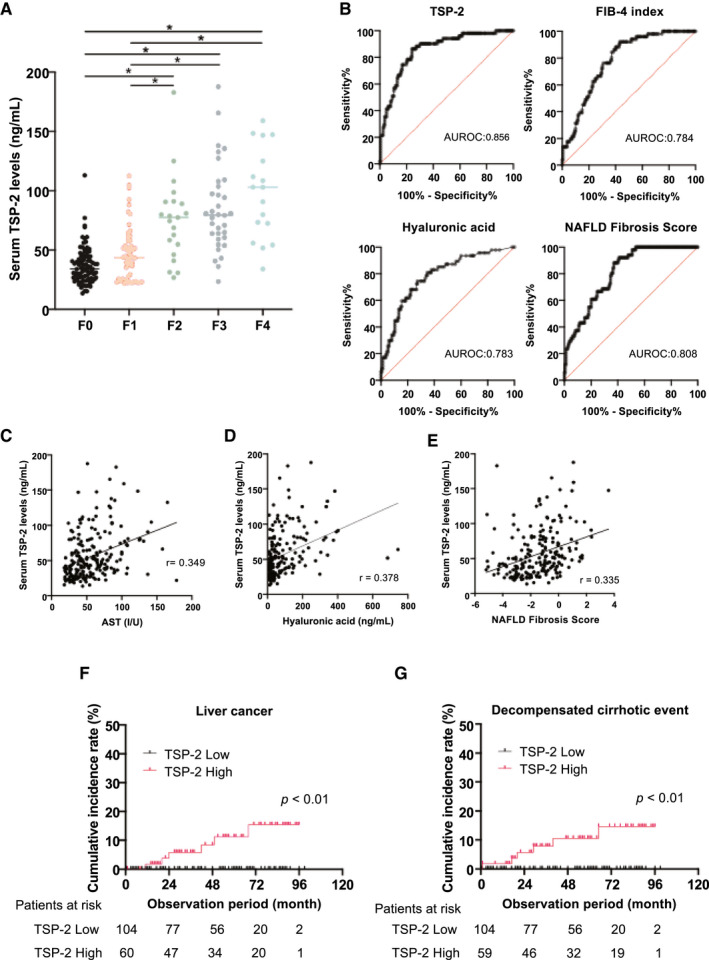
Approach and results: Global RNA sequencing of liver tissue from 98 patients with biopsy-proven NAFLD was performed. Unsupervised hierarchical clustering well distinguished NASH from nonalcoholic fatty liver (NAFL), and patients with NASH exhibited molecular abnormalities reflecting their pathological features. Transcriptomic analysis identified proteins up-regulated in NASH and/or advanced fibrosis (stage F3-F4), including matricellular glycoprotein thrombospondin-2 (TSP-2), encoded by the thrombospondin 2 (THBS2) gene. The intrahepatic THBS2 expression level showed the highest areas under the receiver operating characteristic curves (AUROCs) of 0.915 and 0.957 for diagnosing NASH and advanced fibrosis, respectively. THBS2 positively correlated with inflammation and ballooning according to NAFLD activity score, serum aspartate aminotransferase and hyaluronic acid (HA) levels, and NAFLD Fibrosis Score (NFS). THBS2 was associated with extracellular matrix and collagen biosynthesis, platelet activation, caspase-mediated cleavage of cytoskeletal proteins, and immune cell infiltration. Serum TSP-2 expression was measured in 213 patients with biopsy-proven NAFLD, was significantly higher in NASH than in NAFL, and increased parallel to fibrosis stage. The AUROCs for predicting NASH and advanced fibrosis were 0.776 and 0.856, respectively, which were comparable to Fibrosis-4 index, serum HA level, and NFS in advanced fibrosis diagnosis. Serum TSP-2 level and platelet count were independent predictors of NASH and advanced fibrosis. Serum TSP-2 levels could stratify patients with NAFLD according to the risk of hepatic complications, including liver cancer and decompensated cirrhotic events.
Conclusions: TSP-2 may be a useful biomarker for NASH and advanced fibrosis diagnosis in patients with NAFLD.
© 2021 The Authors. Hepatology published by Wiley Periodicals LLC on behalf of American Association for the Study of Liver Diseases.
Figures
Comment in
-
Reply.Hepatology. 2022 Apr;75(4):1058. doi: 10.1002/hep.32292. Epub 2022 Jan 5. Hepatology. 2022. PMID: 34927750 No abstract available.
-
Letter to the editor: Serum thrombospondin-2 as biomarker in liver diseases, a look beyond NASH.Hepatology. 2022 Apr;75(4):1056-1057. doi: 10.1002/hep.32291. Epub 2022 Jan 6. Hepatology. 2022. PMID: 34927752 No abstract available.
-
Reply.Hepatology. 2022 May;75(5):1341. doi: 10.1002/hep.32351. Epub 2022 Feb 11. Hepatology. 2022. PMID: 35066910 No abstract available.
-
Letter to the editor: Circulating thrombospondin-2 as a biomarker in patients with NAFLD with and without diabetes-Are we convinced yet?Hepatology. 2022 May;75(5):1340. doi: 10.1002/hep.32353. Epub 2022 Feb 10. Hepatology. 2022. PMID: 35075677 No abstract available.
References
-
- Cotter TG, Rinella M. Nonalcoholic fatty liver disease 2020: the state of the disease. Gastroenterology 2020;158:1851‐1864. - PubMed
-
- Hagström H, Nasr P, Ekstedt M, Hammar U, Stål P, Hultcrantz R, et al. Fibrosis stage but not NASH predicts mortality and time to development of severe liver disease in biopsy‐proven NAFLD. J Hepatol 2017;67:1265‐1273. - PubMed
-
- Taylor RS, Taylor RJ, Bayliss S, Hagström H, Nasr P, Schattenberg JM, et al. Association between fibrosis stage and outcomes of patients with nonalcoholic fatty liver disease: a systematic review and meta‐analysis. Gastroenterology 2020;158:1611‐1625.e12. - PubMed
Publication types
MeSH terms
Substances
LinkOut - more resources
Full Text Sources
Medical
Molecular Biology Databases
Miscellaneous
