

A Norrin/Wnt surrogate antibody stimulates endothelial cell barrier function and rescues retinopathy
- PMID: 34105895
- PMCID: PMC8261507
- DOI: 10.15252/emmm.202113977
A Norrin/Wnt surrogate antibody stimulates endothelial cell barrier function and rescues retinopathy
Abstract
The FZD4:LRP5:TSPAN12 receptor complex is activated by the secreted protein Norrin in retinal endothelial cells and leads to βcatenin-dependent formation of the blood-retina-barrier during development and its homeostasis in adults. Mutations disrupting Norrin signaling have been identified in several congenital diseases leading to hypovascularization of the retina and blindness. Here, we developed F4L5.13, a tetravalent antibody designed to induce FZD4 and LRP5 proximity in such a way as to trigger βcatenin signaling. Treatment of cultured endothelial cells with F4L5.13 rescued permeability induced by VEGF in part by promoting surface expression of junction proteins. Treatment of Tspan12-/- mice with F4L5.13 restored retinal angiogenesis and barrier function. F4L5.13 treatment also significantly normalized neovascularization in an oxygen-induced retinopathy model revealing a novel therapeutic strategy for diseases characterized by abnormal angiogenesis and/or barrier dysfunction.
Keywords: Norrin; Wnt signaling; blood-retina barrier; endothelial cells; retinopathy.
© 2021 The Authors. Published under the terms of the CC BY 4.0 license.
Conflict of interest statement
LLB, JJA, SS, SSS, and SA are shareholders of AntlerA Therapeutics.
Figures

Top: Molecular architecture of tetravalent F4L5.13. Bottom: Schematic for activation of Wnt/βcatenin signaling by F4L5.13.
Activation of βcatenin signaling by F4L5.13 or recombinant NDP (30 nM each) in HEK293T cells transfected with FZD4 and/or LRP5. Values represent fold activation of LEF/TCF reporter gene. Data are presented as mean ± SEM, n = 3.
Dose–response curves for the activation of a LEF/TCF reporter gene in HEK293T cells transfected with plasmids encoding FZD4, LRP5 and with either GFP or TSPAN12 by serial dilutions of F4L5.13 or NDP proteins (x‐axis). Data are presented as mean ± SEM, n = 3.
RT–qPCR of Axin2 expression in bEnd.3 cells treated with serial dilutions of F4L5.13, NDP, or isotype control for 24 h. Data are presented as mean ± SEM, n = 3.
RT–qPCR of Axin2 in bEnd.3 cells treated with NDP (200 ng/ml), isotype control or F4L5.13 (1,200 ng/ml) and transfected with control, Tspan12 or Fzd4 siRNAs. Data are presented as mean ± SD, n = 3 technical replicates. Data are representative of two independent experiments.
Time course of phosphorylated Dishevelled‐3 (p‐DVL3) and βcatenin protein levels in bEnd.3 cells treated with 30 nM of F4L5.13 or NDP. Histogram represents the ratio of the DVL3 phosphorylation levels over total DVL3 protein and βcatenin levels over β‐Tubulin measured by densitometry of independent experiments. Data are presented as mean ± SEM, n = 4–6 (*P < 0.05 as compared with NT). Significance was calculated by one‐way ANOVA with Bonferroni’s multiple comparisons test (*P < 0.05 as compared with NT).

F4L5.13 is specific for FZD4, as determined by biolayer interferometry (BLI). F4L5.13 or the isotype control molecule (100 nM) was tested for binding to immobilized recombinant FZD CRDs or the ectodomain of the unrelated receptor Her2. BLI sensors coated with Fc were used to determine the baseline response.
Binding kinetics, as determined by BLI, for the binding of immobilized F4L5.13 to FZD4 CRD or LRP5. Experiments were performed in triplicate, and data are presented as the mean ± SD.
F4L5.13 selectively binds to LRP5 over LRP6. LRP5/6 proteins coated on a maxisorp plate are recognized in a concentration‐responsive manner by F4L5.13 but not by a non‐targeting IgG control (4275). F4L5.13 binds to LRP5 with a low nanomolar EC50 value and is > 50‐fold selective for LRP5 over LRP6. Data are presented as the mean ± SD from three independent experiments.
Activation of βcatenin signaling by WNT3A, F4L5.13, or recombinant NDP (30 nM each) in HEK293T cells transfected with plasmids encoding FZD4 and/or LRP5. Values represent fold activation of LEF/TCF reporter gene. Data are presented as mean ± SEM, n = 3.
Binding of F4L5.13 to the cell surface of HEK293T cells overexpressing FZD4 and LRP5 by flow cytometry. Data are representative of two experiments.

- A, B
RT–qPCR of Tspan12 (A) and Fzd4 (B) mRNA expression in bEnd.3 cells transfected with scrambled, Fzd4‐ or Tspan12‐targeting siRNA and treated or not with isotype control, F4L5.13 or NDP for 24 h. Data are presented as mean ± SD, n = 2 technical replicates. Data are representative of two independent experiments.
- C
RT–qPCR of Axin2 in bEnd.3 cells transfected with control or Lrp5‐targeting siRNAs and treated or not with isotype control, F4L5.13 or NDP for 24 h. Data are presented as mean ± SD, n = 3 technical replicates. Data are representative of two independent experiments.
- D
RT–qPCR of Lrp5 mRNA expression in bEnd.3 cells transfected with scrambled or Lrp5 siRNA and treated or not with isotype control, F4L5.13 or NDP for 24 h. Data are presented as mean ± SD, n = 3 technical replicates. Data are representative of two independent experiments.
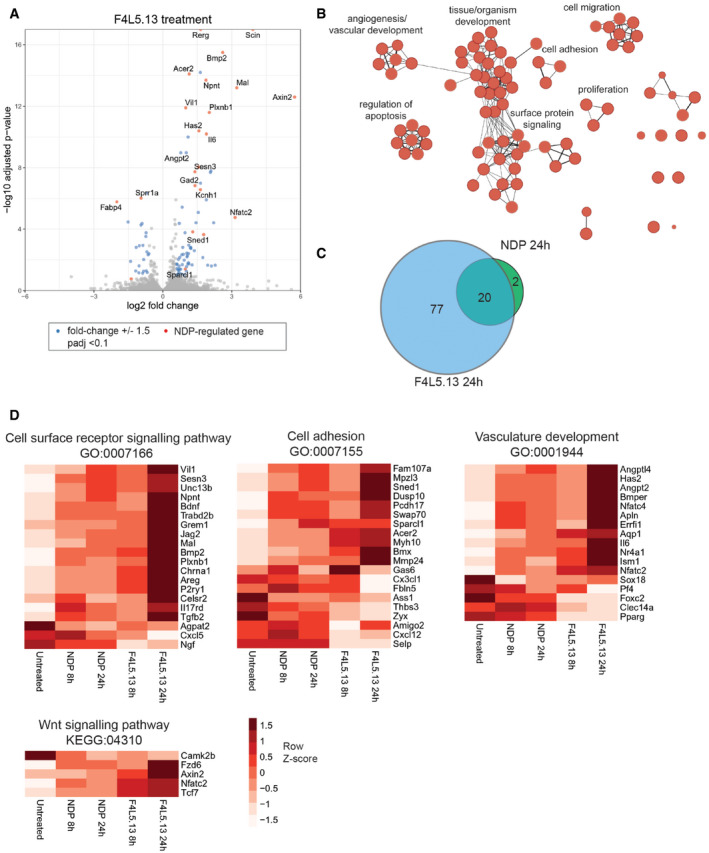
Volcano plot of gene expression changes in bEnd.3 cells following 24 h of treatment with 30 nM F4L5.13. Genes with significant changes in expression level are highlighted in blue and genes co‐regulated by treatment with 30 nM NDP for 24 h are highlighted in red. Statistical analysis was performed using the DESeq2 R package and adjusted P‐value (Wald test) threshold less than 0.1 was used. Labeled genes are associated with enriched GO biological processes indicated below.
Enrichment Map of overrepresented GO biological processes and pathways in genes regulated by F4L5.13. Node sizes represent the number of genes belonging to individual terms (g:SCS FDR adjusted P‐value < 0.05, gProfiler).
Venn diagrams showing overlap in differentially expressed genes following treatment with F4L5.13 or NDP.
Heat maps of differentially expressed genes mapping to the indicated biological processes and pathways across treatment groups in RNA‐seq experiment. Mean of n = 3 samples per group.


RT–qPCR of a panel of differentially expressed genes identified by RNA‐Seq in bEnd.3 cells treated with F4L5.13 or NDP for 8 h and 24 h. Data are presented as mean ± SEM, n = 3–5 biological replicates. Significance was calculated by one‐way ANOVA with Bonferroni’s multiple comparisons test (*P < 0.05 as compared with NT).
RT–qPCR of endothelial junctional genes in bEnd.3 cells treated with F4L5.13 or NDP for 8 h and 24 h. Data are presented as mean ± SEM, n = 3 biological replicates. Significance was calculated by one‐way ANOVA with Bonferroni’s multiple comparisons test.

Expression of endothelial junction protein ZO‐1 and stabilization of βcatenin in bEnd.3 cells treated with 30 nM F4L5.13 or 30 nM recombinant NDP for the indicated times. Blots are representative of five different experiments. Histogram represents the ratio of ZO‐1 and βcatenin levels over β‐Tubulin measured by densitometry of five independent experiments. Data are presented as mean ± SEM. Significance was calculated by one‐way ANOVA with Bonferroni’s multiple comparisons test (*P < 0.05 as compared with NT).
Immunofluorescence of ZO‐1, CLDN3, and CLDN5 localization at bEnd.3 cell junctions. bEnd.3 cells were treated or not with 30 nM F4L5.13 or 30 nM Norrin (NDP) with or without 100 ng/ml VEGF for 1 h. ZO‐1 is shown in green, CLDN3/5 in red, and DAPI in blue. Scale bars: 15 µm.
Quantification of ZO‐1, CLDN3, and CLDN5 fluorescence intensity. Each column represents 40 measurements of fluorescence intensity per condition (y‐axis). Data are presented as mean ± SEM. Significance was calculated by one‐way ANOVA with Bonferroni’s multiple comparisons test (*P < 0.05 as compared to VEGF treatment).
Transendothelial permeability assay quantifying the passage of FITC‐dextran through a monolayer of bEnd.3 cells. Passage of FITC‐dextran was measured after exposure of bEnd.3 cells to 100 ng/ml VEGF, 30 nM F4L5.13 or both or pretreated with VEGF for 1 h before treating with F4L5.13 for 1 h. Data are presented as mean ± SD, n = 5 independent experiments. Significance was calculated by one‐way ANOVA with Bonferroni’s multiple comparisons test (*P < 0.05 as compared to VEGF treatment).

F4L5.13 prevents BRB defects and restores vascular morphogenesis in Tspan12 −/− mice. 10 mg/kg F4L5.13 or isotype control antibody was injected i.p. every 48 h from P5 to P20. Multiple images acquired at 10× magnification were stitched together to create a high‐resolution image of a representative part of the retinal flat mounts. Scale bar 500 µm.
Optical sections of IB4‐stained P20 retinas showing the mouse three‐layered retinal vasculature (superficial, intermediate, and deep layers at 20× magnification) to document blood vessel formation or malformation. In Tspan12 −/− mice, the intermediate capillary layer fails to properly develop and glomeruloid vascular malformations are present. The deep capillary layer is virtually absent. F4L5.13 fully restores intraretinal capillary development in Tspan12 −/− mice. Scale bars: 100 µm.
IB4‐stained retinal cross sections show the restored retinal vasculature and the absence of misdirected angiogenesis after F4L5.13 treatment. Boxed areas are shown enlarged in the panels on the right. Scale bars: 500 µm.
Quantification of the vascularized area in the outer plexiform layer. 10 mg/kg F4L5.13 or isotype control antibody was injected every 48 h from P5 to P20. Data are presented as mean± SD, n = 5 retinas (2–4 fields of view per retina) from 4 to 5 mice per group. Significance was calculated by one‐way ANOVA with Bonferroni’s multiple comparisons test.
F4L5.13 rescues barrier function defects in Tspan12 −/− mice as shown by an increased expression of the tight junction component CLDN5 and decreased expression of the EC fenestration component PLVAP. IB4‐Alexa 647 was used to stain ECs. Scale bars: 100 µm.

Injection schema for blood–retina barrier assay in adult Tspan12 −/− mice with established retinal vascular defects.
Quantification of extravasated FITC‐dextran in retinal lysates from WT and Tspan12 −/− mice injected with isotype control antibody or F4L5.13. Data are presented as mean ± SEM, n = 6 retinas from 3 mice per group. Significance was calculated by one‐way ANOVA with Bonferroni’s multiple comparisons test (*P < 0.05 as compared to Tspan12 −/− control treatment).
Quantification of the vascularized area in adult Tspan12 −/− mice injected with isotype control or F4L5.13. Data are presented as mean± SD, n = 4 retinas (4 fields of view per retina) from 2 mice per group. P‐value was calculated by Student’s t‐test.
Flat‐mounted retinas of adult Tspan12 −/− mice injected systemically with sulfo‐NHS‐biotin show that F4L5.13 partially restored BRB function. PECAM was used to stain endothelial cells. Images are representative of 4 retinas per group. Scale bar: 500 µm.
Maximum intensity projection of adult Tspan12 −/− retinas after mice were injected with F4L5.13 or isotype control. Endothelial cells were stained with IB4‐Alexa 647. Images are representative of 4 retinas per group. Scale bar: 100 µm.

Schematic diagram of the OIR model (top) and representative images of P17 OIR retinas are shown (bottom). Neonatal mice were exposed to 75% oxygen from P7 to P12 to induce vessel loss. Then mice received intravitreal injections of PBS vehicle, mouse‐specific anti‐VEGF (as a positive control) delivered at 0.1 μg/μl, or F4L5.13v2 (a second‐generation F4L5.13 modality, in which the N‐terminal FZD4‐specific diabody was replaced with a FZD4‐specific Fab) at 50 nM or 500 nM target vitreous concentrations. Mice were returned to room air from P12 to P17 to induce maximum pathologic neovascularization at P17. At P17, retinas from injected mice were collected, dissected as flat‐mounts, and stained with Isolectin B4. Scale bar = 500 µm.
Quantification of the ratio of neovascular and avascular area on total area of vascularization. Data are presented as mean ± SEM, n = 11–13 retinas per group. Significance was calculated by one‐way ANOVA with Bonferroni’s multiple comparisons test (indicated P‐values are in comparison to Vehicle).
References
-
- Baron R, Kneissel M (2013) WNT signaling in bone homeostasis and disease: from human mutations to treatments. Nat Med 19: 179–192 - PubMed
-
- Biechele TL, Moon RT (2008) Assaying β‐Catenin/TCF transcription with β‐Catenin/TCF transcription‐based reporter constructs. Methods Mol Biol 468: 99–110 - PubMed
-
- Bray NL, Pimentel H, Melsted P, Pachter L (2016) Near‐optimal probabilistic RNA‐seq quantification. Nat Biotechnol 34: 525–527 - PubMed
Publication types
MeSH terms
Associated data
- Actions
Grants and funding
LinkOut - more resources
Full Text Sources
Other Literature Sources
Medical
Molecular Biology Databases
