. 2021 Jun 9:10:e58688.
doi: 10.7554/eLife.58688.

Tumor stiffening reversion through collagen crosslinking inhibition improves T cell migration and anti-PD-1 treatment

Affiliations

Tumor stiffening reversion through collagen crosslinking inhibition improves T cell migration and anti-PD-1 treatment

Alba Nicolas-Boluda et al. Elife. .

Abstract

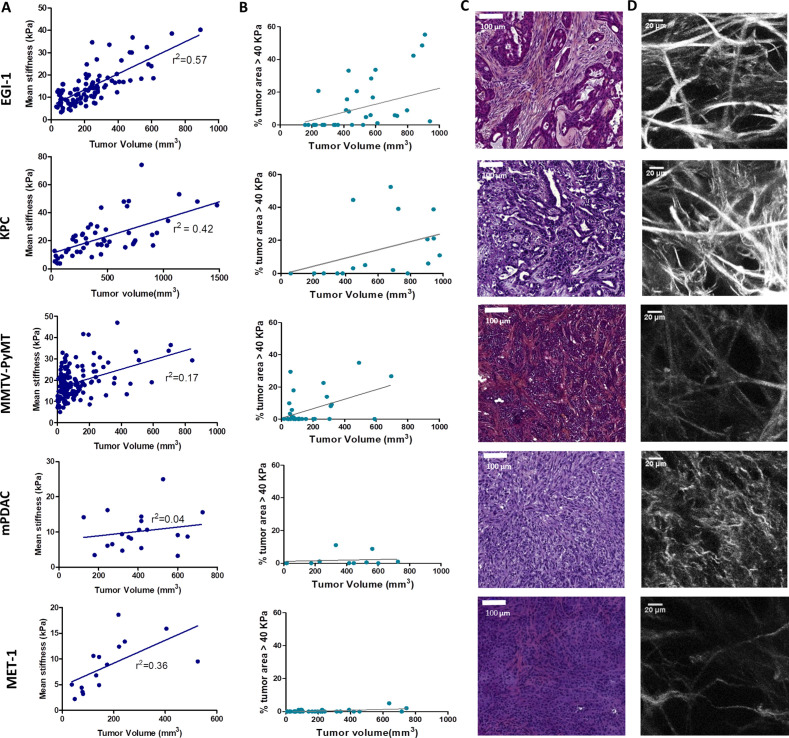
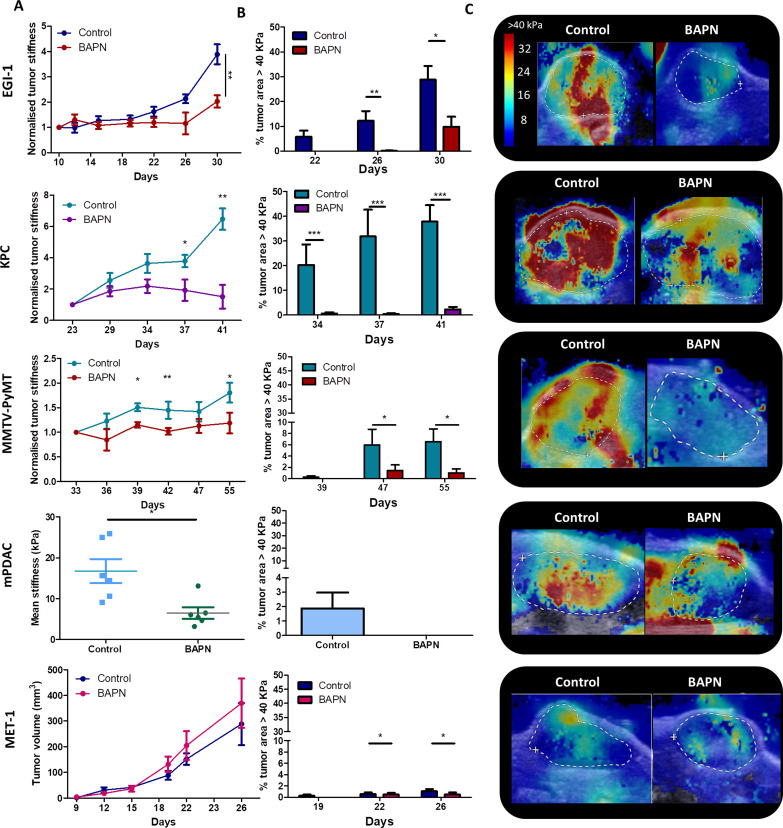
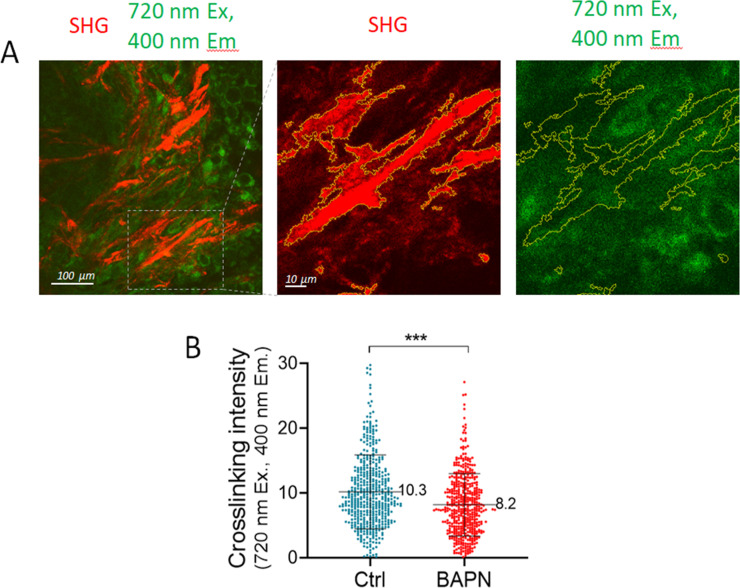
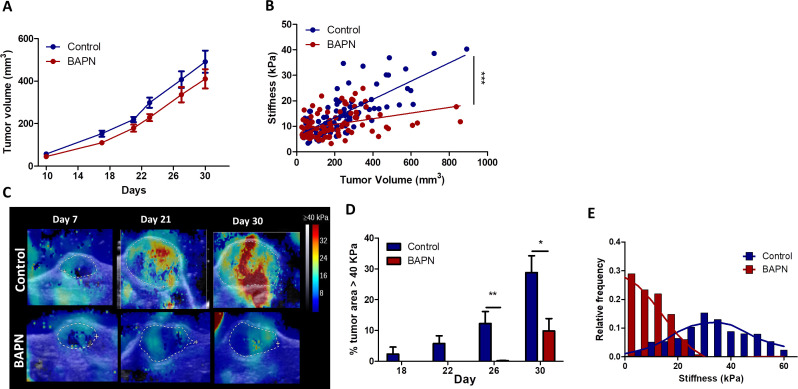
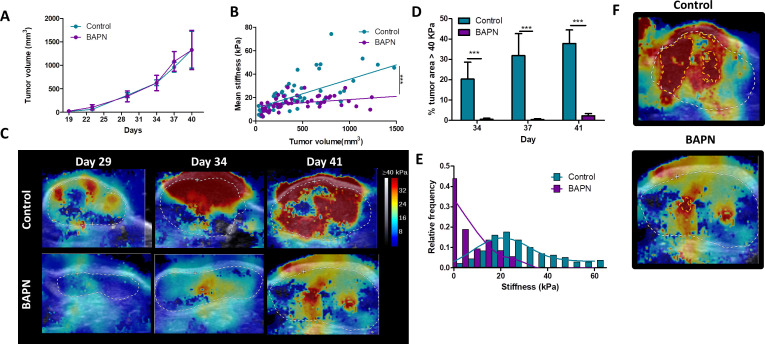
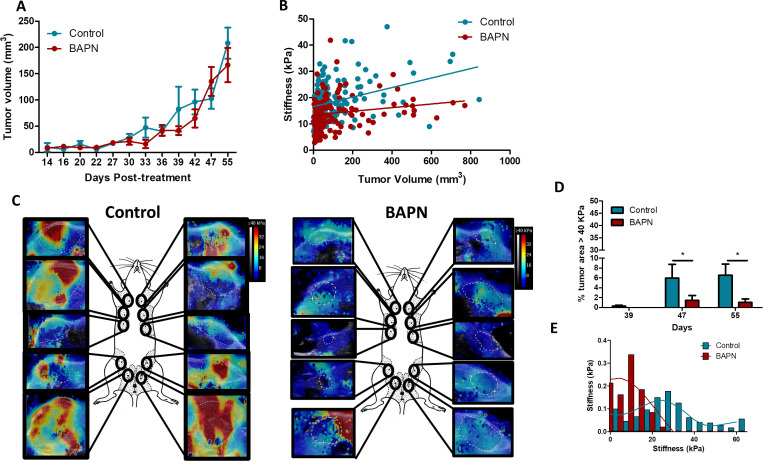
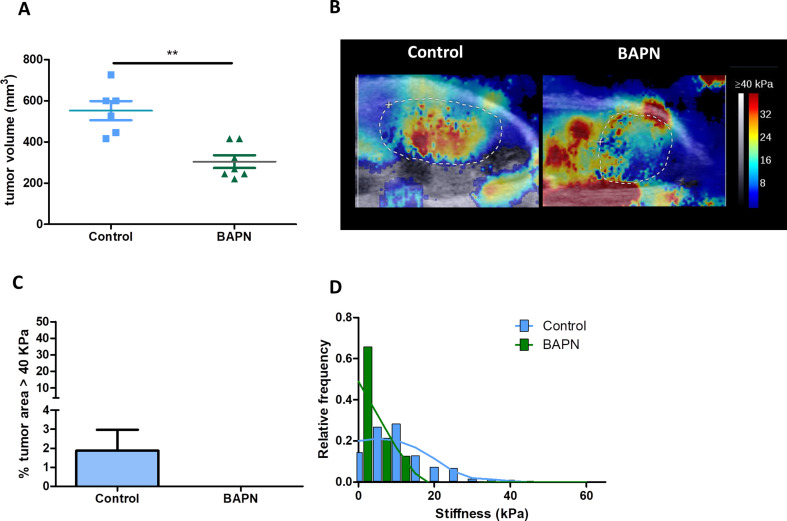
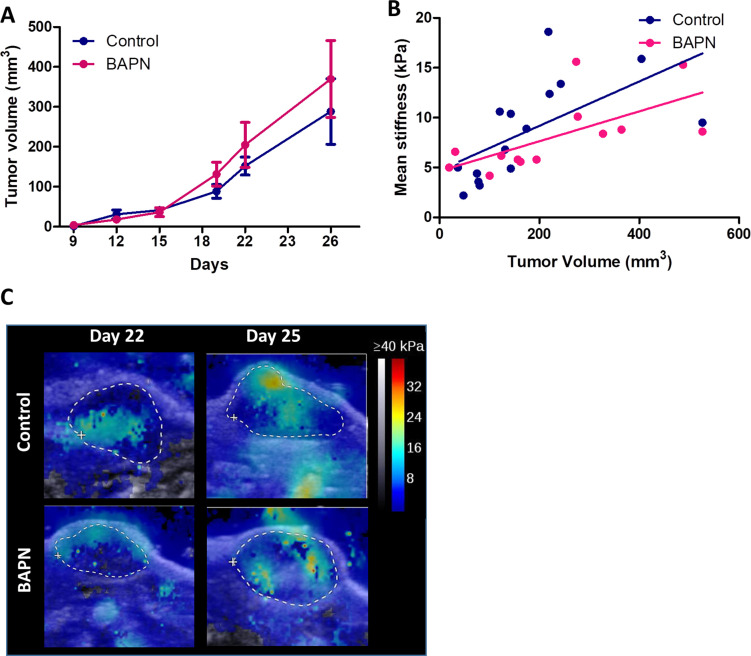
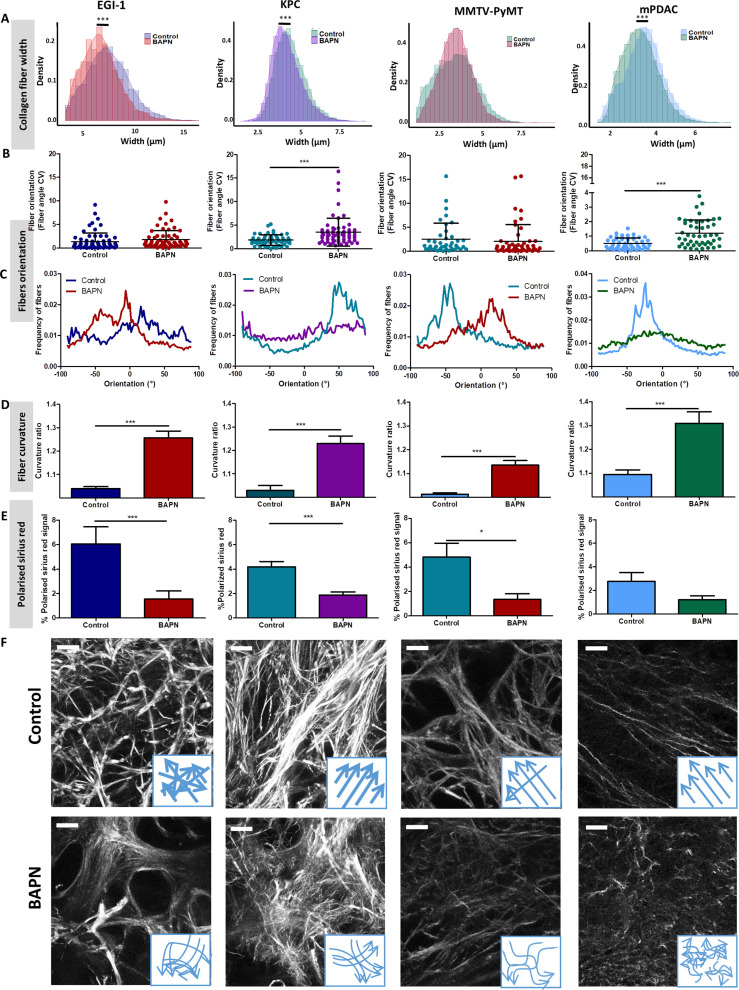
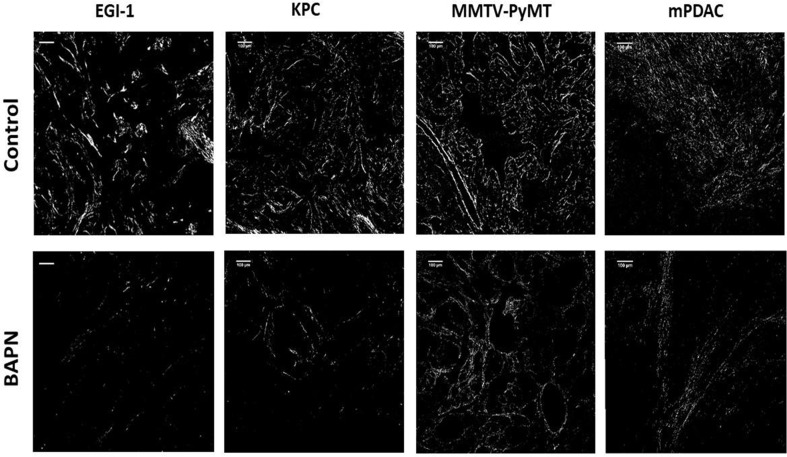
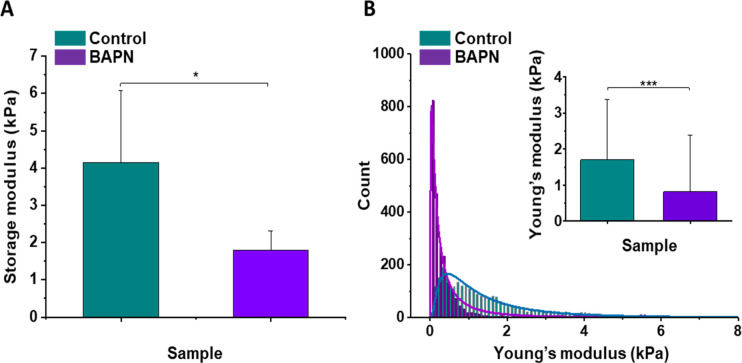
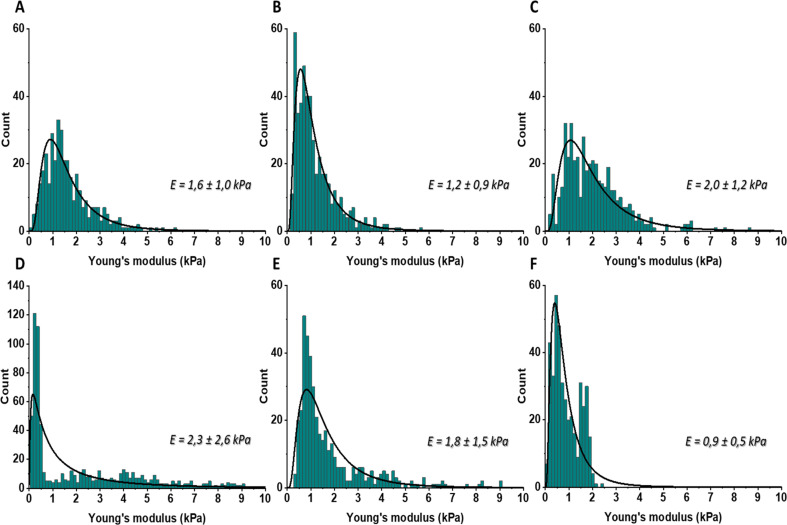
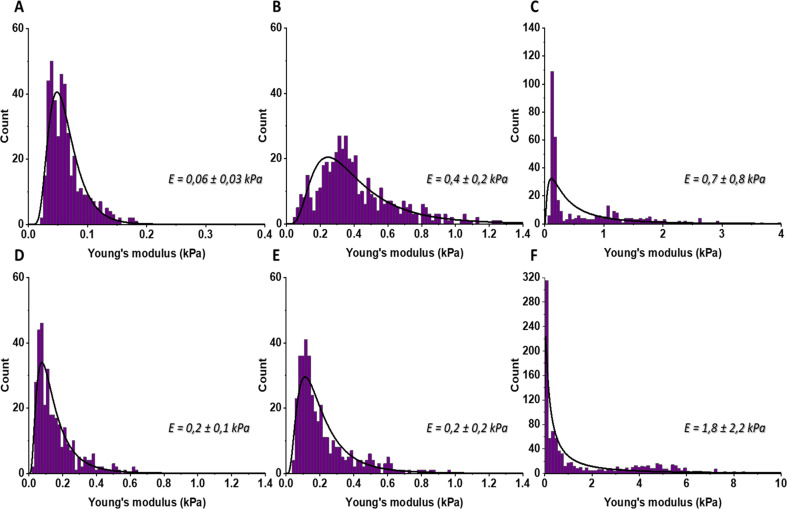
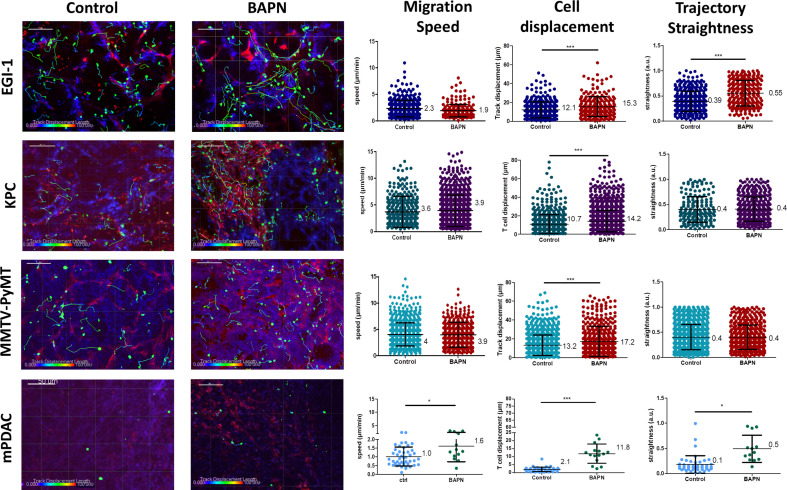
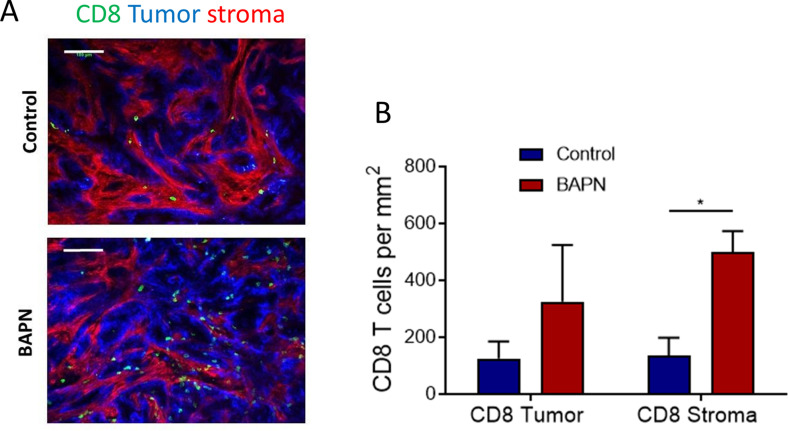
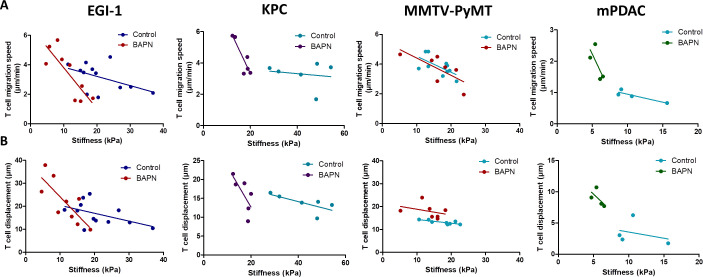
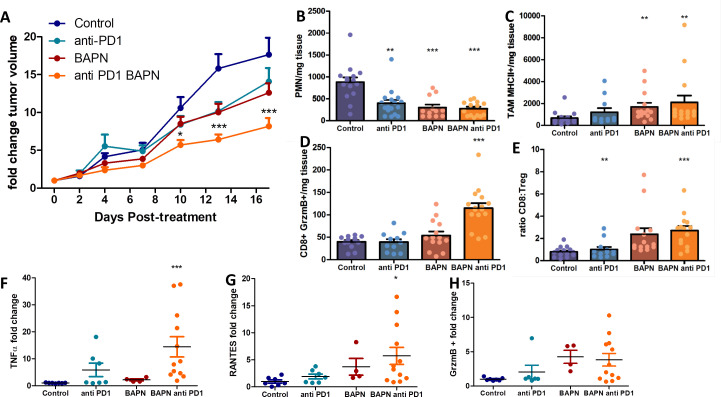
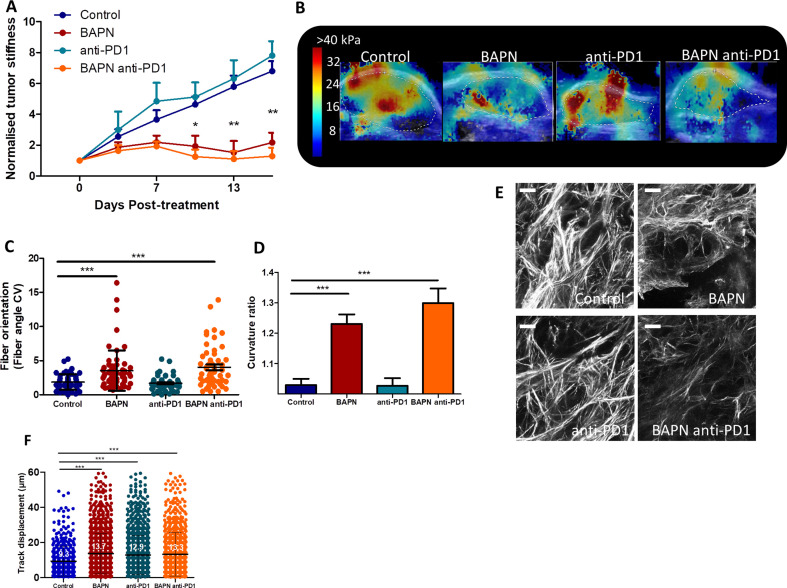
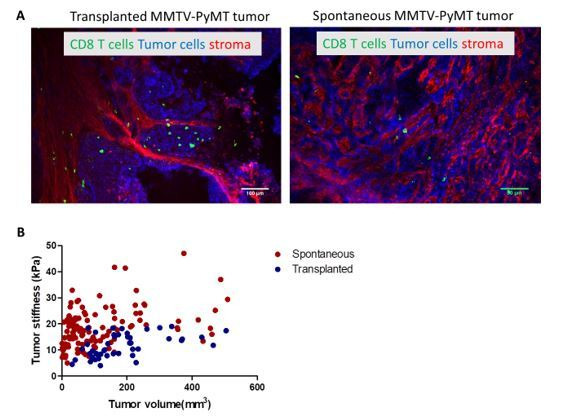
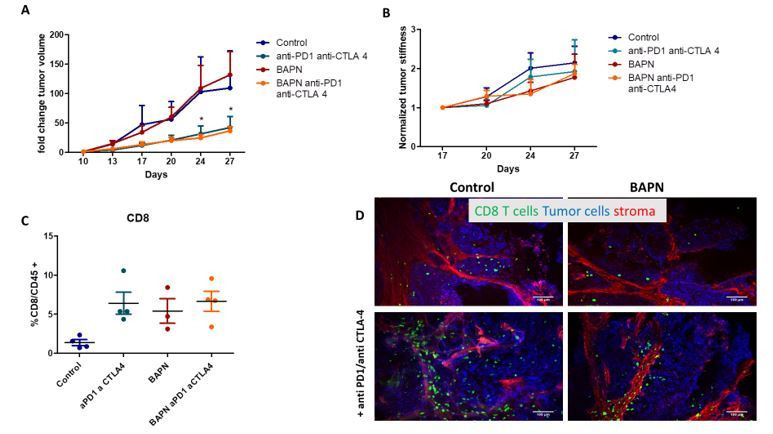
Only a fraction of cancer patients benefits from immune checkpoint inhibitors. This may be partly due to the dense extracellular matrix (ECM) that forms a barrier for T cells. Comparing five preclinical mouse tumor models with heterogeneous tumor microenvironments, we aimed to relate the rate of tumor stiffening with the remodeling of ECM architecture and to determine how these features affect intratumoral T cell migration. An ECM-targeted strategy, based on the inhibition of lysyl oxidase, was used. In vivo stiffness measurements were found to be strongly correlated with tumor growth and ECM crosslinking but negatively correlated with T cell migration. Interfering with collagen stabilization reduces ECM content and tumor stiffness leading to improved T cell migration and increased efficacy of anti-PD-1 blockade. This study highlights the rationale of mechanical characterizations in solid tumors to understand resistance to immunotherapy and of combining treatment strategies targeting the ECM with anti-PD-1 therapy.

Keywords: T lymphocytes; cancer biology; cell migration; extracellular matrix; immunotherapy; mouse; stiffness; tumor.


Conflict of interest statement

AN, JV, LV, TG, SB, CK, MP, GR, PD, KP, RB, IC, JC, LF, FG, ED No competing interests declared

Figures

Figure 1.
Figure 1.. Macroscopic and microscopic characterization of EGI-1, KPC, MMTV-PyMT, mPDAC, and MET-1 tumor models.
(A) Tumor volume and tumor mean stiffness relationship. Tumor volume was measured using a caliper or ultrasound, whilst tumor mean stiffness was measured using SWE. (B) The percentage of stiff regions in relation to tumor volume. The presence of very stiff regions with an elastic modulus > 40 kPa was quantified using data from the stiffness map extracted from the SWE images. (C) Comparison of the histological diversity within the tumor models. Representative images of each tumor model (scale bar = 100 µm). (D) SHG images of the collagen network in each of the models at the end point of the experiment. Scale bar = 20 µm. EGI-1 (n = 30 mice from three independent experiments); KPC (n = 34 mice from three independent experiments); MMTV-PyMT (n = 5 mice, 10 tumors per mouse from two independent experiments); mPDAC (n = 7 mice from two independent experiments); and MET-1 (n = 12 mice from two independent experiments).
Figure 2.
Figure 2.. Effect of LOX inhibition on tumor stiffness and tumor stroma organization in EGI-1, KPC, MMTV-PyMT, and mPDAC tumor models.
(A) Tumor stiffness measured by SWE in control and BAPN-treated (LOX inhibitor) tumors in relation to tumor volume for EGI-1, MMTV-PyMT, and KPC tumor models. For the mPDAC tumor model, stiffness was only measured at the endpoint of the experiment (*p-value<0.05, **p-value<0.01, ***p-value<0.001 Student’s t-test). (B) Percentage of tumor area with stiffness > 40 kPa at three different time points in the late stages of tumor development. (C) Illustrative examples of SWE images of each on the tumors at the last time point of the experiment (EGI-1 – day 30, KPC – day 41, MMTV-PyMT – day 55, mPDAC – day 21). EGI-1 (n = 30 mice/group from three independent experiments); KPC (n = 34 mice/group from three independent experiments); MMTV-PyMT (n = 5 mice/group, 10 tumors per mouse from two independent experiments); mPDAC (n = 7 mice/group from two independent experiments), and MET-1 (n = 12 mice/group from two independent experiments).
Figure 2—figure supplement 1.
Figure 2—figure supplement 1.. Two-photon imaging analysis of collagen crosslink density from control and BAPN-treated conditions.
(A) Two-photon images of fibrillar collagen (SHG) and collagen crosslinks (720 nm excitation, 400 nm emission) in a KPC tumor. Boxed areas are represented at higher magnification at the right. SHG-positive regions are delineated with yellow lines. (B) Quantification of collagen crosslink density in control and BAPN-treated conditions. Average fluorescence signals were measured in collagen-positive regions. Results are from two tumors of each condition. Student’s t-test: ***p<0.001.
Figure 2—figure supplement 2.
Figure 2—figure supplement 2.. Effect of LOX inhibition in EGI-1 tumor model.
(A) Evolution of tumor growth in control and treated tumors (n = 30 mice/group from three independent experiments). (B) Correlation of tumor mean stiffness and tumor volume for control and treated tumors (***p-value<0.01 ANCOVA, n = 30 mice/group from three independent experiments). (C) Representative SWE images of control and BAPN-treated tumors at days 7, 21, and 30 of treatment. (D) Percentage of the tumor with stiffness > 40 kPa in tumors at days 18, 22, 26, and 30 of treatment. (E) Representative histogram of stiffness distribution in a control and a BAPN-treated tumor at day 30.
Figure 2—figure supplement 3.
Figure 2—figure supplement 3.. Effect of LOX inhibition in KPC tumor model.
(A) Evolution of tumor growth in control and treated tumors (n = 34 mice/group from three independent experiments). (B) Correlation of mean tumor stiffness and tumor volume for control and treated tumors (***p-value<0.01 ANCOVA, n = 34 mice/group from three independent experiments). (C) Representative SWE images of control and BAPN-treated tumors at days 29, 34, and 41 of treatment. (D) Percentage of the tumor with stiffness > 40 kPa in tumors at days 34, 37, and 41 of treatment. n = 34 mice/group from three independent experiments. (E) Representative histogram of stiffness distribution in a control and a BAPN-treated tumor at day 41. n = 34 mice/group from three independent experiments. (F) Representative SWE images of stiff regions (>40 kPa) in control and treated tumors.
Figure 2—figure supplement 4.
Figure 2—figure supplement 4.. Effect of LOX inhibition in MMTV-PyMT tumor model.
(A) Evolution of tumor growth in control and treated tumors (n = 5 mice/group, 10 tumors per mouse from two independent experiments). (B) Correlation of mean tumor stiffness and tumor volume for control and treated tumors. n = 5 mice/group, 10 tumors per mouse from two independent experiments. (C) Representative SWE images of control and BAPN-treated tumors at day 42 of treatment. (D) Percentage of the tumor with stiffness > 40 kPa in tumors at days 39, 47, and 55 of treatment. n = 5 mice/group, 10 tumors per mouse from two independent experiments. (E) Representative histogram of stiffness distribution in a control and a BAPN-treated tumor at day 55.
Figure 2—figure supplement 5.
Figure 2—figure supplement 5.. Effect of LOX inhibition in mPDAC tumor model.
(A) Tumor volume measured by ultrasound imaging, at day 21 of treatment (**p-value<0.01, Student’s t-test, n = 7 mice/group). (B) Representative SWE images of control and BAPN-treated tumors at day 21. (C) Percentage of the tumor with stiffness > 40 kPa in tumors at day 21. (D) Representative histogram of stiffness distribution in a control and a BAPN-treated tumor at day 21.
Figure 2—figure supplement 6.
Figure 2—figure supplement 6.. Effect of LOX inhibition in MET-1 tumor model.
(A) Evolution of tumor growth in control and treated tumors (n = 12 mice/group). (B) Correlation of tumor mean stiffness and tumor volume for control and treated tumors. (C) Representative SWE images of control and BAPN-treated tumors at day 26 of treatment.
Figure 3.
Figure 3.. Effect of LOX inhibition on ECM architecture in EGI-1, KPC, MMTV-PyMT, and mPDAC tumor models.
(A) Collagen fiber width distribution measured from SHG images (***p-value<0.001, Student’s t-test, 50–70 images/tumor, n = 3 mice/group from three independent experiments). (B) Fiber orientation defined by the coefficient of variation (CV) (***p-value<0.001, Student’s t-test, 40–50 images/tumor, n = 3 mice/group from three independent experiments). (C) Representative example of fiber orientation distribution. (D) Collagen fiber curvature defined by the curvature ratio (***p-value<0.001, Student’s t-test, 40–50 images/tumor, n = 3 mice/group from three independent experiments). (E) Percentage of red-orange birefringent fibers combining Red Sirius staining and polarized microscopy, orange-red fibers correspond to thick and packed regions (*p-value<0.05, ***p-value<0.001, Student’s t-test, 20–30 images/tumor, n = 3 mice/group from three independent experiments). (F) SHG images of collagen networks in EGI-1, MMTV-PyMT, mPDAC, and KPC control and BAPN-treated tumors. Illustrative scheme indicating the changes in width, orientation and curvature of collagen fibers induced by BAPN treatment. Scale bar = 50 µm. Images are representative of three experiments.
Figure 3—figure supplement 1.
Figure 3—figure supplement 1.. Combination of Sirius Red staining and polarized microscopy.
Surface covered by red-orange birefringent fibers that correspond to thick and packed regions in EGI-1 MMTV-PyMT, mPDAC, and KPC tumor models. Scale bar = 100 µm.
Figure 4.
Figure 4.. Mechanical properties of the mouse pancreatic ductal adenocarcinoma KPC tumor model and effects of LOX inhibition.
(A) Rheological properties of tumor samples measured using a plate shear rheometer. Mean storage modulus (G’) for all control and BAPN-treated samples ± SD are presented (for 5% sample compression). (B) The Young’s modulus values distributions obtained for all control and treated tumor samples using the AFM indentation technique. Inset in (B) shows tissues’ Young’s modulus mean values ± standard deviation to highlight the difference between control and BAPN tissues. Statistical significance was determined using a two-tailed Student’s t-test for overall values (***p-value<0.001, Student’s t-test, n = 6 tumors/group from three AFM experiments; *p-value<0.05, Student’s t-test, n = 5 tumors/group from three rheometer experiments).
Figure 4—figure supplement 1.
Figure 4—figure supplement 1.. The distributions of Young’s moduli obtained for the control mouse pancreatic ductal adenocarcinoma.
KPC tumor model (control) using AFM indentation technique with maximal indentation depth by AFM probe equal 2 µm. Distributions were fitted with the probability density function of the log-normal distribution and corresponding mean ± SD values are presented on the right side of each distribution.
Figure 4—figure supplement 2.
Figure 4—figure supplement 2.. The distributions of Young’s moduli obtained for the BAPN-treated mouse pancreatic ductal adenocarcinoma.
KPC tumor model (BAPN) using AFM indentation technique with maximal indentation depth by AFM probe equal 2 µm. Distributions were fitted with the probability density function of the log-normal distribution and corresponding mean ± SD values are presented on the right side of each distribution.
Figure 5.
Figure 5.. Impact of LOX inhibition on T cell migration in EGI-1, MMTV-PyMT, mPDAC, and KPC tumor models.
Migration of activated PBT plated onto fresh tumor slices was analyzed in EGI-1 and MMTV-PyMT tumor model, whilst resident tumor-infiltrating T lymphocytes were analyzed in mPDAC and KPC tumor model. Illustrative images of T cell migration tracks in EGI-1, MMTV-PyMT, mPDAC, and KPC tumor models. Tumor stroma (fibronectin) in red, tumor cells (EpCAM in EGI-1, MMTV-PyMT, and KPC tumor models, CD44 in mPDAC tumor models), in blue and T cells (CD8 in mPDAC and KPC, Calcein in MMTV-PyMT, and EGI-1 tumor models) in green. Tracks are color-coded to illustrate track displacement. Scale bar = 100 µm. T cell migration speed, T cell displacement, and trajectory straightness in all tumor models. ***p-value>0.001, p-value>0.05, Student’s t-test. Results are shown as mean ± SD.
Figure 5—figure supplement 1.
Figure 5—figure supplement 1.. BAPN treatment induces an increased infiltration of effector CD8+T cells in KPC tumors.
(A) Representative images of Control and BAPN-treated KPC tumors. Tumor cells (EpCAM) in blue, tumor stroma (fibronectin) in red, and T cells (CD8) in green. Scale bar = 100 µm. (B) Quantification of CD8+ T cells per mm2 in tumor islets and stroma regions in control and BAPN (*p<0.01, Student’s t-test, n = 2–3 mice/group).
Figure 6.
Figure 6.. Correlation between mean tumor stiffness and T cell migration parameters in EGI-1, KPC, MMTV-PyMT, and mPDAC tumor models.
(A) Correlation between mean tumor stiffness and mean T cell velocity. (B) Correlation between mean tumor stiffness and mean T cell displacement. Averaged T cell velocity and displacement were calculated from at least 50 individual cells. Each point represents values from an individual mouse. EGI-1 (n = 8 mice/group); KPC (n = 4 mice/group); MMTV-PyMT (n = 6–7 mice/group); and mPDAC (n = 4 mice/group) from two to three experiments.
Figure 7.
Figure 7.. LOX inhibition increases the efficiency of anti-PD-1 therapy in KPC tumor model.
(A) Tumor volume fold change after combination therapy of BAPN with anti-PD-1. n = 8 mice/group from two independent experiments. (B) CD11b+, Ly6G+, Ly6C+PMN/mg of tissue. (C) CD64+F4/80+MHCII+TAMs/mg of tissue. (D) CD8+ T cells/mg tissue. (E) CD8+ to FoxP3+Treg ratio. (F–H) Multiplex analysis of inflammatory chemokines (TNFα, RANTES, and GrzmB) produced by fresh KPC tumor slices kept in culture for 18 hr (*** p-value<0.001, * p-value<0.05, one-way ANOVA, Krustal Walis, n = 8 slices per condition from two independent experiments).
Figure 7—figure supplement 1.
Figure 7—figure supplement 1.. Effect of LOX inhibition and anti-PD1 therapy on tumor stiffness, stroma organization and T cell motility in KPC tumors.
(A) Tumor stiffness measured by SWE in control, BAPN, anti-PD1, and combination of BAPN and anti-PD1 treated tumors (**p-value<0.01, *p-value<0.05, one-way ANOVA, Kruskal–Walis, n = 8 mice/group from two independent experiments). (B) Illustrative examples of SWE of each of the conditions at day 17 post-treatment (experiment endpoint). (C) Fiber orientation defined by the coefficient of variation (CV) (***p-value<0.001, one-way ANOVA, Kruskal–Walis, 40–50 images/tumor, n = 3 mice/group). (D) Collagen fiber curvature defined by the curvature ratio (***p-value<0.001, one-way ANOVA, Kruskal–Walis, 40–50 images/tumor, n = 3 mice/group). (E) SHG images of collagen networks of KPC tumor models for the different conditions: control, BAPN, anti-PD1, combination BAPN, and anti-PD1. Scale bar = 50 µm. (F) Displacement of endogenous CD8 T cells in KPC tumor slices (n = 3 mice/group from two independent experiments). ***p-value>0.001, p-value>0.05, Student’s t-test. Results are shown as mean ± SD.
Figure 7—figure supplement 2.
Figure 7—figure supplement 2.. FACS sequential gating strategies.
Tumor immune infiltrating cells in KPC tumors were identified after exclusion of doublets and dead cells (live/deadneg;CD45+). Sequential gating allows for identification of CD4 and CD8 T cells (live/deadneg;CD45+;TCR+;CD4+; or CD8+) including GrzmB+, FoXP3, and PD-1 subsets (A) and TAM (live/deadneg;CD45+;CD11b+;Ly6C+/Ly6G+; CD64+/F480+), including MHC II + TAM subset (B).
Author response image 1.
Author response image 1.. (A) Confocal microscopy images of transplanted and spontaneous MMTV-PyMT tumors.
Fibronectin (red), EpCAM (tumor cells, blue) CD8 (green). (B) Correlation of tumor mean stiffness and tumor volume in spontaneous and transplanted MMTV-PyMT tumors.
Author response image 2.
Author response image 2.. Tumor fold change after combination therapy of BAPN and anti-PD1/anti-CTLA 4 in transplanted MMTV-PyMT tumor.
(B) Normalized tumor stiffness (C) %CD8+T cell/CD45+ cells (D) Confocal microscopy images Fibronectin (red), EpCAM (tumor cells, blue) CD8 (green).

References

    1. Anderson KG, Stromnes IM, Greenberg PD. Obstacles posed by the tumor microenvironment to T cell Activity: A Case for Synergistic Therapies. Cancer Cell. 2017;31:311–325. doi: 10.1016/j.ccell.2017.02.008. - DOI - PMC - PubMed
    1. Baker AM, Bird D, Welti JC, Gourlaouen M, Lang G, Murray GI, Reynolds AR, Cox TR, Erler JT. Lysyl oxidase plays a critical role in endothelial cell stimulation to drive tumor angiogenesis. Cancer Research. 2013;73:583–594. doi: 10.1158/0008-5472.CAN-12-2447. - DOI - PMC - PubMed
    1. Bordeleau F, Mason BN, Lollis EM, Mazzola M, Zanotelli MR, Somasegar S, Califano JP, Montague C, LaValley DJ, Huynh J, Mencia-Trinchant N, Negrón Abril YL, Hassane DC, Bonassar LJ, Butcher JT, Weiss RS, Reinhart-King CA. Matrix stiffening promotes a tumor vasculature phenotype. PNAS. 2017;114:492–497. doi: 10.1073/pnas.1613855114. - DOI - PMC - PubMed
    1. Borowsky AD, Namba R, Young LJ, Hunter KW, Hodgson JG, Tepper CG, McGoldrick ET, Muller WJ, Cardiff RD, Gregg JP. Syngeneic mouse mammary carcinoma cell lines: two closely related cell lines with divergent metastatic behavior. Clinical & Experimental Metastasis. 2005;22:47–59. doi: 10.1007/s10585-005-2908-5. - DOI - PubMed
    1. Bougherara H, Mansuet-Lupo A, Alifano M, Ngô C, Damotte D, Le Frère-Belda MA, Donnadieu E, Peranzoni E. Real-Time imaging of resident T cells in human lung and ovarian carcinomas reveals how different tumor microenvironments control T lymphocyte migration. Frontiers in Immunology. 2015;6:500. doi: 10.3389/fimmu.2015.00500. - DOI - PMC - PubMed

Publication types

MeSH terms