. 2022 Jan 5;28(1):9-20.
doi: 10.1093/ibd/izab123.

Serum Analyte Profiles Associated With Crohn's Disease and Disease Location

Collaborators, Affiliations

Serum Analyte Profiles Associated With Crohn's Disease and Disease Location

Gabrielle Boucher et al. Inflamm Bowel Dis. .

Abstract

Background: Crohn's disease (CD) can affect any segment of the digestive tract but is most often localized in the ileal, ileocolonic, and colorectal regions of the intestines. It is believed that the chronic inflammation in CD is a result of an imbalance between the epithelial barrier, the immune system, and the intestinal microbiota. The aim of the study was to identify circulating markers associated with CD and/or disease location in CD patients.

Methods: We tested 49 cytokines, chemokines, and growth factors in serum samples from 300 patients with CD and 300 controls. After quality control, analyte levels were tested for association with CD and disease location.

Results: We identified 13 analytes that were higher in CD patients relative to healthy controls and that remained significant after conservative Bonferroni correction (P < 0.0015). In particular, CXCL9, CXCL1, and interleukin IL-6 had the greatest effect and were highly significant (P < 5 × 10⁻⁷). We also identified 9 analytes that were associated with disease location, with VEGF, IL-12p70, and IL-6 being elevated in patients with colorectal disease (P < 3 × 10⁻⁴).

Conclusions: Multiple serum analytes are elevated in CD. These implicate the involvement of multiple cell types from the immune, epithelial, and endothelial systems, suggesting that circulating analytes reflect the inflammatory processes that are ongoing within the gut. Moreover, the identification of distinct profiles according to disease location supports the existence of a biological difference between ileal and colonic CD, consistent with previous genetic and clinical observations.

Keywords: Crohn’s disease; disease location; serum biomarkers.


Figures

FIGURE 1.
FIGURE 1.
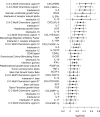
Effect sizes for association to CD with confidence intervals. Confidence intervals at 95% (black) and 99.85% (gray, Bonferroni correction) for the combined analysis including all CD patients are shown for each analyte that passed our quality threshold in both data sets. The effect is shown on the log2 scale, so the absence of effect is at 0, and the fold change on concentrations is given by 2effect (eg, an effect of 0.2 is a 1.15-fold change).
FIGURE 2.
FIGURE 2.
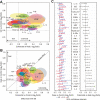
Representation of effect sizes for disease location. Each ellipse represents a cytokine associated to disease status and/or disease location at P < 0.05. Analytes associated at P < 0.0015 in the combined CD vs controls analyses are indicated in bold and larger font size. Ellipses color is solely for the purpose of identifying the different cytokines on the plot. (A) Effect sizes are shown for CD vs control (y axis) and colorectal vs ileal (x axis), with the width and height of the ellipse illustrating standard error of the effect for disease location and disease status, respectively. Analytes higher on the y axis are increased in CD compared with controls. Analytes more to the right side of graph are increased in colorectal patients compared with ileal patients. (B) Effect sizes are shown for colorectal vs controls (y axis) and ileal vs controls (x axis). Width and height of the ellipse illustrate standard error of the effect for colorectal and ileal vs controls, respectively. Analytes higher on the y axis are increased in ileal patients compared with controls. Analytes more to the right are increased in colorectal patients compared with controls. Analytes on the diagonal show similar effect sizes for ileal and colorectal. To be noted, 95% confidence intervals correspond to twice the dimension of the ellipses. (C) Effect sizes are shown with 95% confidence intervals. The left panel shows effect for patient vs control by disease location; colorectal (blue), ileocolonic (purple), and ileal (red). The right panel shows the effect of colorectal vs ileal (black). Names of analytes associated to CD vs controls in the main analysis (Table 2) are shown in bold if significant (P < 0.0015) after Bonferroni correction, or underlined if only nominally significant (P < 0.05).
FIGURE 3.
FIGURE 3.
A biological pathway perspective for the 13 serum analytes that were strongly associated with CD in this study (P < 0.0015). These 13 analytes were found to be significantly elevated in the sera of CD patients and reflect the complex nature of the inflammatory processes that are ongoing in these patients. Many of these are chemoattractants, produced and secreted by a variety of cells such as epithelial cells (CCL11), neutrophils (CXCL8, CXCL9), monocytes/macrophages (CXCL1), and play an important role in the recruitment (dashed arrows) of neutrophils, eosinophils, and T cells. Many of the other analytes play important roles in regulation and crosstalk of immune cells/response (IL-7, soluble IL-2Rα, IFN-γ, IL-18) tissue regeneration (IL-6, HGF), angiogenesis (VEGF, HGF), and cellular differentiation (IL-5). Though most of these analytes are common to all CD subgroups (based on disease behavior and disease location), some seem to be more strongly associated with ileal (red) or colorectal location (green). Analytes are positioned next to the cells that are primarily responsible for their production and secretion. Dashed arrows represent chemoattractant properties of denoted cytokine/chemokine.

References

    1. Martini E, Krug SM, Siegmund B, et al. . Mend your fences: the epithelial barrier and its relationship with mucosal immunity in inflammatory bowel disease. Cell Mol Gastroenterol Hepatol. 2017;4:33–46. - PMC - PubMed
    1. Baumgart DC, Sandborn WJ. Crohn’s disease. Lancet. 2012;380:1590–1605. - PubMed
    1. Jostins L, Ripke S, Weersma RK, et al. ; International IBD Genetics Consortium (IIBDGC) . Host-microbe interactions have shaped the genetic architecture of inflammatory bowel disease. Nature. 2012;491:119–124. - PMC - PubMed
    1. de Lange KM, Moutsianas L, Lee JC, et al. . Genome-wide association study implicates immune activation of multiple integrin genes in inflammatory bowel disease. Nat Genet. 2017;49:256–261. - PMC - PubMed
    1. Khor B, Gardet A, Xavier RJ. Genetics and pathogenesis of inflammatory bowel disease. Nature. 2011;474:307–317. - PMC - PubMed

Publication types