. 2022 Mar;227(2):655-672.
doi: 10.1007/s00429-021-02312-w. Epub 2021 Jun 9.

Fronto-parietal homotopy in resting-state functional connectivity predicts task-switching performance

Affiliations

Fronto-parietal homotopy in resting-state functional connectivity predicts task-switching performance

Antonino Vallesi et al. Brain Struct Funct. 2022 Mar.

Abstract

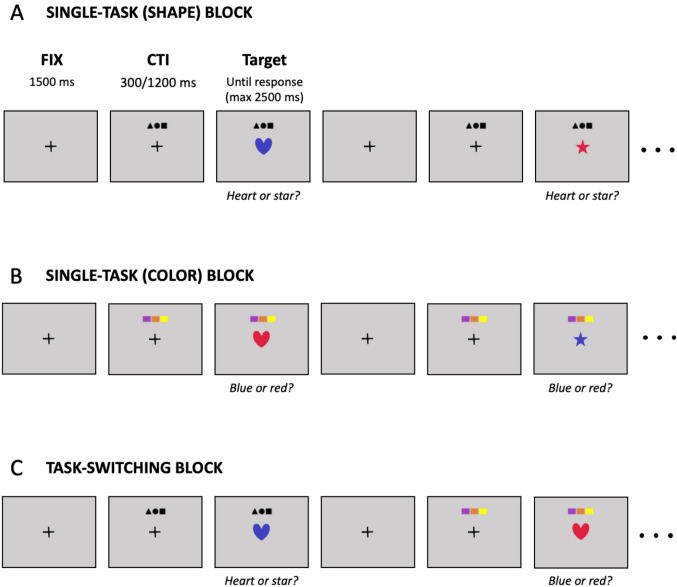
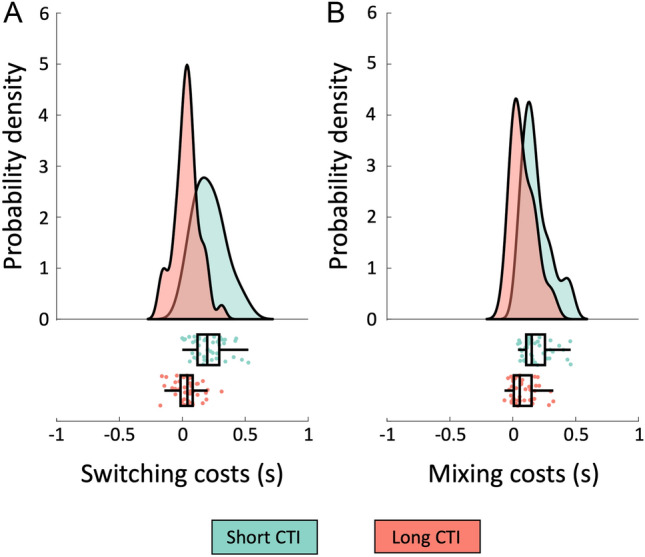
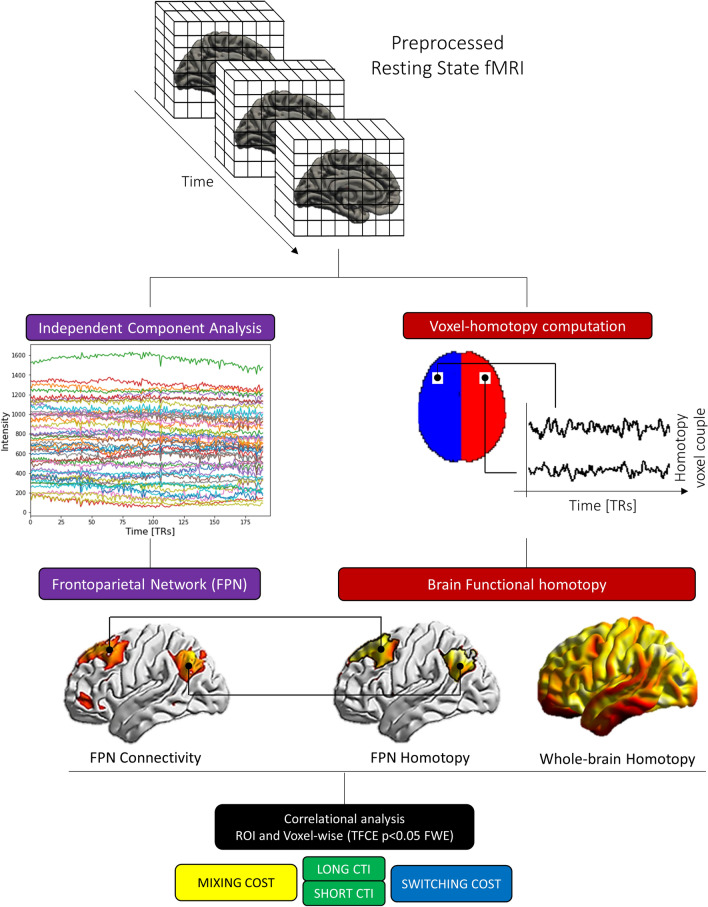
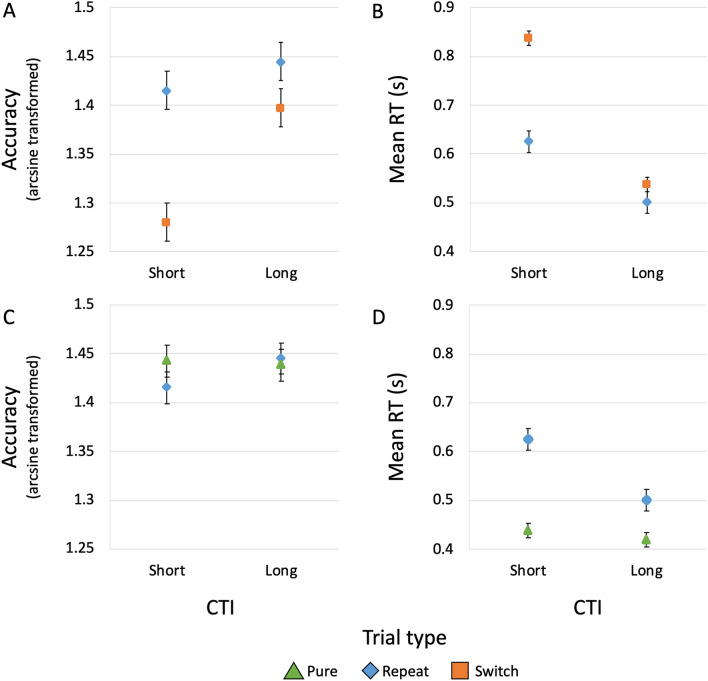
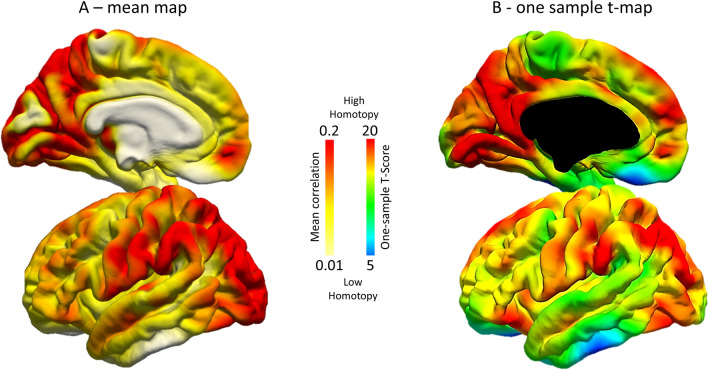
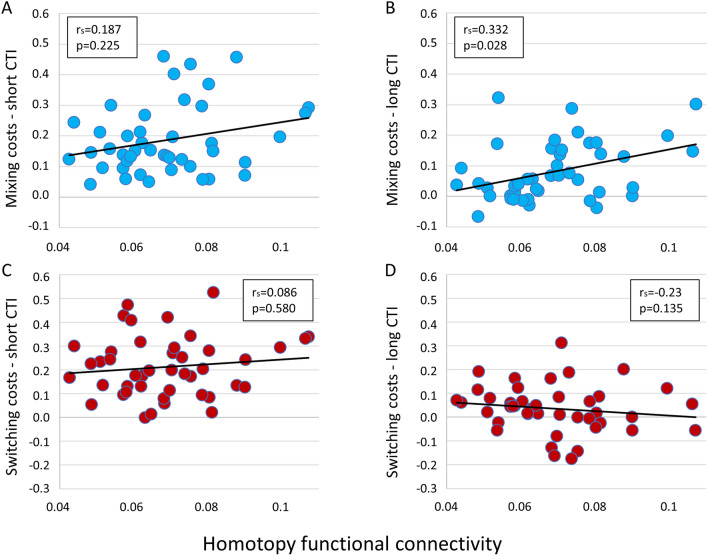
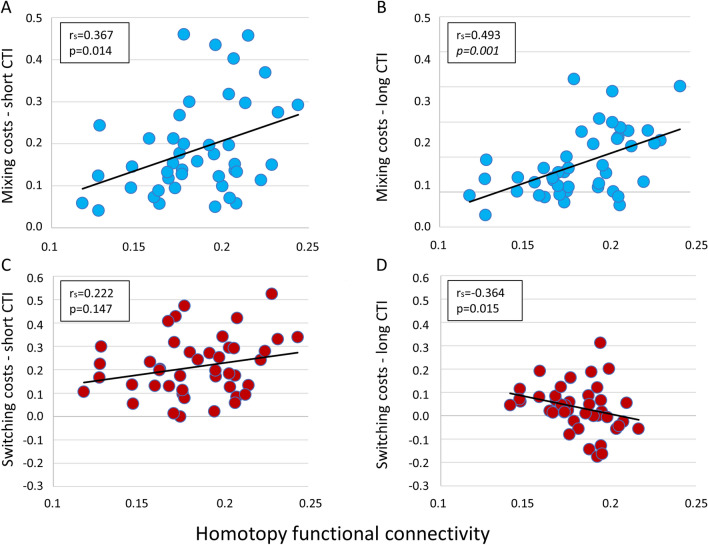
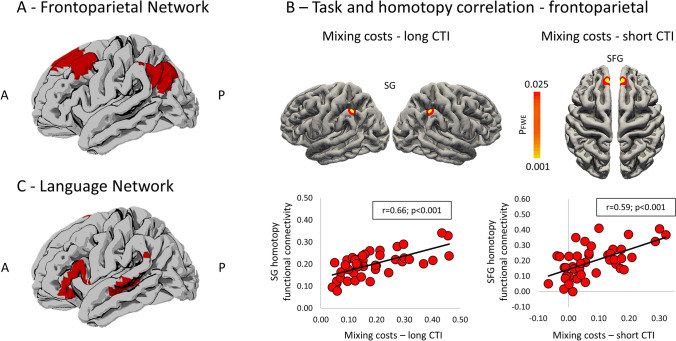
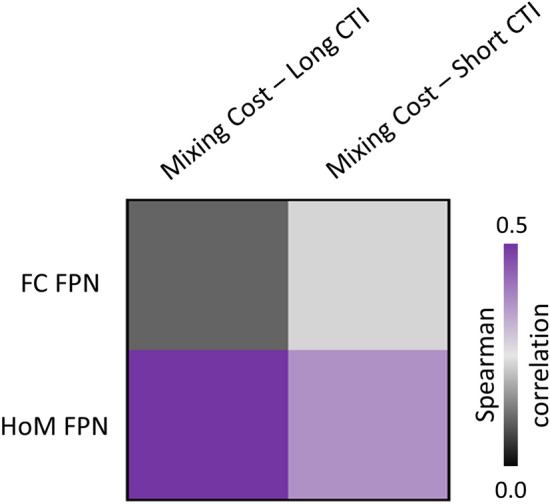
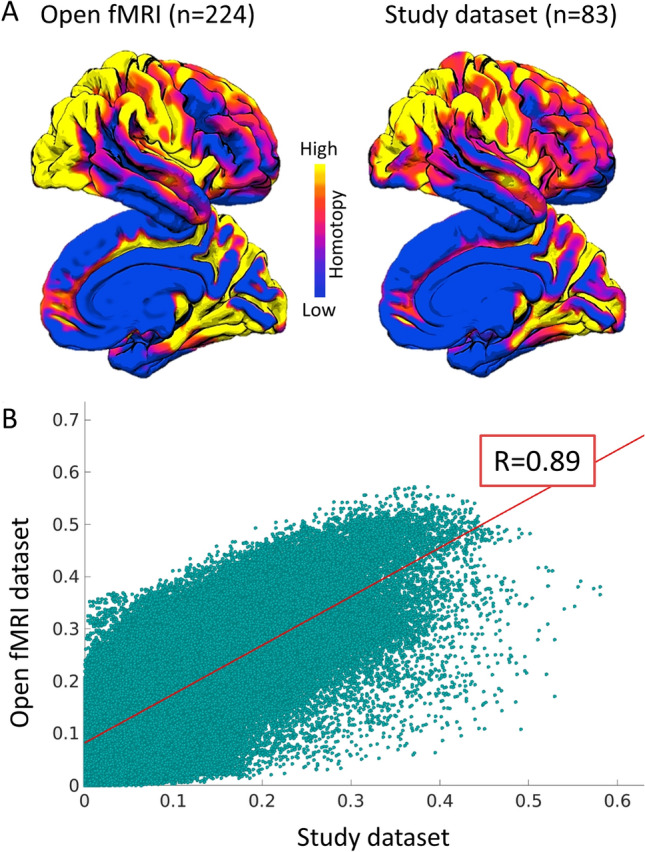
Homotopic functional connectivity reflects the degree of synchrony in spontaneous activity between homologous voxels in the two hemispheres. Previous studies have associated increased brain homotopy and decreased white matter integrity with performance decrements on different cognitive tasks across the life-span. Here, we correlated functional homotopy, both at the whole-brain level and specifically in fronto-parietal network nodes, with task-switching performance in young adults. Cue-to-target intervals (CTI: 300 vs. 1200 ms) were manipulated on a trial-by-trial basis to modulate cognitive demands and strategic control. We found that mixing costs, a measure of task-set maintenance and monitoring, were significantly correlated to homotopy in different nodes of the fronto-parietal network depending on CTI. In particular, mixing costs for short CTI trials were smaller with lower homotopy in the superior frontal gyrus, whereas mixing costs for long CTI trials were smaller with lower homotopy in the supramarginal gyrus. These results were specific to the fronto-parietal network, as similar voxel-wise analyses within a control language network did not yield significant correlations with behavior. These findings extend previous literature on the relationship between homotopy and cognitive performance to task-switching, and show a dissociable role of homotopy in different fronto-parietal nodes depending on task demands.

Keywords: Executive functions; Hemispheric asymmetries; Homotopy; Mixing costs; Resting-state fMRI; Task-switching.


Conflict of interest statement

The authors declare that they have no conflict of interest.

Figures

Fig. 1
Fig. 1
Task-switching paradigm. Trials started with a black fixation cross. After 1500 ms, a cue stimulus signaled the task to be performed: three colored rectangles required the participant to indicate the color of the target (blue or red); three small black shapes required the participant to indicate the shape of the target (heart or star). After a cue-to-target interval (CTI) of either 300 or 1200 ms the target was displayed until the participant’s response (max 2500 ms). Participants completed eight blocks of trials of two different types: single-task and task switching blocks. In single-task blocks participants were required to perform only one task during the entire block, either shape (A) or color (B). In task-switching blocks (C) participants were required to indicate either the shape or the color of the target according to the cue. The structure of the trial was the same in all block types
Fig. 2
Fig. 2
Raincloud plots of behavioral costs. The panels show the distribution in our sample of switching (A) and mixing (B) costs at short (300 ms) and long (1200 ms) CTIs. Data points in the lower panels represent individual costs, which are overlaid with boxplots displaying sample median alongside interquartile range. The raincloud plots were generated using codes provided by Allen et al. (2019)
Fig. 3
Fig. 3
Workflow of the functional connectivity and homotopy analysis. From the rs-fMRI preprocessed data we extracted the frontoparietal network (FPN) through an independent component analysis approach, and voxel-mirror homotopy properties. Functional maps were then correlated with behavioral performance (mixing and switching costs) through a permutation strategy
Fig. 4
Fig. 4
Trial type by CTI interaction plots. A Marginal means of arcsine transformed accuracy rates for repeat (blue diamonds) and switch trials (orange squares) at the short (i.e., 300 ms) and long (i.e., 1200 ms) cue-to-target intervals (CTI). B Marginal means of mean response times (RT) for repeat and switch trials at the short and long CTI. C Marginal means of arcsine transformed accuracy rates for pure (green triangles) and repeat trials (blue diamonds) at the short and long CTI. D Marginal means of mean RT for pure and repeat trials at the short and long CTI. Error bars represent the standard error of the mean
Fig. 5
Fig. 5
Homotopy maps in the whole sample of participants (n = 83, only 44 of whom then performed the task-switching test). Mean Z Fisher maps (A) and one-sample t test (B) are reported on the left fsaverage surface. Red colors: higher homotopy functional connectivity
Fig. 6
Fig. 6
Correlation between behavioral measures and whole brain average homotopy. rs = nonparametric Spearman correlations. Panels A and B show this correlation for mixing costs, short and long Cue-to-Target intervals (CTI), respectively; Panels C and D show the correlation for the switching costs, short and long CTI, respectively
Fig. 7
Fig. 7
Correlation between behavioral measures and fronto-parietal homotopy; rs = nonparametric Spearman correlations. p values surviving multiple comparisons are reported in italics. Panels A and B show this correlation for mixing costs, short and long CTI, respectively; Panels C and D show the correlation for the switching costs, short and long CTI, respectively
Fig. 8
Fig. 8
Fronto-parietal region-of-interest from group ICA registered to the asymmetrical MNI template and mapped to the fsaverage surface (A). Clusters showing significant positive association were reported for both mixing costs in the long CTI, mapping to the supramarginal gyrus (SG), and mixing costs in the short CTI, mapping to the superior frontal gyrus (SFG). Significant results are shown at p < 0.025 FWE-corrected (Panel B, top). Post hoc analysis between mixing costs and averaged homotopy within significant clusters from voxel-wise analysis are shown in Panel B, bottom. No significant association was reported between executive tasks and homotopy properties of the language network shown in Panel C. A anterior, P posterior
Fig. 9
Fig. 9
Frontoparietal network (FPN) properties correlated with the mixing cost performance, for both short and long Cue-to-Target Intervals (CTIs). The correlation between brain organization and cognitive tasks was numerically higher for the homotopy features for both CTIs. FC functional connectivity, HoM homotopy
Fig. 10
Fig. 10
A Mean homotopy maps from the OpenfMRI dataset and the study dataset (scaled at different Z Fisher values). B Spatial voxel-wise correlation between the open fMRI dataset and dataset maps of the current study

References

    1. Allen M, Poggiali D, Whitaker K, Marshall TR, Kievit RA. Raincloud plots: a multi-platform tool for robust data visualization. Wellcome Open Res. 2019;4:63. doi: 10.12688/wellcomeopenres.15191.1. - DOI - PMC - PubMed
    1. Allport A, Wylie G (1999) Task-switching: Positive and negative priming of task-set, In: Humphreys GW, Duncan J, Treisman A (Eds) Attention, space and action: studies in cognitive neuroscience, Oxford University Press, pp 273–296
    1. Altmann EM, Gray WD. An integrated model of cognitive control in task switching. Psychol Rev. 2008;115:602–639. doi: 10.1037/0033-295X.115.3.602. - DOI - PubMed
    1. Ambrosini E, Vallesi A. Asymmetry in prefrontal resting-state EEG spectral power underlies individual differences in phasic and sustained cognitive control. Neuroimage. 2016;124:843–857. doi: 10.1016/j.neuroimage.2015.09.035. - DOI - PubMed
    1. Ambrosini E, Arbula S, Rossato C, Pacella V, Vallesi A. Neuro-cognitive architecture of executive functions: a latent variable analysis. Cortex. 2019;119:441–456. doi: 10.1016/j.cortex.2019.07.013. - DOI - PubMed