. 2021 Jun 9;16(6):e0252266.
doi: 10.1371/journal.pone.0252266. eCollection 2021.

Hierarchical effects facilitate spreading processes on synthetic and empirical multilayer networks

Affiliations

Hierarchical effects facilitate spreading processes on synthetic and empirical multilayer networks

Casey Doyle et al. PLoS One. .

Abstract

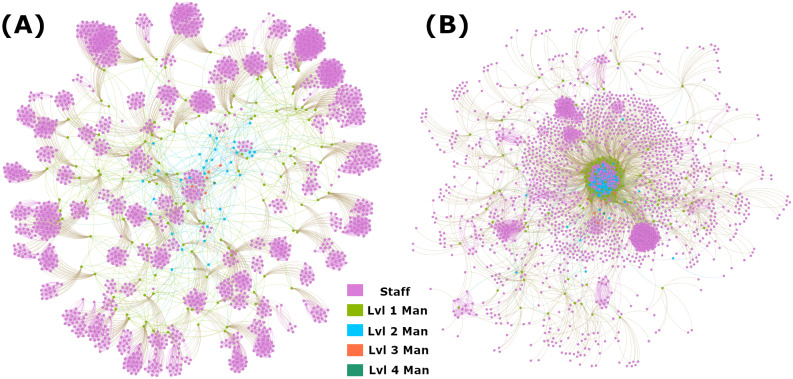
In this paper we consider the effects of corporate hierarchies on innovation spread across multilayer networks, modeled by an elaborated SIR framework. We show that the addition of management layers can significantly improve spreading processes on both random geometric graphs and empirical corporate networks. Additionally, we show that utilizing a more centralized working relationship network rather than a strict administrative network further increases overall innovation reach. In fact, this more centralized structure in conjunction with management layers is essential to both reaching a plurality of nodes and creating a stable adopted community in the long time horizon. Further, we show that the selection of seed nodes affects the final stability of the adopted community, and while the most influential nodes often produce the highest peak adoption, this is not always the case. In some circumstances, seeding nodes near but not in the highest positions in the graph produces larger peak adoption and more stable long-time adoption.


Conflict of interest statement

This study was funded by Sandia National Laboratories, a multimission laboratory managed and operated by National Technology & Engineering Solutions of Sandia, LLC, a wholly owned subsidiary of Honeywell International Inc., for the U.S. Department of Energy’s National Nuclear Security Administration under contract DE-NA0003525. This does not alter our adherence to PLOS ONE policies on sharing data and materials, and the data used in this study is all contained within the supplementary materials of the paper.

Figures

Fig 1
Fig 1. Dosage model state transitions.
Each node has three possible states, S, I, and R. Nodes gain doses towards switching states every time they ‘listen’ to another node; doses are nonzero if the ‘speaking’ node is in state I and zero otherwise. When a node in state S has a cumulative dosage over the past T time steps, Di,t, greater than its threshold, di*, it switches to state I. When a node in state I has a cumulative less than its threshold, it has a 20% change per activation to switch to state R. State R is absorbing.
Fig 2
Fig 2. Empirical network visualizations.
Nodes are color coded by layer: staff nodes are pink, level 1 managers are green, level 2 managers are light blue, level 3 managers are orange, and level 4 is dark blue. A: Visualization of the Line-Org network. B: Visualization of the Project network.
Fig 3
Fig 3. Synthetic network spread.
Plot of average max adoption over 1000 runs. IM is the maximum adoption, p is the probability of connection for every pair of managers, and N is the overall system size. Management connections are made via ER random graph method. A: Average maximum adoption versus management connection density over 1000 runs. B: Average maximum adoption vs sysem size. Seed size is proportional total network size, set at 1.5% of the network. All networks have a number of managment communities c = 0.06N and an average node degree of 〈k〉 = 20.
Fig 4
Fig 4. Time to consensus in SI framework.
Time to different levels of consensus with an absorbing I state for varying seed sizes, averaged over 1000 runs. A: Time to 100% consensus. B: Time to 90% consensus. C: Time to 74% consensus. D: Time to 50% consensus.
Fig 5
Fig 5. Max adoption with SIR dynamics.
Shows the average maximum population of nodes in state I for each combination of network, seed size, and seed level, averaged over 1000 runs. Includes a ‘flat network’ consideration, where management advantages are removed. A: Average max reach in the Line Org network structure. B: Average max reach in the Project network structure.
Fig 6
Fig 6. Stability of I population in long-time scenarios.
All seeds are size 0.015N and all data points are averaged over 1000 runs. A: The surviving percentage of the maximum infected population over time. B: The raw percentage of nodes in state I over time. C: Percent of the maximum adopted community remaining at time t = 515 with varying removal rates.
Fig 7
Fig 7. Max adoption with SIR dynamics.
Shows the average maximum population of nodes in state I for each combination of network, seed size, and seed level, and selection algorithm averaged over 1000 runs. Includes a ‘flat network’ consideration, where management advantages are removed and an ‘all’ seed level where seeding is done by highest connected node regardless of level. A-C: Average max reach in the Line Org network structure for different seed selection strategies. D-F: Average max reach in the Project network structure for different seed selection strategies.

References

    1. Dodds PSS, Watts DJJ. A generalized model of social and biological contagion. Journal of theoretical biology. 2005;232(4):587–604. doi: 10.1016/j.jtbi.2004.09.006 - DOI - PubMed
    1. Kermack WO, McKendrick AG. A Contribution to the Mathematical Theory of Epidemics. Proceedings of the Royal Society A: Mathematical, Physical and Engineering Sciences. 1927;115(772):700–721. doi: 10.1098/rspa.1927.0118 - DOI
    1. Valente T. Network models of the diffusion of innovations. Computational and Mathematical Organization Theory. 1996;2(2):163–164. doi: 10.1007/BF00240425 - DOI
    1. Kuandykov L, Sokolov M. Impact of social neighborhood on diffusion of innovation S-curve. Decision Support Systems. 2010;48(4):531–535. doi: 10.1016/j.dss.2009.11.003 - DOI
    1. Krackhardt D. Social Networks and Liability of Newness. Trends in organizational behavior. 1996;3:159–173.

Publication types