. 2021 Jun 9;17(6):e1009618.
doi: 10.1371/journal.ppat.1009618. eCollection 2021 Jun.

Epigenetic Plasticity Enables CNS-Trafficking of EBV-infected B Lymphocytes

Affiliations

Epigenetic Plasticity Enables CNS-Trafficking of EBV-infected B Lymphocytes

Samantha S Soldan et al. PLoS Pathog. .

Abstract

Subpopulations of B-lymphocytes traffic to different sites and organs to provide diverse and tissue-specific functions. Here, we provide evidence that epigenetic differences confer a neuroinvasive phenotype. An EBV+ B cell lymphoma cell line (M14) with low frequency trafficking to the CNS was neuroadapted to generate a highly neuroinvasive B-cell population (MUN14). MUN14 B cells efficiently infiltrated the CNS within one week and produced neurological pathologies. We compared the gene expression profiles of viral and cellular genes using RNA-Seq and identified one viral (EBNA1) and several cellular gene candidates, including secreted phosphoprotein 1/osteopontin (SPP1/OPN), neuron navigator 3 (NAV3), CXCR4, and germinal center-associated signaling and motility protein (GCSAM) that were selectively upregulated in MUN14. ATAC-Seq and ChIP-qPCR revealed that these gene expression changes correlated with epigenetic changes at gene regulatory elements. The neuroinvasive phenotype could be attenuated with a neutralizing antibody to OPN, confirming the functional role of this protein in trafficking EBV+ B cells to the CNS. These studies indicate that B-cell trafficking to the CNS can be acquired by epigenetic adaptations and provide a new model to study B-cell neuroinvasion associated CNS lymphoma and autoimmune disease of the CNS, including multiple sclerosis (MS).


Conflict of interest statement

I have read the journal’s policy and the authors of this manuscript have the following competing interests: Paul M. Lieberman declares his role as a founder of Vironika, LLC as a Conflict of Interest that is managed by the Wistar Institute. No other authors have any conflicts to disclose.

Figures
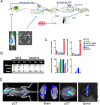
Fig 1
Fig 1. Neuroadaptation of an EBV+ B cell lymphoma line (MUN14) from parental Mutu I (M14).
A. The neuroadapted MUN14 line was obtained by serially passaging M14 cells that metastasized to the brain, through seven mice. These cells were purified by sorting for GFP prior to performing the imaging studies described. B. Incidence of brain signal from MUN14 or M14 after intracardiac (i.c.), intravenous (i.v), or subcutaneous (s.q.) engraftment. C. Percentage of animals (n = 10 per group) with bioluminescent signal detected in the brain, spinal cord, kidney, or lungs post-mortem (**p<0.001, ***p<0.0001; Chi-Square analysis) in EBV+ (LCL/B95.8, LCL Mutu, M14, and MUN14) and EBV- B-cells (8226 and BJAB). D. MUN14 cells visualized by bioluminescent imaging after i.c. engraftment. Whole body (μCT), brain, brain (with μCT), and spinal cord shown.
Fig 2
Fig 2. MUN14 is more neuroinvasive than parental M14 line.
A-C. Animals were engrafted with either MUN14 (red) or M14 (blue) via the intracardiac route. A. bioluminescent signal measured by flux in the head (***p<0.0001, Kruskal-Wallis test). B. Days until bioluminescent signal was detected in the head of animals engrafted with MUN14 (red) or M14 (blue) (***p<0.0002; log-rank Mantel-Cox test). C. Disease score signal in the heads of animals engrafted with MUN14 (***p<0.0002; log-rank Mantel-Cox test). D. Evans blue leakage was significantly greater in MUN14 vs M14 engrafted animals 7 days post engraftment (p>0.00001; T Test).
Fig 3
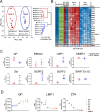
Fig 3. Viral determinants of neuroinvasion identified RNASeq.
A. Principal component analysis (PCA) of RNA-seq data from MUN14 isolated from brain and in tissue culture compared to M14 isolated from kidney and tissue culture, B. Top ten changed EBV genes in MUN14 vs M14. C. RT- qPCR of EBV gene expression (EBNA1 QP, EBNA2, LMP1, ZTA, BORF2, and BLRF2) in cells isolated from MUN14 in brain (red) and M14 in kidney (blue) *p<0.005; student t-test. D. RT-qPCR analysis of transcripts for Qp, LMP1, and ZTA over serial passaging P1-P6 of M14 in mouse brain. Three mice were assayed for each time point.
Fig 4
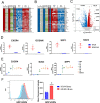
Fig 4. Host determinants of neuroinvasion identified RNASeq.
A. Top ten changed upregulated host genes in MUN14 vs M14. B. Top ten changed downregulated host genes in MUN14 vs M14. C. Volcano plot highlighting key upregulated (red) and downregulated (blue) genes in MUN14 vs M14. D. RT-q PCR validation of host gene expression (CXCR4, GCSAM, SPP1, NAV3) in cells isolated from MUN14 in brain (red) and M14 in kidney (blue) *p<0.005; student t-test. E. RT-qPCR analysis of transcripts for CXCR4, NAV3, and SPP1 over serial passaging P1-P6 of M14 in mouse brain. Three mice were assayed for each time point. F. SPP1/OPN cell expression assayed by flow cytometry (using anti-OPN Alexa647).
Fig 5
Fig 5. ATAC Seq reveals changes in chromatin accessibility in neuroadapted MUN14.
A. Transcriptomic data was integrated with ATAC-Seq data by generating sequential subsets of genes based on their association with differentially accessibly chromatin, and the associated gene expression pattern. Genes were considered directly correlated if there was correlation (r > 0.5) between changes in gene expression and changes in chromatin accessibility. The UCSC genome browser was used to map EBNA1, 2, and 3 ChIP-Seq peak files and enrichment beds to the ATAC peaks of M14 and MUN14 for (B) SPP1 and (C) CXCR4. D. ChIP-qPCR of M14 (blue) and MUN14 (red) cells was performed for H3K27ac, HeK4me3, and H3K27me3 using antibodies for the SPP1 and CXCR4 promoters. E. MeDIP of promoters of SSP1 and CXCR 4 (bottom).
Fig 6
Fig 6. Neuroinvasion of MUN14 is attenuated with an osteopontin-specific neutralizing antibody.
A-F. Animals were engrafted i.c. with MUN14 and treated with isotype (red) or anti-OPN (orange) or engrafted with M14 and treated with isotype (blue) or anti-OPN (green). N = 10 animals (5 female and 5 male) per group. A. Days until bioluminescent signal was detected in the head. B. bioluminescent signal measured by flux in the head. C. Survival curve (*P<0.006, **P<0.001; Log-rank (Mantel-Cox) test) D. Disease score (**p<0.0001; Bartlett’s test). E. Evans Blue stain. F. Quantitation of Evans blue stain.
Fig 7
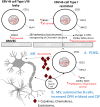
Fig 7. Theoretical Model: Epigenetic reprogramming of EBV+ B-cell contributes to neuroinvasion and CNS disease.
Epigenetic changes that alter the expression of viral and host genes in EBV+ B cells, resulting in a neuroinvasive phenotype with increase expression of SPP1/OPN, CXCR4, and NAV3. We speculate that increased neuroinvasion of B-cells with oncogenic potential leads to PCNSL (A), while the infiltration of autoreactive and inflammatory B-cells may contribute to the neuropathology of MS (B).

References

    1. Cohen JI. Epstein-Barr virus infection. N Engl J Med. 2000;343(7):481–92. Epub 2000/08/17. doi: 10.1056/NEJM200008173430707 . - DOI - PubMed
    1. Shannon-Lowe C, Rickinson A. The Global Landscape of EBV-Associated Tumors. Front Oncol. 2019;9:713. Epub 2019/08/27. doi: 10.3389/fonc.2019.00713 ; PubMed Central PMCID: PMC6691157. - DOI - PMC - PubMed
    1. Pender MP. Preventing and curing multiple sclerosis by controlling Epstein-Barr virus infection. Autoimmun Rev. 2009;8(7):563–8. Epub 2009/03/04. doi: 10.1016/j.autrev.2009.01.017 . - DOI - PubMed
    1. Young LS, Arrand JR, Murray PG. EBV gene expression and regulation. In: Arvin A, Campadelli-Fiume G, Mocarski E, Moore PS, Roizman B, Whitley R, et al.., editors. Human Herpesviruses: Biology, Therapy, and Immunoprophylaxis. Cambridge 2007. - PubMed
    1. Chen J, Longnecker R. Epithelial cell infection by Epstein-Barr virus. FEMS Microbiol Rev. 2019;43(6):674–83. Epub 2019/10/05. doi: 10.1093/femsre/fuz023 ; PubMed Central PMCID: PMC7317989. - DOI - PMC - PubMed

Publication types

MeSH terms