. 2021 Jun 8;35(10):109189.
doi: 10.1016/j.celrep.2021.109189.

An integrated genomic approach to dissect the genetic landscape regulating the cell-to-cell transfer of α-synuclein

Affiliations

An integrated genomic approach to dissect the genetic landscape regulating the cell-to-cell transfer of α-synuclein

Eleanna Kara et al. Cell Rep. .

Abstract

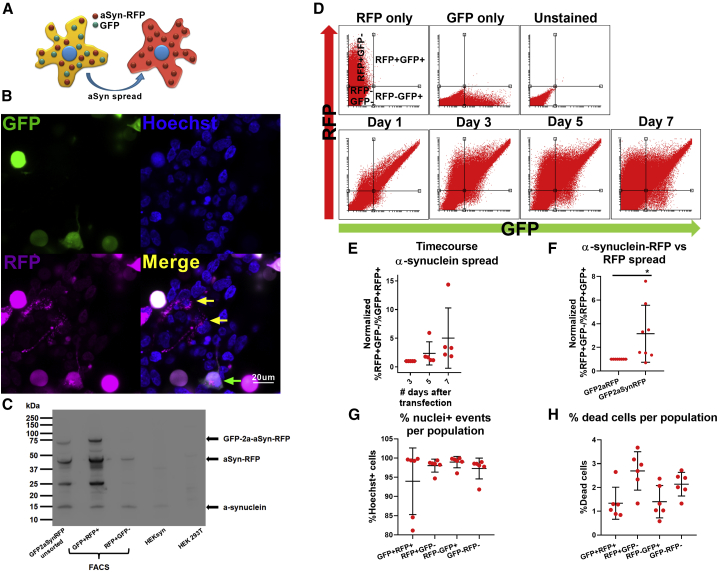
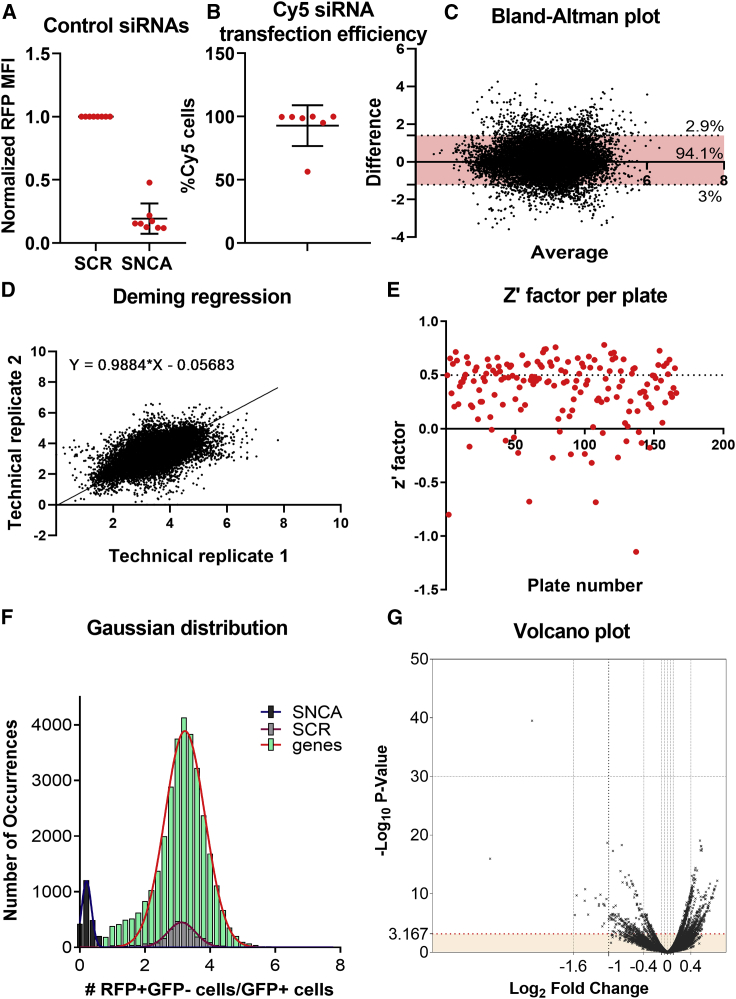
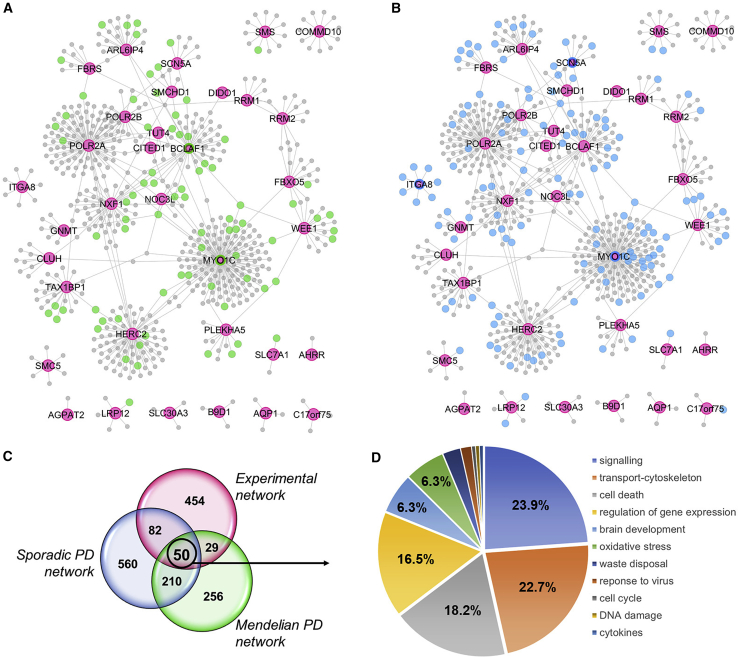
Neuropathological and experimental evidence suggests that the cell-to-cell transfer of α-synuclein has an important role in the pathogenesis of Parkinson's disease (PD). However, the mechanism underlying this phenomenon is not fully understood. We undertook a small interfering RNA (siRNA), genome-wide screen to identify genes regulating the cell-to-cell transfer of α-synuclein. A genetically encoded reporter, GFP-2A-αSynuclein-RFP, suitable for separating donor and recipient cells, was transiently transfected into HEK cells stably overexpressing α-synuclein. We find that 38 genes regulate the transfer of α-synuclein-RFP, one of which is ITGA8, a candidate gene identified through a recent PD genome-wide association study (GWAS). Weighted gene co-expression network analysis (WGCNA) and weighted protein-protein network interaction analysis (WPPNIA) show that those hits cluster in networks that include known PD genes more frequently than expected by random chance. The findings expand our understanding of the mechanism of α-synuclein spread.

Keywords: Braak hypothesis; GWAS; ITGA8; high-throughput screen; siRNA; weighted gene co-expression network analysis; weighted protein-protein network interaction analysis; α-synuclein.


Conflict of interest statement

Declaration of interests B.T.H. has a family member who works at Novartis, and owns stock in Novartis; he serves on the scientific advisory board (SAB) of Dewpoint and owns stock; he serves on an SAB or is a consultant for Avrobio, AZTherapies, Biogen, Novartis, Cell Signaling, the U.S. Department of Justice, Takeda, Vigil, W20 Group, and Seer; and his laboratory is supported by sponsored research agreements with Abbvie and F-Prime and has research grants from the National Institutes of Health, Cure Alzheimer’s Fund, Tau Consortium, and the JPB Foundation.

Figures

None
Graphical abstract
Figure 1
Figure 1
Development of an assay to study the cell-to-cell transfer of αSyn (A) Cartoon depicting the rationale behind the αSyn transfer assay used, based on the GFP-2A-αSyn-RFP construct. (B) Confocal images showing one HEK-αSyn cell that was transfected with the GFP-2A-αSyn-RFP construct and is double positive for GFP and RFP (green arrow), and 2 cells that have received αSyn-RFP through transfer and are positive for RFP but negative for GFP (yellow arrows). Scale bar, 20 μm. (C) Western blot experiment on bulk HEK-αSyn cells transfected with the GFP-2A-αSyn-RFP construct. FACS-sorted RFP+GFP+ and RFP+GFP cells were also included. The membrane was probed with an anti-αSyn antibody. (D) Flow cytometry plots corresponding to a representative experiment from (E). Single-color controls and unstained samples are shown to demonstrate how the gates were set. (E) Time-course experiment in which the HEK-αSyn cells were transfected with the GFP-2A-αSyn-RFP construct, followed by collection on days 3, 5, and 7 and analysis through flow cytometry. This experiment was repeated independently 5 times. Data were normalized to the samples collected 3 days after transfection. One-way ANOVA with a test for trend, α = 0.05. (F) The transfer propensity of αSyn-RFP was compared with that of the negative control, RFP, using the constructs GFP-2A-αSyn-RFP and GFP-2A-RFP. The αSyn-RFP fusion protein transferred from cell-to-cell significantly more than did RFP alone. One-sample t test was used for statistical analysis. p < 0.05 and > 0.01. The experiment was repeated independently 8 times and normalized to the negative control (GFP-2A-RFP) before meta-analysis. (G) Plot showing the percentage of the events within each of the 4 populations that were positive for Hoechst, indicating that they had a nucleus and were, therefore, intact cells. The experiment was repeated independently 5 times, and the data were plotted without prior normalization. (H) Plot showing the percentage of cells that were dead, as assessed through staining with a far-red live/dead dye. The experiment was repeated independently 5 times, and the data were plotted without prior normalization.
Figure 2
Figure 2
A genome-wide siRNA screen for the identification of genetic modifiers of αSyn spread (A) The mean fluorescence intensity (MFI) of αSyn-RFP was quantified through flow cytometry after treatment with the positive control siRNAs against SNCA in comparison with the negative control of scrambled siRNA. There was an 81% ± 12% (means ± SD) reduction of the MFI after siRNA treatment. The experiment was repeated independently 5 times. The data were normalized to the negative control before collation. (B) The transfection efficiency of the siRNAs was quantified in an experiment in which the GFP-2A-αSyn-RFP construct was co-transfected with an siRNA that was tagged with a Cy5 fluorophore. The transfection efficiency of the siRNA was 93% ± 16%. The experiment was repeated independently 5 times. (C) Plot generated by the Bland-Altman test depicting the difference versus the average between the two technical replicates. (D) Deming regression plot. (E) Plot depicting the z′-factors per plate for the 166 plates included in the primary screen. Each dot represents one plate. The average z′-factor was 0.36, within the acceptable range. The cutoffs are as follows: <0, unacceptable; 0–0.5, acceptable; >0.5, excellent. (F) Histogram of the positive (black) and negative (gray) controls and library siRNAs (green) analyzed in the entire primary screen. The separation between the positive and negative controls was good throughout the entire screen, and the library siRNAs overlapped nicely with the scrambled siRNAs. (G) Volcano plot depicting the log2(fold change) versus –log10(p value) for each siRNA.
Figure 3
Figure 3
Secondary and tertiary screens (A) Step-wise process used during the high-throughput screens and follow-up analyses for gene filtering. (B) Plot depicting the z′-factors of all plates included in the secondary screen. Only one plate had a negative z′-factor, and the average was 0.48. (C) Histogram depicting all the positive and negative controls included in the secondary screen, showing a good separation between them. (D) Plot showing the z′-factor per plate for one of the 3 tertiary screens. (E) g:ProfileR analysis for the 38 screens confirmed after the tertiary screens. (F) Histogram from 1 of the 3 tertiary screens showing the distribution of the positive and negative controls, 39 hits, 80 random genes, and all 233 genes included. There is a good separation between the positive and negative controls. The 39 hits cluster on either side of the bars depicting the random genes. (H) Plot from 1 of 3 tertiary screens showing the separation between the final 38 hits and the random genes that were included. The hits show significantly higher or lower transfer ratios compared with that of the scrambled or αSyn controls, respectively, whereas the random genes are indistinguishable to the scrambled control. (G) Heatmaps showing the p values for each of the 233 genes included in the tertiary screens. The 39 hits form a separate cluster that is identifiable through visual inspection. The 80 random genes are indistinguishable from the 114 hits from the primary screen that did not pass the cutoffs. Color code: purple, 39 hits; green, 114/152 filtered genes; and yellow, random genes. The lists of genes depicted in the graphs in (G) and (H) are not easily readable because of their large number and are provided as an Excel sheet at the following repository: https://github.com/alecrimi/aSynuclein_siRNA_screen/blob/master/figure%203labellings.xlsx
Figure 4
Figure 4
Replication of selected hits using pharmacological agents (A) Plot showing the effect of the zinc chelator N,N,N′,N′-Tetrakis(2-pyridylmethyl)ethylenediamine (TPEN) on the cell-to-cell transfer of αSyn, as assessed through the GFP-2A-αSyn-RFP construct; 5 independent experiments were performed and were normalized to the negative control before meta-analysis. Statistical analysis was performed with one-way ANOVA with a test for trend. p < 0.05 and >0.01, ∗∗p < 0.01 and >0.001, ∗∗∗p < 0.001. (B) Dose-response experiment for α-amanitin; 6 independent experiments were performed and were normalized to the negative control before meta-analysis. Statistical analysis was performed with one-way ANOVA with a test for trend. p < 0.05 and >0.01. (C) Dose-response experiment for the Cdk1 inhibitor; 5 independent experiments were performed and were normalized to the negative control before meta-analysis. Statistical analysis was done with one-way ANOVA with a test for trend. p < 0.05 and >0.01. (D) Toxicity associated with TPEN treatment, as assessed through the far-red live/dead staining. The experiment was repeated independently 5 times. Unnormalized values are shown. (E) Toxicity measurement in the α-amanitin experiments using the far-red live/dead stain. Treatment with the compound was associated with a higher toxicity in comparison with the vehicle-only control, which, however, was on average less than 10%. The experiment was repeated independently 5 times. Unnormalized values are shown. (F) Toxicity measurement in the cdk1-inhibitor experiments using the far-red live/dead stain. For the 4 lowest concentrations, the toxicity was similar to that of the vehicle-only control and was on average less than 10%. However, that increased to, on average, 20% for the highest concentration of the compound. The experiment was repeated independently 5 times. Unnormalized values are shown.
Figure 5
Figure 5
Assessment of the lysosomal-autophagy axis, mitochondrial mass, and cell cycle progression (A) Dose-response experiment for the concentration of the LysoTracker dye in the LysoTracker experiment. The experiment was repeated 5 times independently, and the data were internally normalized to the lowest concentration of the dye before meta-analysis. (B) Dose-response experiment for the concentration of the MitoTracker dye in the MitoTracker experiment. The experiment was repeated 5 times independently, and the data were internally normalized to the lowest concentration of the dye before meta-analysis. (C) Dose-response experiment for the concentration of Pyronin Y in the cell-cycle experiment. The MFI of Pyronin Y increased in a linear way when the concentration of the dye increased. The positive control, actinomycin D, was clearly separated from the negative control (DMSO only), and the separation was largest at the greatest concentration. The experiment was repeated 5 times independently, and the data were internally normalized to the lowest concentration of the dye before meta-analysis. (D) Confocal imaging of HEK-αSyn cells stained with the LysoTracker and MitoTracker dyes, depicting the subcellular distribution of those dyes. The concentration used for LysoTracker and MitoTracker was 150 nM. Scale bar, 20 μm. (E) Dose-response experiment for the concentration of various compounds in the LysoTracker assay. The experiment was repeated 5 times independently, and the data were internally normalized to the lowest concentration of the negative control (DMSO only) before meta-analysis. (F) Dose-response experiment for the concentration of various compounds in the MitoTracker assay. A good dose response was seen for CCCP but not for the other compounds. The experiment was repeated 5 times independently, and the data were internally normalized to the lowest concentration of the negative control (DMSO only) before meta-analysis. (G) Miniaturized version of the LysoTracker assay in 96-well-plate format. The experiment was repeated 5 times independently, and the data were internally normalized to the untreated sample before meta-analysis. The statistical analysis was performed with one-way ANOVA with Tukey’s correction for multiple testing. p < 0.05 and >0.01, ∗∗p < 0.01 and >0.001, ∗∗∗p < 0.001 and >0.0001, ∗∗∗∗p < 0.0001. (H) Miniaturized version of the cell-cycle assay in 96-well-plate format. A significant effect was seen for all concentrations of the positive control, actinomycin D. The experiment was repeated 5 times independently, and the data were internally normalized to the untreated sample before meta-analysis. The statistical analysis was performed with one-way ANOVA with Tukey’s correction for multiple testing. p < 0.05 and >0.01, ∗∗p < 0.01 and >0.001, ∗∗∗p < 0.001 and >0.0001, ∗∗∗∗p < 0.0001. (I) The 57 different genes assayed for LysoTracker MFI (39 hits plus 18 random genes); 3 independent experiments were performed and normalized to the negative control before meta-analysis. Statistical analysis was performed using one-sample t tests, followed by the Bonferroni correction for multiple testings. (J) The 57 different genes assayed for MitoTracker MFI (39 hits plus 18 random genes). None of the genes assayed had a statistically significant effect on MitoTracker MFI, but the top-5 genes causing a hyperpolarization in the mitochondria were all hits; 3 independent experiments were performed and normalized to the negative control before meta-analysis. Statistical analysis was performed using one-sample t tests, followed by the Bonferroni correction for multiple testings. (K) The 57 different genes assayed for Pyronin Y MFI (39 hits plus 18 random genes). None of the hits assayed had a statistically significant effect on the MFI of Pyronin Y, but a random gene, GTPBP6, caused a significant reduction in the MFI; 3 independent experiments were performed and normalized to the negative control before meta-analysis. Statistical analysis was performed using one-sample t tests, followed by the Bonferroni correction for multiple testings. p < 0.05 and >0.01, ∗∗p < 0.01 and >0.001, ∗∗∗p < 0.001 and >0.0001, ∗∗∗∗p < 0.0001. Abbreviations: Ch, chloroquine; To, torin; Ra, rapamycin; Ba, bafilomycin; CCCP, carbonyl cyanide m-chlorophenyl hydrazine; aD, actinomycin D
Figure 6
Figure 6
Expression-weighted cell-type analysis (EWCE) Bootstrapping results from EWCE, using data from the Australia’s International Business Survey 2019 (AIBS2019) study of the middle temporal gyrus or the Drosophila Nedd2-like caspase (DRONC) human study of the prefrontal cortex and hippocampus. Standard deviations from the mean denote the distance (in SD) of the target list from the mean of the bootstrapped samples. Asterisks used to denote results passing FDR < 0.05. Cell types on the x axis are colored by whether they are neuronally related. exPFC, glutamatergic neurons from the PFC; exCA1/3, pyramidal neurons from the Hip CA region; GABA, GABAergic interneurons; exDG, granule neurons from the Hip dentate gyrus region; ASC, astrocytes; NSC, neuronal stem cells; MG, microglia; ODC, oligodendrocytes; OPC, oligodendrocyte precursor cells; NSC, neuronal stem cells; SMC, smooth muscle cells; END, endothelial cells.
Figure 7
Figure 7
WPPINA confirms the functional relation between the 38 hits and known PD genes (A) The 34 seeds from the “experiment” (Table S8) have been used as seeds for building the “Experimental protein-protein interactions network” or hits network. The network was built after downloading the (first layer) protein interactors of the seeds and by filtering for reproducibility of interactions. Pink nodes are the seeds of the experimental network, whereas green nodes are those that overlap across the experimental network and the protein-interaction network built around the PD Mendelian genes (Table S6). (B) Pink nodes are the seeds of the experimental network, whereas blue nodes are those that overlap across the experimental network and the protein interaction network built around the risk (sporadic) PD genes (Table S7). (C) Venn diagram detailing the overlaps across the nodes composing the experimental—Mendelian PD—sporadic PD networks. (D) Functional enrichment (for Gene Ontology biological processes) performed with the 50 nodes that are communal across the 3 networks. Gene ontology terms are filtered and grouped into semantic classes by semantic similarity. General semantic classes have been excluded from the analysis (the entire enrichment is presented in Table S8).

References

    1. Abramov A.Y., Berezhnov A.V., Fedotova E.I., Zinchenko V.P., Dolgacheva L.P. Interaction of misfolded proteins and mitochondria in neurodegenerative disorders. Biochem. Soc. Trans. 2017;45:1025–1033. - PubMed
    1. Aguzzi A., Rajendran L. The transcellular spread of cytosolic amyloids, prions, and prionoids. Neuron. 2009;64:783–790. - PubMed
    1. Aguzzi A., Heikenwalder M., Polymenidou M. Insights into prion strains and neurotoxicity. Nat. Rev. Mol. Cell Biol. 2007;8:552–561. - PubMed
    1. Alegre-Abarrategui J., Brimblecombe K.R., Roberts R.F., Velentza-Almpani E., Tilley B.S., Bengoa-Vergniory N., Proukakis C. Selective vulnerability in α-synucleinopathies. Acta Neuropathol. 2019;138:681–704. - PMC - PubMed
    1. Bolger A.M., Lohse M., Usadel B. Trimmomatic: a flexible trimmer for Illumina sequence data. Bioinformatics. 2014;30:2114–2120. - PMC - PubMed

Publication types

MeSH terms

Substances