. 2021 Aug 9;31(15):3248-3261.e3.
doi: 10.1016/j.cub.2021.05.018. Epub 2021 Jun 8.

Sleep deprivation results in diverse patterns of synaptic scaling across the Drosophila mushroom bodies

Affiliations

Sleep deprivation results in diverse patterns of synaptic scaling across the Drosophila mushroom bodies

Jacqueline T Weiss et al. Curr Biol. .

Abstract

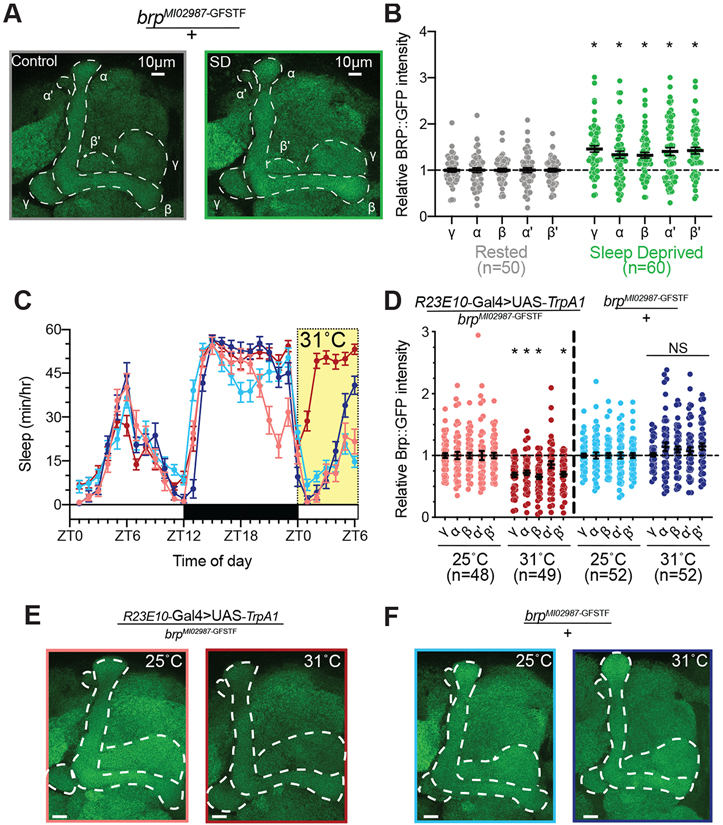
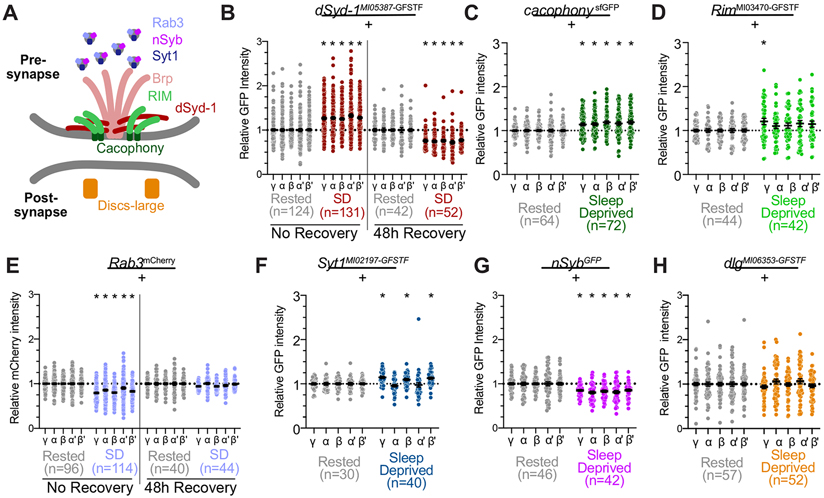
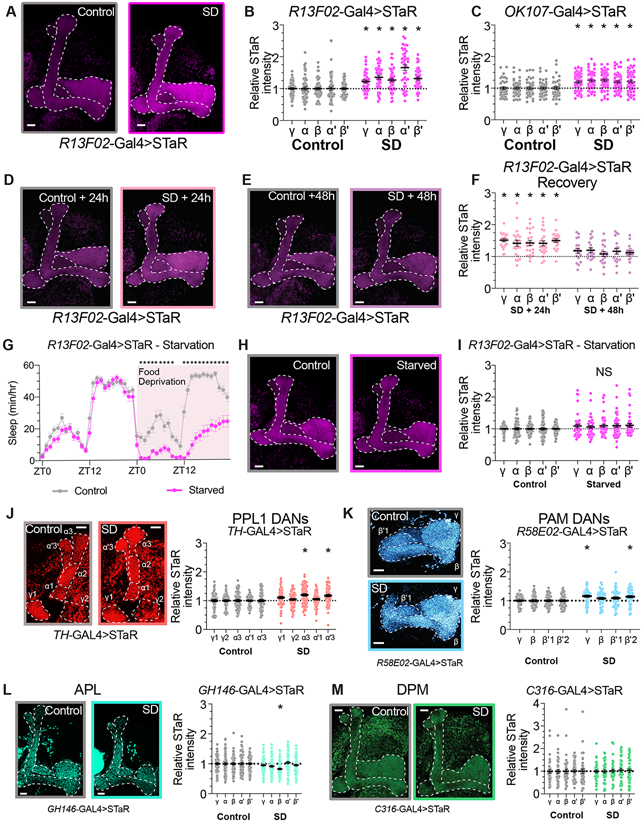
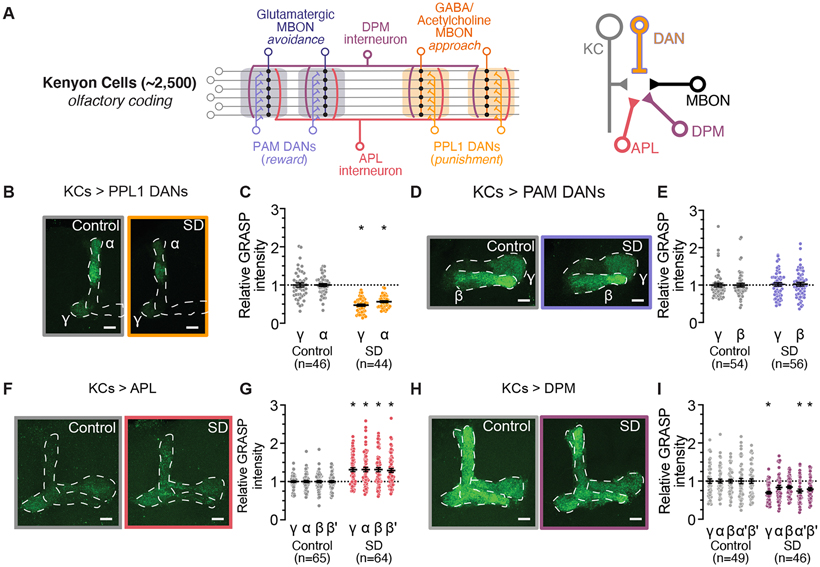
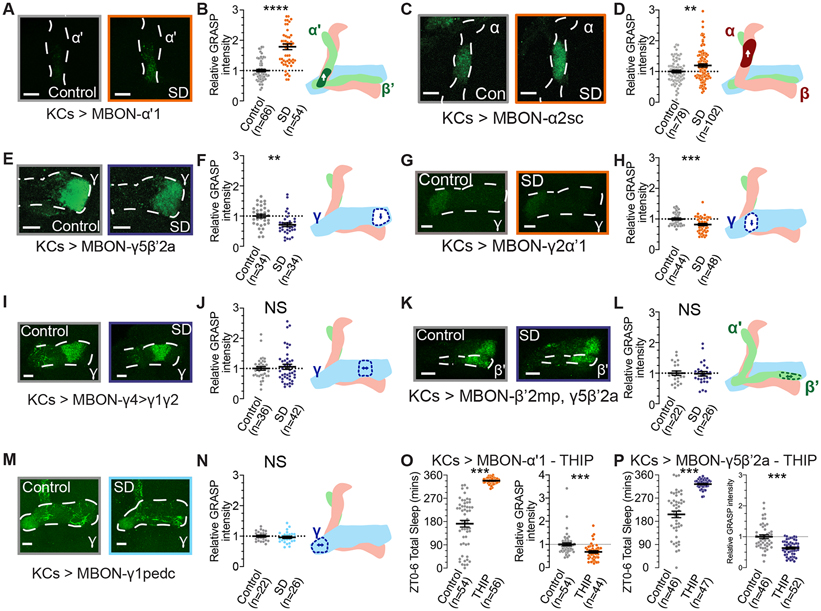
Sleep is essential for a variety of plastic processes, including learning and memory. However, the consequences of insufficient sleep on circuit connectivity remain poorly understood. To better appreciate the effects of sleep loss on synaptic connectivity across a memory-encoding circuit, we examined changes in the distribution of synaptic markers in the Drosophila mushroom body (MB). Protein-trap tags for active zone components indicate that recent sleep time is inversely correlated with Bruchpilot (BRP) abundance in the MB lobes; sleep loss elevates BRP while sleep induction reduces BRP across the MB. Overnight sleep deprivation also elevated levels of dSyd-1 and Cacophony, but not other pre-synaptic proteins. Cell-type-specific genetic reporters show that MB-intrinsic Kenyon cells (KCs) exhibit increased pre-synaptic BRP throughout the axonal lobes after sleep deprivation; similar increases were not detected in projections from large interneurons or dopaminergic neurons that innervate the MB. These results indicate that pre-synaptic plasticity in KCs is responsible for elevated levels of BRP in the MB lobes of sleep-deprived flies. Because KCs provide synaptic inputs to several classes of post-synaptic partners, we next used a fluorescent reporter for synaptic contacts to test whether each class of KC output connections is scaled uniformly by sleep loss. The KC output synapses that we observed here can be divided into three classes: KCs to MB interneurons; KCs to dopaminergic neurons; and KCs to MB output neurons. No single class showed uniform scaling across each constituent member, indicating that different rules may govern plasticity during sleep loss across cell types.

Keywords: Drosophila; active zone; bruchpilot; mushroom body; plasticity; sleep; sleep deprivation; synapse.


Conflict of interest statement

Declaration of interests The authors declare no competing interests.

Figures

Figure 1 –
Figure 1 –. Sleep bidirectionally regulates Brp abundance in the mushroom body
(A) Representative images of endogenous Brp (green) labeled with GFP in brpMI02987-GFSTF/+ flies following 12 hours of rest (left) or 12 hours of overnight sleep deprivation (right). The lobes of the MB are outlined in white. (B) Quantification of Brp::GFP intensity throughout the MB lobes of brpMI02987-GFSTF/+ flies after 12-hr of overnight sleep loss (green) normalized to rested controls (gray). Two-way ANOVA finds a significant effect of SD (F(1,108)=20.62, p<0.0001, n=50-60 hemispheres/group). Pairwise comparisons using Sidak’s multiple comparisons test found significant increases in Brp::GFP in each MB lobe after sleep deprivation relative to rested siblings (p≤0.002 for each test). (C) Hourly sleep traces at 25°C (light shading) and 31°C (dark shading) for R23E10-Gal4>UAS-TrpA1/brpMI02987-GFSTF (red) and brpMI02987-GFSTF/+ flies (blue). Thermogenetic activation of dFB neurons in brpMI02987-GFSTF -expressing flies (R23E10-Gal4>UAS-TrpA1/brpMI02987-GFSTF; dark red) increased sleep time compared to siblings that remained at 25°C (light red) and brpMI02987-GFSTF/+ genetic controls that were housed at 25°C (light blue) or shifted to 31°C (dark blue). Flies were temperature shifted from ZT0-6 (yellow shading). (D) Quantification of Brp::GFP intensity for groups shown in Figure 1C. Sleep induction in R23E10-Gal4>UAS-TrpA1/brpMI02987-GFSTF flies that were shifted to 31°C (dark red) led to a significant decrease in Brp intensity in α, β, β’, and γ lobes compared to siblings that remained at 25°C (light red). Exposure to 31°C did not change Brp::GFP in brpMI02987-GFSTF/+ genetic controls (25°C shown in light blue, 31°C in dark blue). Two-way Repeated Measures ANOVA found a significant group-by-lobe interaction (F(12,784)=3.796, p<0.0001, n=48-52 hemispheres/group). (E) Representative images of endogenous Brp::GFP labeled in R23E10-Gal4>UAS-TrpA1/brpMI02987-GFSTF flies that were housed at 25°C (left) or given a 6-h exposure at 31°C (right). (F) Representative images of endogenous Brp::GFP labeled in brpMI02987-GFSTF/+ flies that were housed at 25°C (left) or shifted to 31°C for 6-h (right). See also Figure S1 for sleep traces from experimental groups shown in Figure 1A-B. Scale bars depict 10 μm; error bars represent SEM for all panels.
Figure 2 –
Figure 2 –. Pre-synaptic proteins show variable responses to sleep loss in the MB lobes
(A) Schematic illustration of pre-synaptic active zone, including core protein components observed in these studies. Brp localizes in the electron-dense T-bar, where it physically interacts with Syd-1. Both contribute to the recruitment of other pre-synaptic proteins to the AZ. RIM is necessary for proper localization of the Ca2+ channel Cacophony in the pre-synaptic plasma membrane. Rab3 regulates priming of vesicles and organization of AZ proteins. Syt-1 is a Ca2+ sensor located on synaptic vesicles. Nsyb is localized to synaptic vesicles and mediates vesicle fusion. Dlg is a scaffolding protein that is primarily located at the postsynaptic density. (B) Abundance of dSyd-1::GFP throughout the MB after overnight sleep deprivation (red) compared to rested controls (grey) when flies were dissected either immediately following sleep deprivation (left) or allowed 48h of ad libitum recovery sleep before dissection (right); dSyd-1::GFP intensity in all groups is normalized to rested controls. Two-way ANOVA finds a significant effect of SD (F(3,345)=43.12, p<0.0001, n=42-131 hemispheres/group). (C) Quantification of Cac::sfGFP intensity in MB axonal lobes following overnight sleep deprivation (green) normalized to rested controls (grey). Two-way ANOVA finds a significant effect of SD (F(1,134)=18.51, p<0.0001, n=64-72 hemispheres/group). (D) Quantification of Rim::GFP in the MB lobes of sleep deprived RimMI03470-GFSTF flies (green) and rested controls (grey). Two-way ANOVA finds a significant effect of SD (F(1,84)=4.871, p=0.03, n=42-44 hemispheres/group), post-hoc comparisons using Sidak’s multiple comparisons test finds a significant increase in Rim::GFP abundance in the γ lobes (p=0.048), but not in α (p=0.54), β (p=0.38), α’ (p=0.23), or β’ (p=0.27). (E) Fluorescent intensity of endogenous Rab3::mCherry in the MB lobes of sleep deprived Rab3mCherry/+ (light blue) compared to rested siblings (grey). Data from brains dissected immediately following sleep-deprivation shown on left; right depicts quantification of brains dissected after 48h of recovery from overnight sleep deprivation. Two-way ANOVA finds a significant lobe x group interaction (F(12,1160)=4.472, p<0.0001, n=42-131 hemispheres/group). (F) Quantification of Syt1::GFP intensity throughout the MB after overnight sleep deprivation (dark blue) compared to rested controls (grey). Two-way ANOVA finds a significant lobe-by-SD interaction (F(4,272)=7.94, p<0.0001, n=30-40 hemipsheres/group); post-hoc comparisons using Sidak’s multiple comparisons test find a significant increase of Syt1::GFP in the γ (p=0.0005), β (p=0.029), and β’ lobes (p=0.0023). No significant change was detected in the α or α’ lobes (p=0.7827 and 0.9937, respectively, by Sidak’s multiple comparisons tests). (G) Abundance of nSyb::GFP in MB lobes of rested (grey) and sleep-deprived flies (magenta). Two-way repeated measures ANOVA finds a significant effect of sleep deprivation on nSyb::GFP abundance (F(1,86)=19.33, p<0.0001, n=42-46 hemispheres/group). (H) Dlg::GFP levels in the MB lobes of rested controls (grey) and sleep-deprived siblings (orange). Two-way repeated measures ANOVA finds no significant effect of sleep deprivation (F(1,107)=0.002567, p=0.9597, n=52-57 hemispheres/group). See also Figure S1 for representative images and sleep traces from each experimental group and genotype. Scale bars depict 10 μm; error bars represent SEM for all panels.
Figure 3 –
Figure 3 –. Increased BRP abundance in Kenyon cell axons after sleep deprivation
(A) Representative images from R13F02-Gal4>STaR flies after 12 hours of rest (left) or 12 hours of overnight SD (right). Presynapses labelled by STaR (BRP::V5) in magenta. (B) Quantification of BRP::V5 intensity in rested controls (gray) and after overnight SD (magenta) in KCs labeled by R13F02-Gal4. Two-way ANOVA finds a significant effect of SD (F(1,94)=43.43, p<0.0001, n=42-54 hemispheres/group). (C) Quantification of BRP::V5 intensity in rested controls (gray) and after overnight SD (magenta) in KCs labeled by OK107-Gal4. Two-way ANOVA finds a significant effect of SD (F(1,94)=19.82, p<0.0001, n=42-54 hemispheres/group). (D-E) Representative images from R13F02-Gal4>STaR flies following 24- (D) or 48-hours (E) of recovery sleep from overnight SD. (F) BRP::smFP_V5 intensity quantification for R13F02-Gal4>STaR flies permitted 24- or 48-hours of ad lib recovery sleep following overnight sleep deprivation. Fluorescence intensity is normalized to time-matched rested controls for each SD group. Two-way ANOVA finds a significant effect of group (F(3,82)=21.11, p<0.0001, n=18-24 hemispheres/group). * represents p<0.05 by Sidak’s pairwise comparisons test for SD vs control at the matched timepoint. (G) Hourly sleep timecourse from R13F02-Gal4>STaR flies that were provided 24h of baseline sleep before either control handling (grey) or food deprivation (magenta). Two-way Repeated Measures ANOVA finds a significant time-by-treatment interaction (F(47,3760)=20.51, p<0.0001, n=39-43 flies/group). (H) Representative images from R13F02-Gal4>STaR flies after control handling (left) or 24h of food deprivation (right). (I) Quantification of BRP::smFP_V5 abundance in MB lobes of R13F02-Gal4>STaR flies that have been fed standard fly media (grey) or starved for 24h (magenta). Two-way repeated measures ANOVA finds no significant effect of starvation (F(1,92)=3.229, p=0.0756, n=41-53 hemispheres/group). (J) Left panel depicts representative images from TH-Gal4>STaR flies after 12 hours of rest (left) or 12 hours of overnight SD (right). Presynapses labelled by STaR (BRP::V5) in red. Right panel shows quantification of BRP::smFP_V5 intensity in rested controls (gray) and after overnight SD (red) in PPL1 dopaminergic neurons labeled by TH-Gal4. Two-way ANOVA finds a significant sleep by MB compartment (F(4,556)=6.184, p<0.0001, n=69-72 hemispheres/group). (K) Left panel: representative images from R58E02-Gal4>STaR flies labeling BRP in PAM dopaminergic neurons after 12 hours of rest (left) or 12 hours of overnight SD (right). Presynapses labelled by STaR (BRP::V5) in blue. On right, quantification of BRP::smFP_V5 intensity in rested controls (gray) and after overnight SD (blue) in PAM DANs labeled by R58E02-Gal4. Two-way ANOVA finds a significant effect of SD (F(1,104)=7.893, p=0.0059, n=50-56 hemispheres/group). (L) Left, Representative images from GH146-Gal4>STaR flies after 12 hours of rest (left) or 12 hours of overnight SD (right). Presynapses labelled by STaR (BRP::V5) in green. Right panel shows quantification of BRP::smFP_V5 intensity in rested controls (gray) and after overnight SD (green) in APL labeled by GH146-Gal4. Two-way ANOVA finds a significant lobe by sleep interaction (F(4,480) = 6.672, p<0.0001, n=60-62 hemispheres/group). (M) On left, representative images from C316-Gal4>STaR flies after 12 hours of rest (left) or 12 hours of overnight SD (right). Presynapses labelled by STaR (BRP::smFP_V5) in green. Right panel depicts quantification of BRP::V5 intensity in rested controls (gray) and after overnight SD (green) in DPM labeled by C316-Gal4. Two-way ANOVA finds no significant effect of SD (F(1,79)=0.04082, p=0.84, n=40-41 hemispheres/group). See also Figure S2 for sleep traces from experimental groups shown in Figure 3 A-J, and Figure S3 for pre-synaptic BRP quantification from subsets of KC neurons. Scale bars depict 10 μm; error bars represent SEM for all panels.
Figure 4 –
Figure 4 –. Effects of SD on synaptic contacts between KCs and DANs, APL & DPM
(A) Schematic of connectivity between neuronal cell types in the MB. KC axons innervate tiled zones (depicted by shaded regions) that each receive innervation from distinct DANs and provide input to unique MBONs. APL and DPM interneurons receive input from and provide recurrent feedback to KC pre-synapses (Left). KC pre-synapses project onto MBON, DAN, APL, and DPM partners (Right). (B) Representative images of nsyb GRASP intensity between presynaptic KCs (MB-LexA) and postsynaptic PPL1 DANS (TH-Gal4) in rested controls (left) and in flies subjected to overnight SD (right). (C) Quantification of relative KC>PPL1 GRASP intensity after SD (orange) normalized to rested controls (gray). Two-way ANOVA finds a significant effect of SD (F(1,88)=91.81, p<0.0001, n=44-46 hemispheres/group). (D) Representative images of nsyb GRASP intensity between presynaptic KCs (MB-LexA) and postsynaptic PAM DANs (R58E02-Gal4) in rested controls (left) and in flies subjected to overnight SD (right). (E) Quantification of relative KC>PAM GRASP intensity in γ and β lobes after SD (purple), normalized to rested controls (gray). Two-way ANOVA finds no significant effect of SD (F(1,108)=0.09979, p=0.7527, n=54-56 hemispheres/group). (F) Representative images of nsyb GRASP intensity between presynaptic KCs (MB-LexA) and postsynaptic APL (GH146-Gal4) in the MB lobes of rested controls (left) and in flies subjected to overnight SD (right). (G) Quantification of relative KC>APL GRASP intensity after SD (red), normalized to rested controls (gray). Two-way ANOVA finds a significant effect of SD (F(1,127)=30.17, p<0.0001, n=64-65 hemispheres/group) (H) Representative images of nsyb GRASP intensity between presynaptic KCs (MB-LexA) and postsynaptic DPM (C316-Gal4) in rested controls (left) and in flies subjected to overnight SD (right). (I) Quantification of relative KC>DPM GRASP intensity after SD (magenta), normalized to rested controls (gray). Two-way ANOVA finds a significant effect of SD (F(1,93)=11.42, p=0.0011, n=46-49 hemispheres/group) See also Figure S4 for sleep traces from experimental groups shown in Figure 3 B-I. Scale bars depict 10 μm; error bars represent SEM for all panels.
Figure 5 –
Figure 5 –. KC>MBON connections exhibit compartment-specific changes with SD
(A) Representative images of nsyb GRASP intensity between presynaptic KCs (MB-LexA) and postsynaptic MBON-α’1 (MB543B-Gal4) in rested controls (left) and in flies subjected to overnight SD (right). (B) Quantification of relative KC>MBON-α’1 GRASP intensity after SD (orange), normalized to rested controls (gray). Two-tailed T-test finds a significant effect of SD (t=8.068, p<0.0001, n=54-66 hemispheres/group). (C) Representative images of nsyb GRASP intensity between presynaptic KCs (MB-LexA) and postsynaptic MBON-α2sc (R71D08-Gal4) in rested controls (left) and in flies subjected to overnight SD (right). (D) Quantification of relative KC>MBON-α2sc GRASP intensity after SD (orange), normalized to rested controls (gray). Two-tailed T-test finds a significant effect of SD (t=2.800, p=0.0057, n=78-102 hemispheres/group). (E) Representative images of nsyb GRASP intensity in the γ5 compartment between presynaptic KCs (MB-LexA) and postsynaptic MBON-γ5β’2a (R66C08-Gal4) in rested controls (left) and in flies subjected to overnight SD (right). (F) Quantification of relative KC>MBON-γ5β’2a GRASP intensity in the γ5 compartment after SD (blue), normalized to rested controls (gray). Two-tailed T-test finds a significant effect of SD (t=3.411, p=0.0011, n=34 hemispheres/group). (G) Representative images of nsyb GRASP intensity in the γ2 compartment between presynaptic KCs (MB-LexA) and postsynaptic MBON-γ2α’1 (R25D01-Gal4) in rested controls (left) and in flies subjected to overnight SD (right). (H) Quantification of relative KC>MBON-γ2α’1 GRASP intensity in the γ2 compartment after SD (orange), normalized to rested controls (gray). Two-tailed T-test finds a significant effect of SD (t=3.793, p=0.0003, n=44-48 hemispheres/group). (I) Representative images of nsyb GRASP intensity in the γ4 compartment between presynaptic KCs (MB-LexA) and postsynaptic MBON-γ4>γ1γ2 (MB434B-Gal4) in rested controls (left) and in flies subjected to overnight SD (right). (J) Quantification of relative KC>MBON-γ4>γ1γ2 GRASP intensity in the γ4 compartment after SD (blue), normalized to rested controls (gray). Two-tailed T-test finds no significant effect of SD (t=0.5245, p=0.6015, n=36-42 hemispheres/group). (K) Representative images of nsyb GRASP intensity in the β’2 compartment between presynaptic KCs (MB-LexA) and postsynaptic MBON-β’2mp, γ5β’2a (MB011B-Gal4) in rested controls (left) and in flies subjected to overnight SD (right). (L) Quantification of relative KC>MBON-β’2mp, γ5β’2a GRASP intensity in the β’2 compartment after SD (blue), normalized to rested controls (gray). Two-tailed T-test finds no significant effect of SD (t=0.1928, p=0.8480, n=22-26 hemispheres/group). (M) Representative images of GRASP labelling from presynaptic KCs (MB-LexA) and postsynaptic MBON-γ1pedc (R12G04-Gal4) in rested controls (left) and flies dissected after overnight sleep loss (right). (N) Relative quantification of KC>MBON-γ1pedc GRASP intensity in the γ1 compartments of rested (gray) and sleep deprived (light blue) brains. Two-tailed T-test finds no significant effect of SD (t=0.7659, p=0.4476, n=22-26 hemispheres/group). (O) Left; sleep totals for KC>MBON-α’1 GRASP flies either fed standard fly media (gray) or 0.1 mg/mL THIP (orange). Right; Relative KC>MBON-α’1 GRASP intensity for groups shown in left panel (gray depicts vehicle controls, orange shows 6h treatment with 0.1mg/mL THIP). Two-tailed T-tests find significant effects of THIP treatment on sleep (t=12.95, p<0.0001, n=54-56) and GRASP abundance (t=3.906, p=0.0002, n=44-54 hemispheres/group). (P) Left; 6h sleep amount for control (gray) and THIP-treated (blue; 0.1mg/mL THIP) KC>MBON-γ5β’2a GRASP flies. Right; Relative intensity of KC>MBON-γ5β’2a GRASP signal in control flies (gray) and flies fed THIP for 6h prior to dissection. Two-tailed T-test finds a significant effect of THIP treatment on sleep (t=10.14, p<0.0001, n=44-47) and on KC>MBON-γ5β’2a GRASP intensity (t=5.492, p<0.0001, n=46-52). See also Figure S5 for sleep traces from experimental groups in Figure A-L. Scale bars depict 10 μm; error bars represent SEM for all panels.

References

    1. Walker MP, Brakefield T, Morgan A, Hobson JA, and Stickgold R (2002). Practice with sleep makes perfect: sleep-dependent motor skill learning. Neuron 35, 205–211. - PubMed
    1. Ganguly-Fitzgerald I, Donlea JM, and Shaw PJ (2006). Waking experience affects sleep need in Drosophila. Science 313, 1775–1781. - PubMed
    1. Seugnet L, Suzuki Y, Vine L, Gottschalk L, and Shaw PJ (2008). D1 receptor activation in the mushroom bodies rescues sleep-loss-induced learning impairments in Drosophila. Curr Biol 18, 1110–1117. - PMC - PubMed
    1. Graves LA, Heller EA, Pack AI, and Abel T (2003). Sleep deprivation selectively impairs memory consolidation for contextual fear conditioning. Learn Memory 10, 168–176. - PMC - PubMed
    1. Krishnan HC, Gandour CE, Ramos JL, Wrinkle MC, Sanchez-Pacheco JJ, and Lyons LC (2016). Acute Sleep Deprivation Blocks Short- and Long-Term Operant Memory in Aplysia. Sleep 39, 2161–2171. - PMC - PubMed

Publication types

Substances

LinkOut - more resources