. 2021 Sep;27(9):1004-1016.
doi: 10.1261/rna.078709.121. Epub 2021 Jun 9.

Impact of scaffolding protein TNRC6 paralogs on gene expression and splicing

Affiliations

Impact of scaffolding protein TNRC6 paralogs on gene expression and splicing

Samantha T Johnson et al. RNA. 2021 Sep.

Abstract

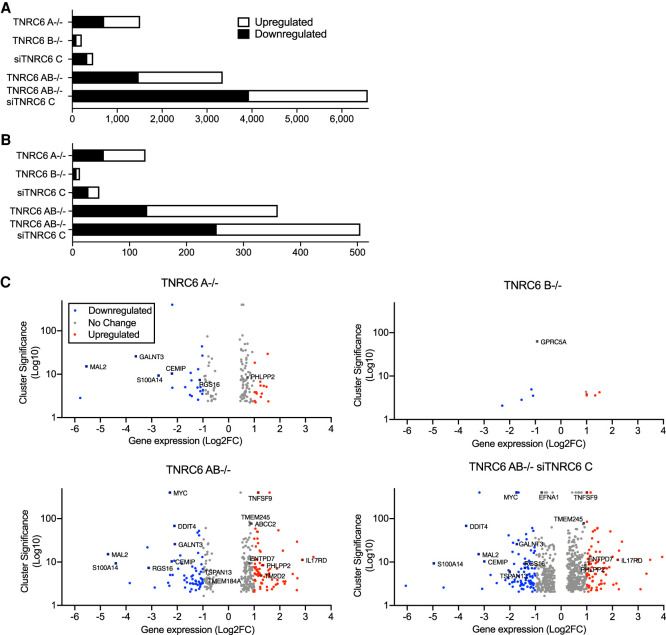
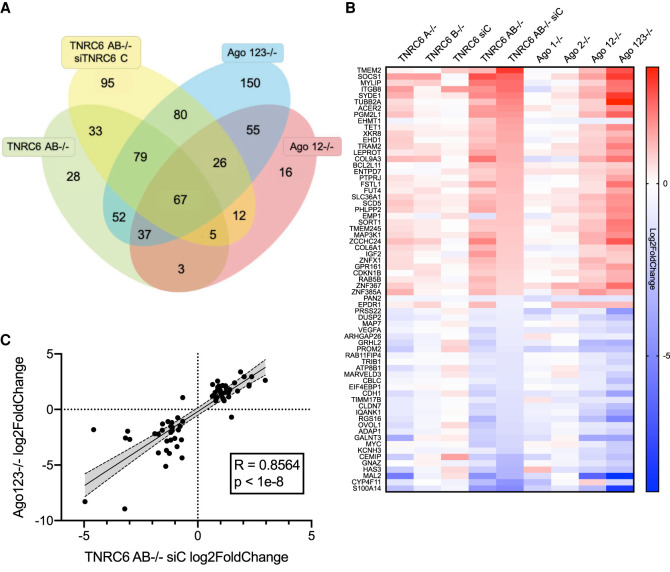
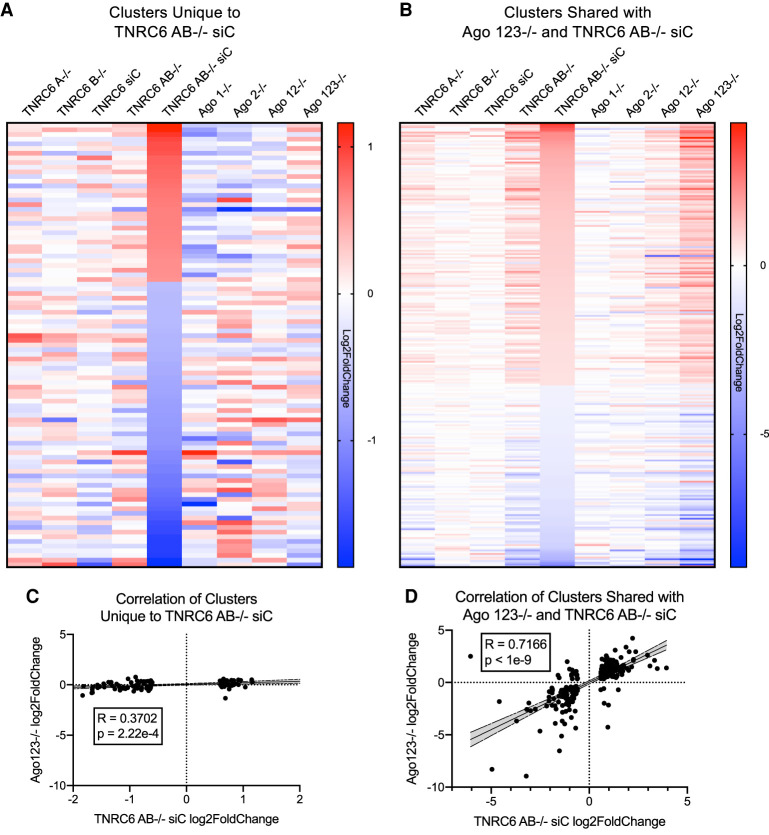
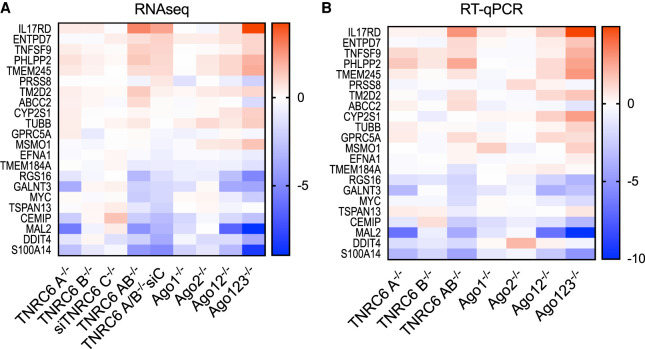
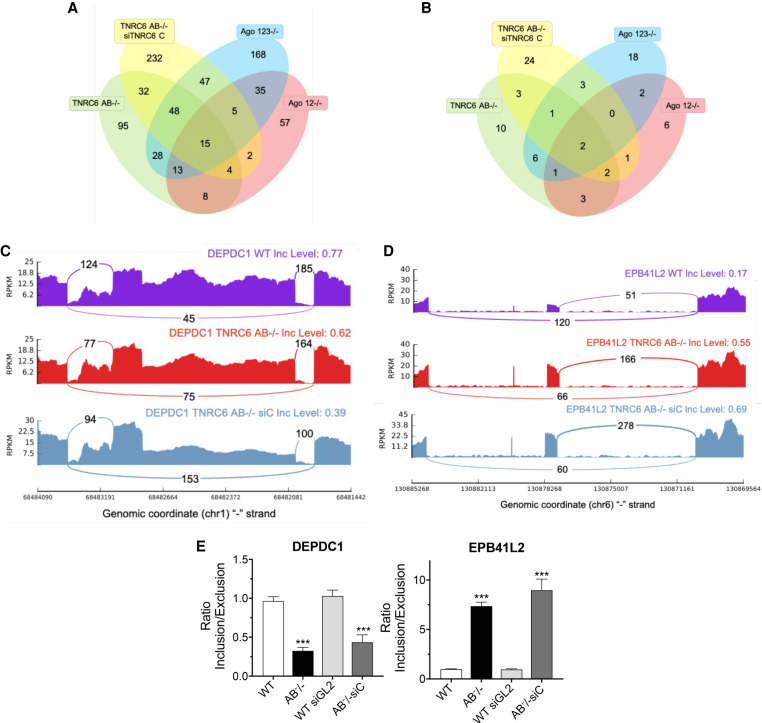
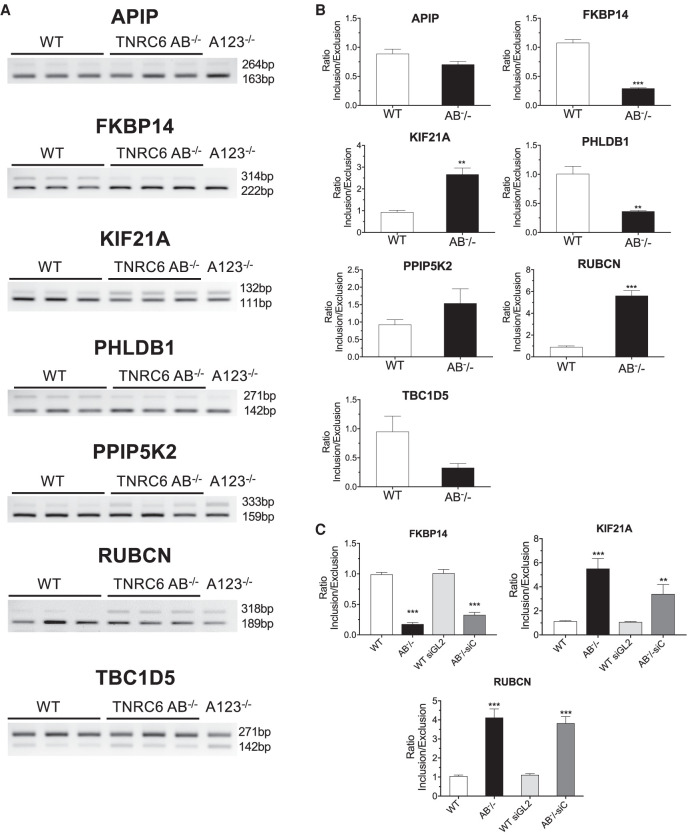
TNRC6 is a scaffolding protein that bridges interactions between small RNAs, argonaute (AGO) protein, and effector proteins to control gene expression. There are three paralogs in mammalian cells, TNRC6A, TNRC6B, and TNRC6C These paralogs have ∼40% amino acid sequence identity and the extent of their unique or redundant functions is unclear. Here, we use knockout cell lines, enhanced crosslinking immunoprecipitation (eCLIP), and high-throughput RNA sequencing (RNA-seq) to explore the roles of TNRC6 paralogs in RNA-mediated control of gene expression. We find that the paralogs are largely functionally redundant and changes in levels of gene expression are well-correlated with those observed in AGO knockout cell lines. Splicing changes observed in AGO knockout cell lines are also observed in TNRC6 knockout cells. These data further define the roles of the TNRC6 isoforms as part of the RNA interference (RNAi) machinery.

Keywords: Argonaute; GW182; RNA interference; RNA sequencing; TNRC6; alternative splicing.


Figures

FIGURE 1.
FIGURE 1.
Effect of loss of TNRC6A, TNRC6B, or TNRC6C expression on cell cycle and cell proliferation. (A) Diagram of TNRC6A, TNRC6B, and TNRC6C proteins, with known motifs, knockout mutations, and deletions. (B) Bar graph of TNRC6 paralog's fragments per kilobase values obtained from whole-cell RNA sequencing of knockout cell lines. TNRC6B and FAM83F are overlapping genes. (C) Percentage of cells in each stage of the cell cycle. (D) Growth curve for cell lines transfected with anti-TNRC6C siRNA. (E) Percentage of cells in each stage of the cell cycle for transfected cell lines wild-type after transfection with siTNRC6C, or control duplex siGL2. (*) P > 0.05; (**) P > 0.01. (***) P > 0.001.
FIGURE 2.
FIGURE 2.
Association of AGO2 protein binding and gene expression in TNRC6 knockout cells. (A) Total number of significantly up- or down-regulated genes in knockout cell lines. (B) Total number of significantly up- or down-regulated genes in knockout cell lines that overlap with AGO2 binding sites in coding sequences (CDS) and in the 3′ untranslated regions (3′UTR). (C) Volcano plots of gene expression in TNRC6 knockout cell lines.
FIGURE 3.
FIGURE 3.
Consistent variation for AGO2 protein binding cluster's gene expression changes in TNRC6 and AGO knockout cells. (A) Venn diagram showing the overlap of gene expression changes associated with AGO2 binding within 3′-UTRs. AGO2 binding was determined by eCLIP as described (Chu et al. 2020) and was required for inclusion. (B) Heatmap showing gene expression changes (Log2FoldChange) shared by TNRC6 and AGO knockout cell lines. (C) Correlation plot of the 67 overlapping genes shown in B of AGO 123−/− and TNRC6 AB−/− siC log2FoldChanges. Shaded region is 95% confidence band.
FIGURE 4.
FIGURE 4.
Comparison of gene expression in TNRC6 and AGO knockout cells. (A) Heatmap of Log2FoldChange gene expression changes of 95 genes with AGO2 protein binding clusters that change significantly only in the TNRC6AB−/− siTNRC6C cells. (B) Heatmap of Log2FoldChange gene expression changes of 252 genes with AGO2 clusters that change significantly in TNRC6 AB−/− siTNRC6C and AGO123−/− cells (not including the 67 genes previously shown in Fig. 3B). (C) Correlation plot of the 95 genes unique to TNRC6 AB−/− siC shown in A of AGO 123−/− and TNRC6 AB−/− siC log2FoldChanges. Shaded region is 95% confidence band. (D) Correlation plot of the 252 genes changed in AGO123−/− and TNRC6 AB−/− siC in shown in B of AGO 123−/− and TNRC6 AB−/− siC log2FoldChanges. Shaded region is 95% confidence band.
FIGURE 5.
FIGURE 5.
Consistent variation of gene expression in cells with highly ranked AGO2 protein binding clusters. (A) Heatmap of gene expression changes from TNRC6 knockout and AGO knockout cell lines from RNA sequencing for 22 cluster genes examined in Chu et al. (2020). (B) Heatmap of gene expression changes from TNRC6 knockout and AGO knockout cell lines from RT-qPCR for 22 cluster genes examined in Chu et al. (2020).
FIGURE 6.
FIGURE 6.
Changes in alternative splicing in TNRC6 knockout cell lines. (A) Venn diagram of skipped exon splicing events. (B) Venn diagram of skipped exon splicing events located near AGO2 binding clusters. (C,D) Sashimi plots for genes DEPDC1 and EPB41L2 that overlap between TNRC6 AB−/− and TNRC6 AB−/− siC RNA-seq data sets in B. (E) qPCR validation of skipped exon events in TNRC6 A/B knockout and TNRC6 A/BKO/siC cells. Error bars represent standard deviation (SD). (*) P < 0.05; (**) P < 0.01; (***) P < 0.001 compared with control cell by two tailed t-test.
FIGURE 7.
FIGURE 7.
Validating the effect of TNRC6 knockouts on alternative splicing. (A) Semiquantitative PCR validation of skipped exon events in TNRC6 A/B knockout cells. (B) Quantitation of data shown in in part A. (C) QPCR validation of skipped exon events in TNRC6 A/B knockout and TNRC6 A/B knockout/siCTNRC6 knockdown cells. Error bars represent standard deviation (SD). (*) P < 0.05; (**) P < 0.01; (***) P < 0.001 compared with control cell by two tailed t-test.

References

    1. Albert TK, Lemaire M, van Berkum NL, Gentz R, Collart MA, Timmers HT. 2000. Isolation and characterization of human orthologs of yeast CCR4-NOT complex subunits. Nucleic Acids Res 28: 809–817. 10.1093/nar/28.3.809 - DOI - PMC - PubMed
    1. Allo M, Buggiano V, Fededa JP, Petrillo E, Schor I, de la Mata M, Agirre E, Plass M, Eyras E, Elela SA, et al.2009. Control of alternative splicing through siRNA-mediated transcriptional gene silencing. Nat Struct Mol Biol 16: 717–724. 10.1038/nsmb.1620 - DOI - PubMed
    1. Baillat D, Shiekhattar R. 2009. Functional dissection of the human TNRC6 (GW182-related) family of proteins. Mol Cell Biol 29: 4144–4155. 10.1128/MCB.00380-09 - DOI - PMC - PubMed
    1. Behm-Ansmant I, Rehwinkel J, Doerks T, Stark A, Bork P, Izaurralde E. 2006. mRNA degradation by miRNAs and GW182 requires both CCR4:NOT deadenylase and DCP1:DCP2 decapping complexes. Genes Dev 20: 1885–1898. 10.1101/gad.1424106 - DOI - PMC - PubMed
    1. Briskin D, Wang PY, Bartel DP. 2020. The biochemical basis for the cooperative action of microRNAs. Proc Natl Acad Sci 117: 17764–17774. 10.1073/pnas.1920404117 - DOI - PMC - PubMed

Publication types