. 2022 Mar;71(3):534-543.
doi: 10.1136/gutjnl-2020-323778. Epub 2021 Jun 8.

Dysosmobacter welbionis is a newly isolated human commensal bacterium preventing diet-induced obesity and metabolic disorders in mice

Affiliations

Dysosmobacter welbionis is a newly isolated human commensal bacterium preventing diet-induced obesity and metabolic disorders in mice

Tiphaine Le Roy et al. Gut. 2022 Mar.

Abstract

Objective: To investigate the abundance and the prevalence of Dysosmobacter welbionis J115T, a novel butyrate-producing bacterium isolated from the human gut both in the general population and in subjects with metabolic syndrome. To study the impact of this bacterium on host metabolism using diet-induced obese and diabetic mice.

Design: We analysed the presence and abundance of the bacterium in 11 984 subjects using four human cohorts (ie, Human Microbiome Project, American Gut Project, Flemish Gut Flora Project and Microbes4U). Then, we tested the effects of daily oral gavages with live D. welbionis J115T on metabolism and several hallmarks of obesity, diabetes, inflammation and lipid metabolism in obese/diabetic mice.

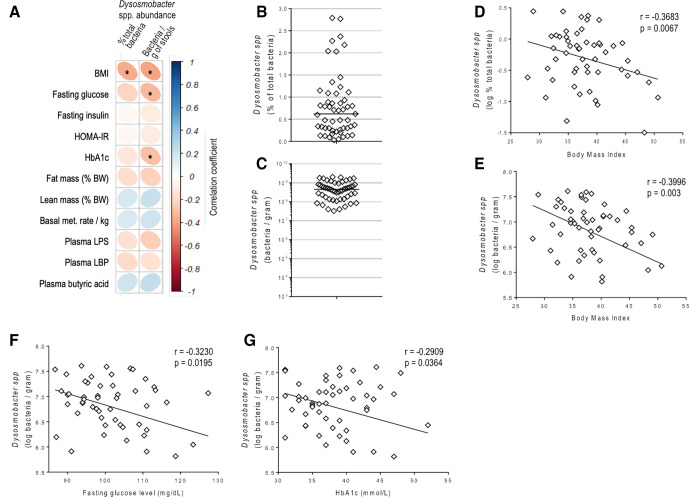
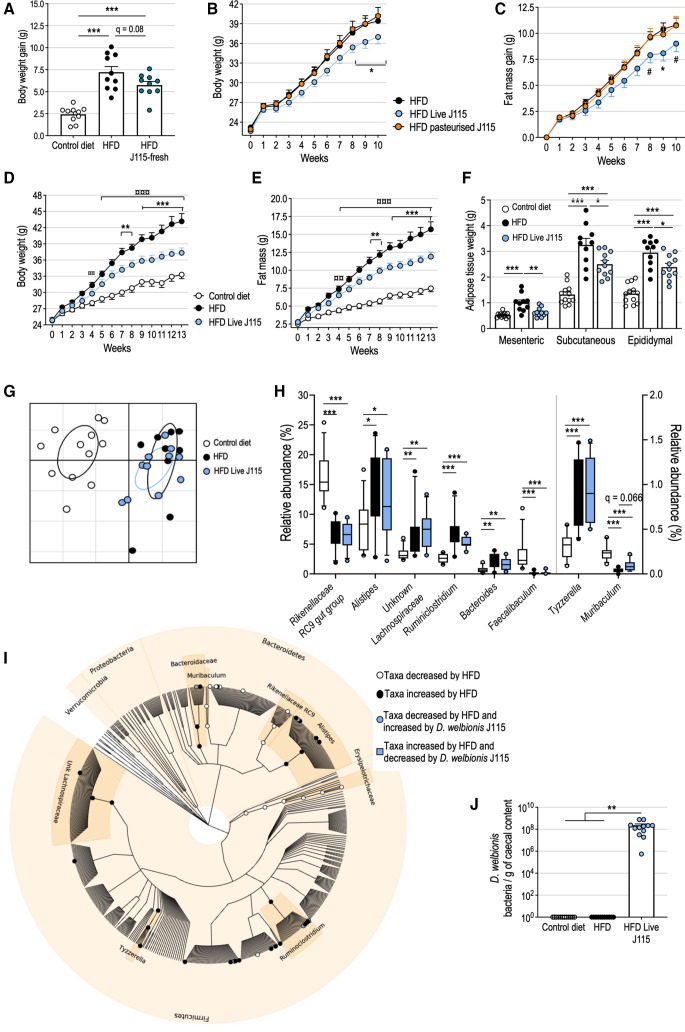
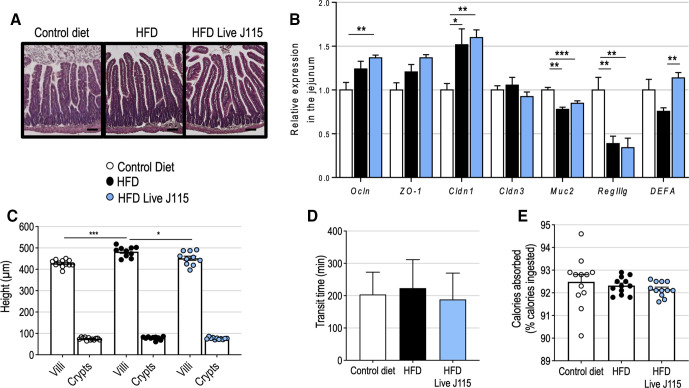
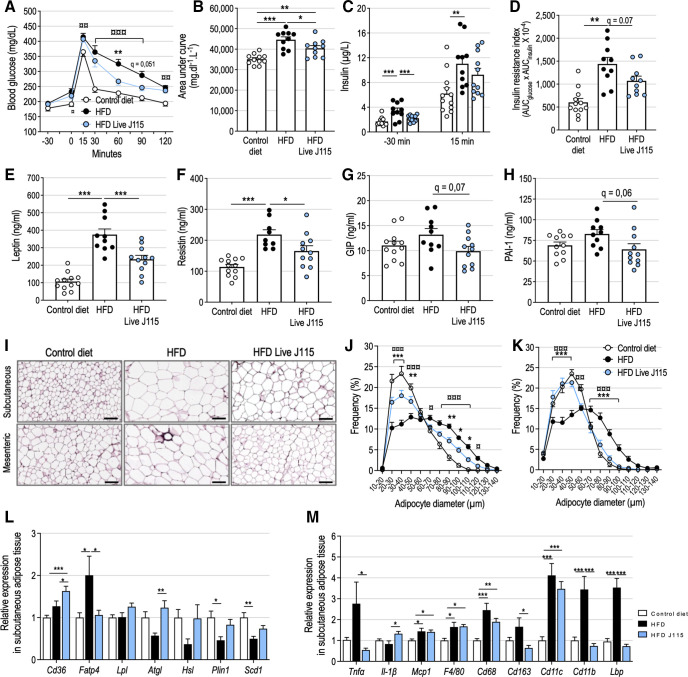
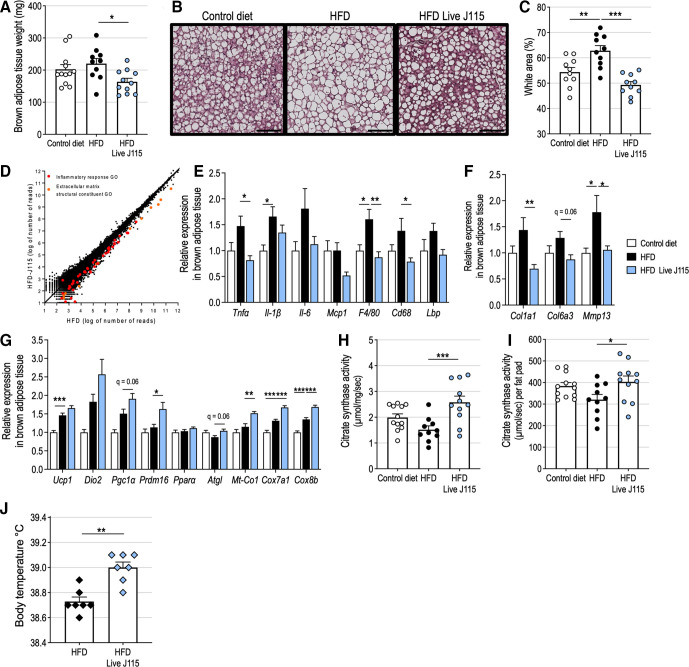
Results: This newly identified bacterium was detected in 62.7%-69.8% of the healthy population. Strikingly, in obese humans with a metabolic syndrome, the abundance of Dysosmobacter genus correlates negatively with body mass index, fasting glucose and glycated haemoglobin. In mice, supplementation with live D. welbionis J115T, but not with the pasteurised bacteria, partially counteracted diet-induced obesity development, fat mass gain, insulin resistance and white adipose tissue hypertrophy and inflammation. In addition, live D. welbionis J115T administration protected the mice from brown adipose tissue inflammation in association with increased mitochondria number and non-shivering thermogenesis. These effects occurred with minor impact on the mouse intestinal microbiota composition.

Conclusions: These results suggest that D. welbionis J115T directly and beneficially influences host metabolism and is a strong candidate for the development of next-generation beneficial bacteria targeting obesity and associated metabolic diseases.

Keywords: intestinal microbiology; obesity; probiotics.


Conflict of interest statement

Competing interests: PDC is cofounder of A-Mansia biotech. TLR and PDC are inventors on patent applications dealing with the use bacteria in the treatment of obesity and related disorders.

Figures

Figure 1
Figure 1
Dysosmobacter spp correlates negatively with BMI in humans. (A) Pearson’s correlation matrix between Dysosmobacter spp abundance in the faecal microbiota and clinical variables in the Microbes4U cohort. *P<0.05. (B) Dysosmobacter spp relative abundance in the faecal microbiota of a cohort of overweight and obese humans. (C) Dysosmobacter spp concentration in stool samples from a cohort of overweight and obese humans. (D) Pearson’s correlation between Dysosmobacter spp relative abundance and BMI. (E) Pearson’s correlation between Dysosmobacter spp absolute concentration and BMI. (F) Pearson’s correlation between Dysosmobacter spp concentration and fasting blood glucose. (G) Pearson’s correlation between Dysosmobacter spp. and glycated haemoglobin. Results are represented as dot-plots with median for figure parts B, C. BMI, body mass index; HbA1c, glycated haemoglobin.
Figure 2
Figure 2
Live Dysosmobacter welbionis J115T prevents diet-induced obesity in mice without major alterations of the faecal microbiota composition. (a) Body weight gain of mice fed a HFD and treated during 6 weeks by daily oral gavage with 1.0×10⁹ colony forming units (cfus) of freshly prepared D. welbionis J115T (HFD J115-fresh) and mice fed a control diet or a high-fat diet (HFD) and treated by daily oral gavage with vehicle. (B, C) Body weight and fat mass gain of mice treated during 10 weeks by daily oral gavage with live D. welbionis J115T frozen in trehalose (1.0×10⁹ cultivable, live bacteria per day and per mouse) and fed a HFD (HFD Live J115) or pasteurised D. welbionis J115T (HFD pasteurised J115) (1.0×10⁹ heat-killed bacteria per day and per mouse) and mice fed a HFD and treated by daily oral gavage with vehicle. (D, E) Body weight and fat mass of mice treated during 13 weeks by daily oral gavage live D. welbionis J115T frozen in trehalose (1.0×10⁹ cultivable, live bacteria per day and per mouse) and fed a HFD (HFD Live J115) and mice fed a control diet or a HFD and treated by daily oral gavage with vehicle. (F) Mesenteric, subcutaneous (inguinal) and epididymal fat pads weight at the end of the 13-week period. (G) Principal coordinates analysis of the microbiota composition of experiment 2. Mice microbiota were clustered and the centre of gravity computed for each group. (H) Relative abundance of the bacterial genera significantly altered by HFD or live D. welbionis J115T treatments. (I) Cladogram representing mice microbiota with white clade markers highlighting bacterial groups significantly more abundant in control mice than in HFD mice, black clade markers markers highlighting bacterial groups significantly more abundant in HFD mice than in control mice and light blue clade markers highlighting bacterial groups significantly increased (circle) or decreased (square) by live D. welbionis J115T administration in HFD-fed mice as assessed by figure part H. (J) Dysosmobacter spp concentration estimated by quantitative PCR in the caecal content of the mice. Number of mice per group: 10–12. Data were analysed using one-way analysis of variance (ANOVA) followed by Tukey’s post hoc test for figure parts A, F and J and two-way repeated measures ANOVA for figure parts B–E. Data were analysed using Kruskal–Wallis test followed by Dunn’s pairwise multiple comparison procedure for H–I. *q<0.05; **q<0.01; ***q<0.001. Results are represented as dot plots and bar plots with mean±SEM for figure parts A, F and J, and as boxes and whiskers (first quartile, median and third quartile) for figure part H. In figure parts B–E *q < 0.05; **q<0.01; ***q<0.001 for HFD versus HFD Live J115 comparisons and ¤¤¤q<0.001 for control versus HFD comparisons. In figure part C, #p=0.06. HFD, high-fat diet.
Figure 3
Figure 3
Live Dysosmobacter welbionis J115T moderately alters gut physiology. (A) Representative H&E-stained pictures of the jejunum. Scale bar=100 µm. (B) Relative expression of genes related to gut barrier function in the jejunum. (C) Mean crypts and villi’s height in the jejunum. (D) Transit time. (E), Percentage of calories absorbed from the food. Number of mice per group: 10–12. Data were analysed using one-way analysis of variance followed by Tukey’s post hoc test for figure part B. *q<0.05; ***q<0.001. Results are represented as bar plots with mean±SEM for figure parts B–D and dot plots and bar plots with mean±SEM for figure parts C–E. HFD, high-fat diet.
Figure 4
Figure 4
Live Dysosmobacter welbionis J115T reduces adipose tissue expansion and inflammation on high-fat diet (HFD) and improves altered metabolic profile. (A) Plasma glucose profile and (B) mean area under the curve measured during an oral glucose tolerance test (OGTT). (C) Plasma insulin measured 30 min before and 15 min after glucose administration during the OGTT. (D) Insulin resistance index. (E) Leptin, (F) resistin, (G) glucose-dependent insulinotropic polypeptide (GIP) and (H) plasminogen activator inhibitor-1 (PAI-1) plasma levels after a 6 hours fasting period. (I) Representative H&E-stained pictures of subcutaneous and mesenteric adipose tissues (SAT and MAT, respectively). Scale bar=100 µm. (J) Adipocytes diameter (µm) distribution in the SAT. (K) Adipocytes diameter (µm) distribution in the MAT. (L) Relative expression of genes related to lipid metabolism in the SAT. (M) Relative expression of genes related to inflammation and immune system in the SAT. Number of mice per group: 9–12. Results are represented as dot plots and bar plots with mean±SEM for figure parts B–H and as bar plots with mean±SEM for figure parts L and M. Data were analysed using one-way analysis of variance (ANOVA) followed by Tukey’s post hoc test for figure parts B–H, L and M and two-way repeated measures ANOVA for figure parts A, J and K. *q<0.05; **q<0.01; ***q<0.001 for HFD versus HFD Live J115 comparisons and ¤¤q<0.01 control versus HFD, ¤¤¤q<0.001 for control versus HFD comparisons. HFD, high-fat diet.
Figure 5
Figure 5
Live Dysosmobacter welbionis J115T reduces high fat diet (HFD)-induced brown adipose tissue (BAT) dysfunction and increases mitochondria number. (A) Interscapular BAT weight of mice treated by daily oral gavage with live D. welbionis J115T frozen in trehalose and fed an HFD (HFD Live J115) or mice fed a control diet or a HFD and treated by daily oral gavage with an equivalent volume of vehicle. (B) Representative H&E-stained pictures of BAT. Scale bar=100 µm. (C) Percentage of white area on the slices, corresponding to lipid droplets, in the BAT. (D) Scatter dot plot between RNA-seq expression data of a pool of RNA from the BAT of HFD mice and a pool of RNA from the BAT of HFD J115 mice. (E) Relative expression of genes related to inflammation and immune system in the BAT. (F) Relative expression of genes related to extracellular matrix and fibrosis in the BAT. (G) Relative expression of genes related to mitochondria number and function in the BAT. (H) citrate synthase activity per mg of BAT. (I) Citrate synthase activity per brown fat pad. (J) Body temperature of mice treated by daily oral gavage with live D. welbionis J115T and fed a high fat-diet (HFD Live J115) or mice fed a high-fat diet (HFD) and gavaged daily with vehicle for 3 weeks (experiment 4, see methods). Number of mice per group: 10–12 in figure parts A, C and E–I). Number of mice per group: 7 in figure part J. Results are represented as dot plots and bar plots with mean±SEM for figure part A, C and H–J and as bar plots with mean±SEM for figure parts E–G. Data were analysed using one-way analysis of variance followed by Tukey’s post hoc test for figure parts A, C and E–I and Mann-Whitney test for figure part J. *q<0.05; **p or q<0.01; ***q<0.001.HFD, high-fat diet.

References

    1. Cani PD, Van Hul M, Lefort C, et al. . Microbial regulation of organismal energy homeostasis. Nat Metab 2019;1:34–46. 10.1038/s42255-018-0017-4 - DOI - PubMed
    1. Marx W, Lane M, Hockey M, et al. . Diet and depression: exploring the biological mechanisms of action. Mol Psychiatry 2021;26:134–50. 10.1038/s41380-020-00925-x - DOI - PubMed
    1. Cani PD. Gut microbiota — at the intersection of everything? Nat Rev Gastroenterol Hepatol 2017;14:321–2. 10.1038/nrgastro.2017.54 - DOI - PubMed
    1. Aron-Wisnewsky J, Vigliotti C, Witjes J, et al. . Gut microbiota and human NAFLD: disentangling microbial signatures from metabolic disorders. Nat Rev Gastroenterol Hepatol 2020;17:279–97. 10.1038/s41575-020-0269-9 - DOI - PubMed
    1. Le Chatelier E, Nielsen T, Qin J, et al. . Richness of human gut microbiome correlates with metabolic markers. Nature 2013;500:541–6. 10.1038/nature12506 - DOI - PubMed

Publication types

Supplementary concepts