. 2021 Jun 9;12(1):3506.
doi: 10.1038/s41467-021-23655-2.

Variant-specific inflation factors for assessing population stratification at the phenotypic variance level

Collaborators, Affiliations

Variant-specific inflation factors for assessing population stratification at the phenotypic variance level

Tamar Sofer et al. Nat Commun. .

Abstract

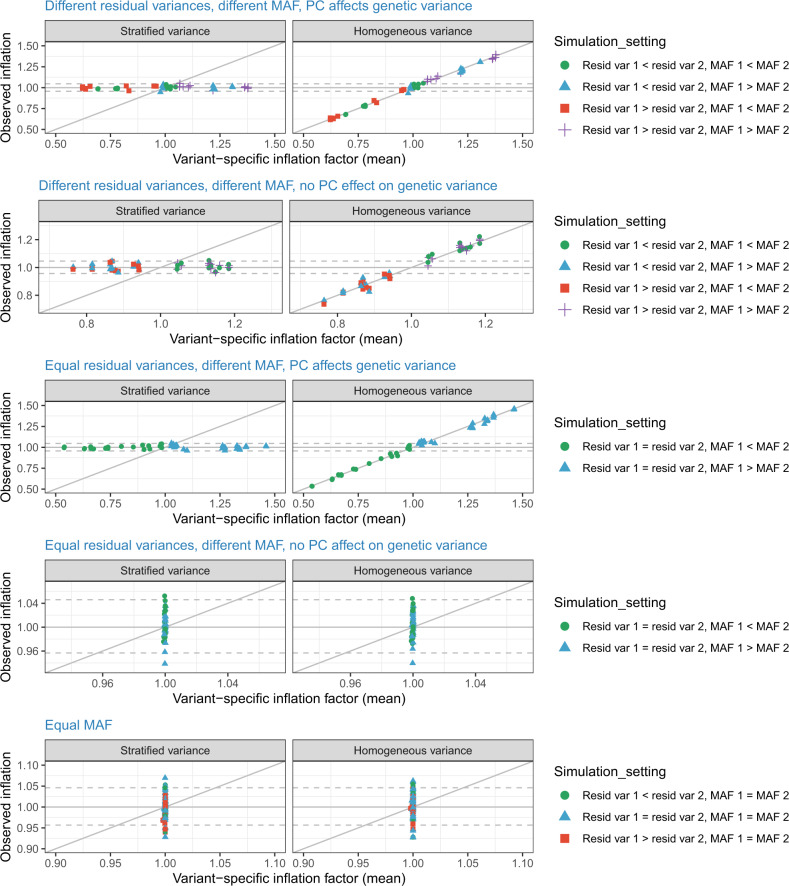
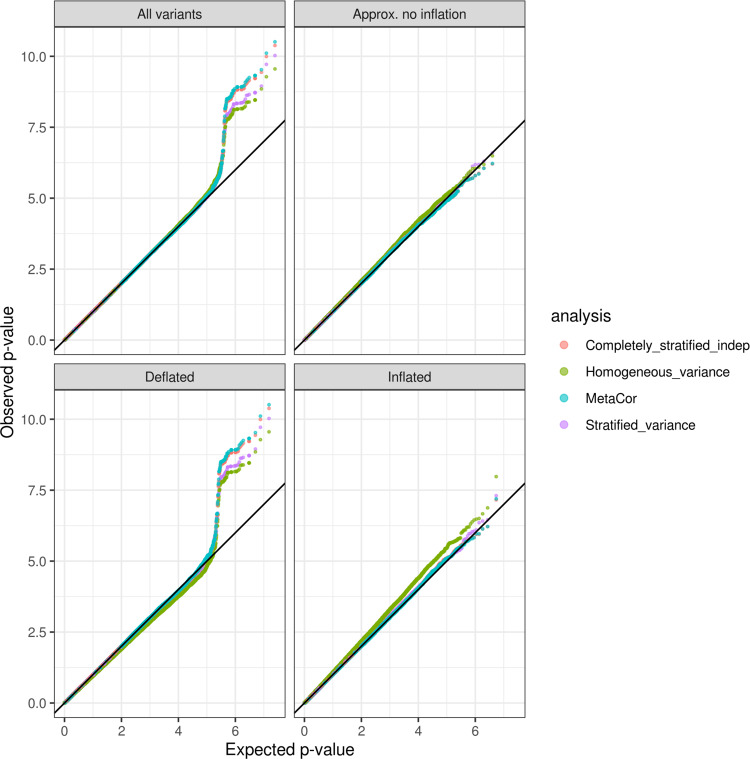
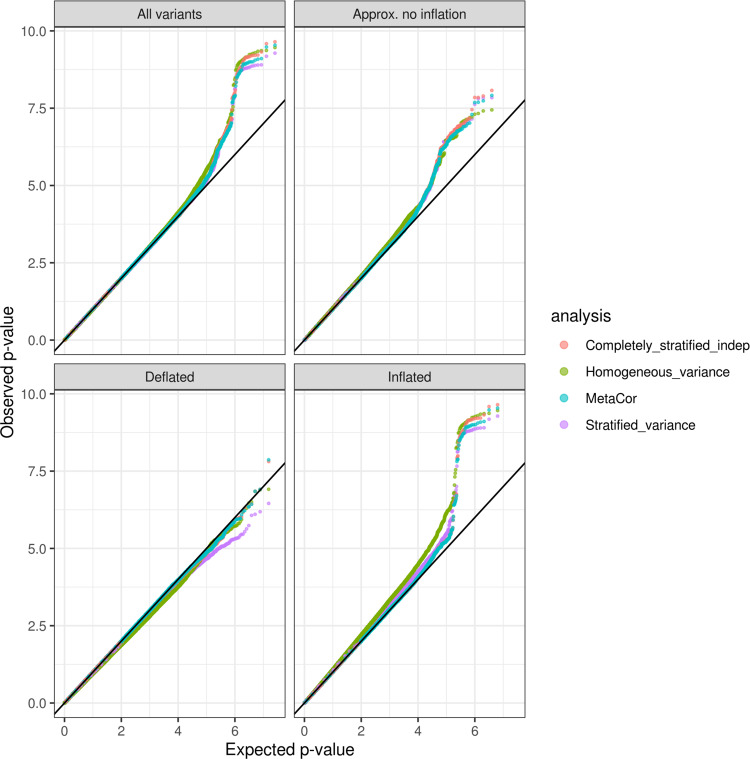
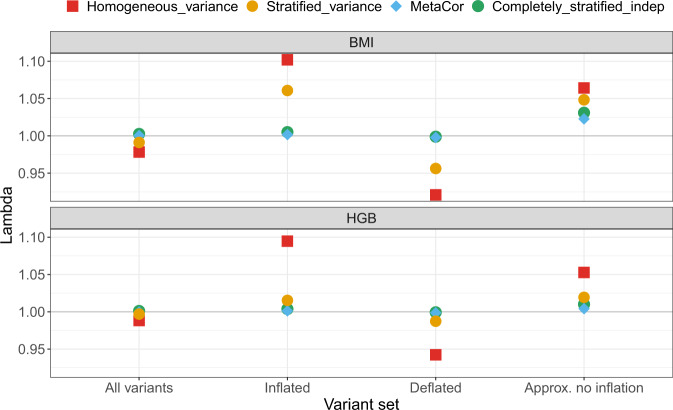
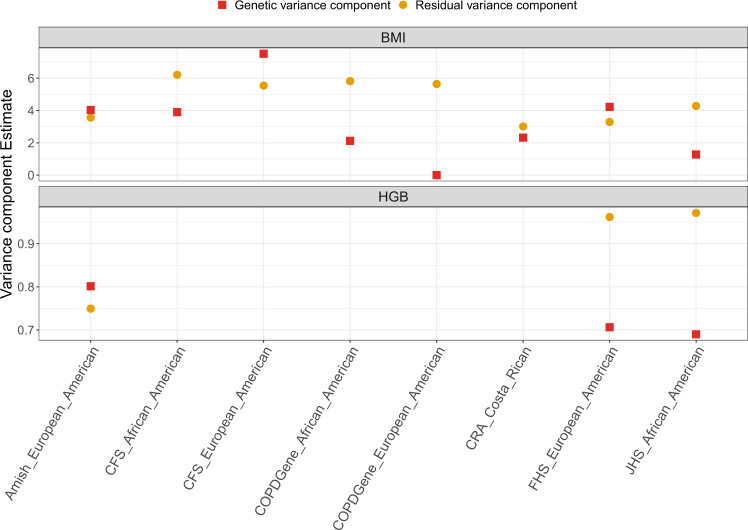
In modern Whole Genome Sequencing (WGS) epidemiological studies, participant-level data from multiple studies are often pooled and results are obtained from a single analysis. We consider the impact of differential phenotype variances by study, which we term 'variance stratification'. Unaccounted for, variance stratification can lead to both decreased statistical power, and increased false positives rates, depending on how allele frequencies, sample sizes, and phenotypic variances vary across the studies that are pooled. We develop a procedure to compute variant-specific inflation factors, and show how it can be used for diagnosis of genetic association analyses on pooled individual level data from multiple studies. We describe a WGS-appropriate analysis approach, implemented in freely-available software, which allows study-specific variances and thereby improves performance in practice. We illustrate the variance stratification problem, its solutions, and the proposed diagnostic procedure, in simulations and in data from the Trans-Omics for Precision Medicine Whole Genome Sequencing Program (TOPMed), used in association tests for hemoglobin concentrations and BMI.


Conflict of interest statement

Bruce M. Psaty serves on the Steering Committee of the Yale Open Data Access Project funded by Johnson & Johnson. All other authors declare no competing interests.

Figures

Fig. 1
Fig. 1. Estimated variant-specific inflation factors versus observed inflation in simulations.
The figure compares estimated variant-specific inflation factors λvs estimated in each of many simulation settings, and corresponding observed inflation λgc averaged across 10,000 repetitions of each simulation settings. Observed inflation values are provided based on a homogeneous variance model, in which a single variance parameter is estimated using the aggregated data; and based on a stratified variance model, that fits a different variance parameter to each of the two simulated studies. Each simulation set corresponds to a single point on this figure, and the simulations are grouped (denoted by different colors and symbols) by the characteristics stated in the legend. Within each group of simulation settings, the simulation parameters differ by specific parameter values, including MAFs, variance components, and sample sizes, while still satisfying the broad conditions of the grouped simulation settings. The dashed horizontal lines correspond to the 2.5% and 97% quantiles of the distribution of λgc based on 10,000 variants under the null of no inflation/deflation, obtained from simulations.
Fig. 2
Fig. 2. QQ-plots comparing observed and expected p values (−log10 transformed) from the analysis of hemoglobin concentrations.
The analyses used four approaches: “homogeneous variance” model, that assumes that all groups in the analysis have the same variances; “stratified variance” model, that allows for different residual variances across analysis groups; a “completely stratified indep” model in which analysis groups were analyzed separately, allowing for both heterogeneous residual and genetic variances across groups, and then combined together in meta-analysis under independence assumption, and “MetaCor”, a procedure that accounts for relatedness across strata in the meta-analysis. The QQ-plots are provided across sets of variants classified by their inflation/deflation patterns according to the algorithm for variant-specific approximate inflation factors. We categorized variants as “Approx. no inflation” when they had estimated λvs between 0.99 and 1.01, “Deflated” when estimated λvs lower than 0.99, and “Inflated” when they had estimated λvs higher than 1.01.
Fig. 3
Fig. 3. QQ-plots comparing observed and expected p values (−log10 transformed) from the analysis of BMI.
The analyses used four approaches: “homogeneous variance” model, which assumes that all groups in the analysis have the same variances; “stratified variance” model, which allows for different residual variances across analysis groups; a “completely stratified indep” model in which analysis groups were analyzed separately, allowing for both heterogeneous residual and genetic variances across groups, and then combined together in meta-analysis under independence assumption, and “MetaCor”, a procedure that accounts for relatedness across strata in the meta-analysis. The QQ-plots are provided across sets of variants classified by their inflation/deflation patterns according to the algorithm for variant-specific approximate inflation factors. We categorized variants as “Approx. no inflation” when they had estimated λvs between 0.99 and 1.01, “Deflated” when estimated λvs lower than 0.99, and “Inflated” when they had estimated λvs higher than 1.01.
Fig. 4
Fig. 4. Estimated genomic control inflation factors (λgc) across compared analyses.
The figure provides estimated λgc from the various analyzes of BMI and hemoglobin concentrations, computed across sets of variants classified by their inflation/deflation patterns according to the algorithm for approximate variant-specific inflation factors (λvs). We categorized variants as “Approx. no inflation” when they had estimated λvs between 0.99 to 1.01, “Deflated” when estimated λvs were lower than 0.99, and “Inflated” when they had estimated λvshigher than 1.01. Genomic control inflation factors λgc were computed as the ratio between the median χ12 test statistic across variants in the set to the theoretical median of the test statistic under the null hypothesis of no association.
Fig. 5
Fig. 5. Estimated variance components across compared analyses.
The figure provides the estimated variance components corresponding to residual and genetic relatedness in the analyzes of BMI and hemoglobin concentration (HGB). For each analysis group, the estimated variance components were computed based on the analysis of the group alone, and were extracted from the second null model in the fully-adjusted two-stage rank-normalization procedure, to match the procedure used for association analysis.

References

    1. Hellwege JN, et al. Population stratification in genetic association. Stud. Curr. Protoc. Hum. Genet. 2017;95:1.22.1–1.3. - PMC - PubMed
    1. Cardon LR, Palmer LJ. Population stratification and spurious allelic association. Lancet. 2003;361:598–604. doi: 10.1016/S0140-6736(03)12520-2. - DOI - PubMed
    1. Price AL, et al. Principal components analysis corrects for stratification in genome-wide association studies. Nat. Genet. 2006;38:904–909. doi: 10.1038/ng1847. - DOI - PubMed
    1. Yang J, Lee SH, Goddard ME, Visscher PM. Genome-wide complex trait analysis (GCTA): methods, data analyses, and interpretations. Methods Mol. Biol. 2013;1019:215–236. doi: 10.1007/978-1-62703-447-0_9. - DOI - PubMed
    1. Conomos MP, Reiner AP, Weir BS, Thornton TA. Model-free estimation of recent genetic relatedness. Am. J. Hum. Genet. 2016;98:127–148. doi: 10.1016/j.ajhg.2015.11.022. - DOI - PMC - PubMed

Publication types