Meta-Analysis
. 2021 Jun 9;12(1):3471.
doi: 10.1038/s41467-021-23579-x.

Time trajectories in the transcriptomic response to exercise - a meta-analysis

Affiliations
Meta-Analysis

Time trajectories in the transcriptomic response to exercise - a meta-analysis

David Amar et al. Nat Commun. .

Abstract

Exercise training prevents multiple diseases, yet the molecular mechanisms that drive exercise adaptation are incompletely understood. To address this, we create a computational framework comprising data from skeletal muscle or blood from 43 studies, including 739 individuals before and after exercise or training. Using linear mixed effects meta-regression, we detect specific time patterns and regulatory modulators of the exercise response. Acute and long-term responses are transcriptionally distinct and we identify SMAD3 as a central regulator of the exercise response. Exercise induces a more pronounced inflammatory response in skeletal muscle of older individuals and our models reveal multiple sex-associated responses. We validate seven of our top genes in a separate human cohort. In this work, we provide a powerful resource ( www.extrameta.org ) that expands the transcriptional landscape of exercise adaptation by extending previously known responses and their regulatory networks, and identifying novel modality-, time-, age-, and sex-associated changes.


Conflict of interest statement

The authors declare no competing interests.

Figures

Fig. 1
Fig. 1. Study overview.
We started with a search in the Gene Expression Omnibus. Manual examination of the studies and a set of filters resulted in 43 studies that had whole-genome expression profiles from blood and muscle. The data covered 59 exercise cohorts that were partitioned into four types of meta-analysis (i.e., by tissue and exercise modality). Seven-hundred and thirty-nine subjects were included in total, where some are represented in several cohorts, for example when sampling was made in association to both acute exercise and long-term training.
Fig. 2
Fig. 2. Random-effects meta-analysis results.
a Venn diagram of the significant GSEA pathway sets discovered with 10% Benjamini–Yekutieli FDR correction. The two common pathways are listed on the left. Pink—acute muscle changes, purple—long-term muscle changes, turquoise—long-term blood changes, green—acute blood changes. b Forest plot of the effect sizes of MRPL34 in acute muscle cohorts illustrates the importance of adding time as a moderator. Rows represent the 95% confidence interval of a fold-change of a cohort in a given time point. Thus, in each interval the center represents the fold-change estimate and the error bars are proportional to the fold-change standard error. Downregulation is observed only in time points >20 h. Cohort: the ID given to the cohort in this study (see Supplementary Data 1 for details), N: sample size, Type: exercise type, RE: resistance exercise, EE: endurance exercise, Age: mean age in cohort, %M: percent of males in cohort, Time: the time window in hours. Note that a cohort can have multiple rows with the same time window and different fold-changes (e.g., if a study measured both 2 h and 4 h then both time points will be assigned 2–5 h). Source data are provided as a Source Data file.
Fig. 3
Fig. 3. Properties of the meta-analysis results.
a Forest plot of the effect sizes of PPARGC1A in acute muscle cohorts. Upregulation appears primarily in the 2–5 h time window and is consistent for both endurance and resistance training. b Forest plot of the effect sizes of COL4A1 in the long-term muscle cohorts. Upregulation appears consistently across the cohorts. ab Rows represent the 95% confidence interval of a fold-change of a cohort in a given time point. Thus, in each interval the center represents the fold-change estimate and the error bars are proportional to the fold-change standard error. Cohort: the ID given to the cohort in this study (see Supplementary Data 1 for details), N: sample size, Type: exercise type, RE: resistance exercise, EE: endurance exercise, Age: mean age in cohort, %M: percent of males in cohort, Time: the time window in hours. Note that a cohort can have multiple rows with the same time window and different fold-changes (e.g., if a study measured both 2 h and 4 h then both time points will be assigned 2–5 h). c The differential expression effects of our selected genes is unique to exercise. Colors represent the different meta-analysis types in the study. For each meta-analysis the effect sizes of our selected genes are presented, once for the exercise cohorts and once for the untrained cohorts. All paired two-sided Wilcoxon rank sum tests were significant at p < 1 × 10−07 (acute exercise, muscle: 537 genes, p = 1.5 × 10−88; long-term training, muscle: 441 genes, 3.1 × 10−68; acute exercise, blood: 37 genes, p = 6.2 × 10−08). Each boxplot shows the median, and first and third quartiles. The whiskers extend from the hinge to the largest and lowest values, but no further than 1.5 *(the inter-quantile range). d Heatmap of the upregulated genes selected in the acute blood meta-analysis. Columns represent cohorts, with sampling time point post exercise listed for each, and rows are genes. Boxed cells indicate missing values for that particular gene and cohort. All acute blood studies measured the response to endurance exercise in up to 3 h after the bout ended. Source data are provided as a Source Data file.
Fig. 4
Fig. 4. Differential expression patterns in skeletal muscle after acute exercise.
a Genes associated with time were partitioned into four groups based on their trajectories. The title of each subplot shows significantly enriched Gene Ontology terms or pathways. b The main GeneMANIA connected component of the genes in a when overlaid on known protein–protein or pathway networks. c Dynamic regulatory events miner (DREM) analysis results of the genes in A predict several transcription factors to be involved in the observed responses. d Validation of gene expression changes following acute endurance exercise in a separate human cohort (n = 16). SMAD3, NR4A1, HES1 and ID1 from the acute network and SCN2B and SLC25A25 from the endurance and time-specific genes. Expression levels are calculated relative to the average of two housekeeping genes (GAPDH and RPS18). # denotes an overall significant treatment effect between time points (p < 0.05). *(p < 0.05) and **(p < 0.005) denote significant expression difference compared to before exercise (pre) after correction for multiple comparisons. Values are presented as mean±standard error of the mean. Source data are provided as a Source Data file.
Fig. 5
Fig. 5. Long-term training muscle response genes with moderator-independent patterns.
a Heatmap of the ten downregulated and 104 upregulated genes b The main connected component linking most of the upregulated genes to known protein–protein interaction networks. Highlighted nodes are genes with known pathway interactions in Reactome. The laminin interactions Reactome pathway covers only a small part of the upregulated gene module. Dashed lines represent co-occurrence in a complex. Directed edges represent regulation. Source data are provided as a Source Data file.
Fig. 6
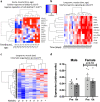
Fig. 6. Covariate-specific transcriptional changes in response to exercise and training in human skeletal muscle.
a Heatmap of the 14 genes that were differentially regulated based on time and age after acute exercise. b Heatmap of the 11 genes that were differentially regulated based on time and age after long-term training. c Heatmap of the 247 genes that were associated with sex distribution within a cohort in response to long-term training. Each cell is the average t-statistic of a gene across a set of studies. d Skeletal muscle expression of MTMR3 in males (n = 8) and females (n = 8) before and 6 h after an acute endurance exercise bout, analyzed with qRT-PCR in a separate validation cohort. Expression levels are calculated relative to the average of two housekeeping genes (GAPDH and RPS18). Data is presented as mean±standard error of the mean. Source data are provided as a Source Data file.
Fig. 7
Fig. 7. Overview of selected gene expression changes.
Summary of changes associated with key known adaptation mechanisms in skeletal muscle. Arrows indicate direction of change based on the base model from the meta-analysis. Source data are provided as a Source Data file.

References

    1. Neufer PD, et al. Understanding the cellular and molecular mechanisms of physical activity-induced health benefits. Cell Metab. 2015;22:4–11. doi: 10.1016/j.cmet.2015.05.011. - DOI - PubMed
    1. Piercy KL, et al. The physical activity guidelines for Americans. JAMA. 2018;320:2020–2028. doi: 10.1001/jama.2018.14854. - DOI - PMC - PubMed
    1. Choi KW, et al. Assessment of bidirectional relationships between physical activity and depression among adults: a 2-sample Mendelian randomization study. JAMA Psychiatry. 2019;76:399–408. doi: 10.1001/jamapsychiatry.2018.4175. - DOI - PMC - PubMed
    1. Sun H, et al. The causal relationships of device-measured physical activity with bipolar disorder and schizophrenia in adults: a 2-Sample mendelian randomization study. J. Affect. Disord. 2020;263:598–604. doi: 10.1016/j.jad.2019.11.034. - DOI - PubMed
    1. Papadimitriou N, et al. Physical activity and risks of breast and colorectal cancer: a Mendelian randomisation analysis. Nat. Commun. 2020;11:597. doi: 10.1038/s41467-020-14389-8. - DOI - PMC - PubMed

Publication types