. 2021 Jun 9;12(1):3505.
doi: 10.1038/s41467-021-23556-4.

Determinants of penetrance and variable expressivity in monogenic metabolic conditions across 77,184 exomes

Julia K Goodrich  1 Moriel Singer-Berk  1 Rachel Son  1 Abigail Sveden  1 Jordan Wood  1 Eleina England  1 Joanne B Cole  1 Ben Weisburd  1 Nick Watts  1 Lizz Caulkins  1 Peter Dornbos  1 Ryan Koesterer  1 Zachary Zappala  1 Haichen Zhang  2 Kristin A Maloney  2 Andy Dahl  3 Carlos A Aguilar-Salinas  4 Gil Atzmon  5   6   7 Francisco Barajas-Olmos  8 Nir Barzilai  5   7 John Blangero  9 Eric Boerwinkle  10   11 Lori L Bonnycastle  12 Erwin Bottinger  13 Donald W Bowden  14   15   16 Federico Centeno-Cruz  8 John C Chambers  17   18 Nathalie Chami  13   19 Edmund Chan  20 Juliana Chan  21   22   23   24 Ching-Yu Cheng  25   26   27 Yoon Shin Cho  28 Cecilia Contreras-Cubas  8 Emilio Córdova  8 Adolfo Correa  29 Ralph A DeFronzo  30 Ravindranath Duggirala  9 Josée Dupuis  31 Ma Eugenia Garay-Sevilla  32 Humberto García-Ortiz  8 Christian Gieger  33   34   35 Benjamin Glaser  36 Clicerio González-Villalpando  37 Ma Elena Gonzalez  38 Niels Grarup  39 Leif Groop  40   41 Myron Gross  42 Christopher Haiman  43 Sohee Han  44 Craig L Hanis  10 Torben Hansen  39 Nancy L Heard-Costa  45   46 Brian E Henderson  43 Juan Manuel Malacara Hernandez  32 Mi Yeong Hwang  44 Sergio Islas-Andrade  8 Marit E Jørgensen  47   48   49 Hyun Min Kang  50 Bong-Jo Kim  44 Young Jin Kim  44 Heikki A Koistinen  51   52   53 Jaspal Singh Kooner  54   55   56   57 Johanna Kuusisto  58 Soo-Heon Kwak  59 Markku Laakso  58 Leslie Lange  60 Jong-Young Lee  61 Juyoung Lee  44 Donna M Lehman  30 Allan Linneberg  62   63   64 Jianjun Liu  20   65   66 Ruth J F Loos  13   19 Valeriya Lyssenko  38   67 Ronald C W Ma  21   22   23   24 Angélica Martínez-Hernández  8 James B Meigs  1   68   69 Thomas Meitinger  70   71 Elvia Mendoza-Caamal  8 Karen L Mohlke  72 Andrew D Morris  73   74 Alanna C Morrison  10 Maggie C Y Ng  14   15   16 Peter M Nilsson  75 Christopher J O'Donnell  76   77   78   79 Lorena Orozco  8 Colin N A Palmer  80 Kyong Soo Park  59   81   82 Wendy S Post  83 Oluf Pedersen  39 Michael Preuss  13 Bruce M Psaty  84   85 Alexander P Reiner  86 Cristina Revilla-Monsalve  8 Stephen S Rich  87 Jerome I Rotter  88 Danish Saleheen  89   90   91 Claudia Schurmann  13   92   93 Xueling Sim  65 Rob Sladek  94   95   96 Kerrin S Small  97 Wing Yee So  21   22   23 Timothy D Spector  97 Konstantin Strauch  98   99 Tim M Strom  70   100 E Shyong Tai  20   27   65 Claudia H T Tam  21   22   23 Yik Ying Teo  65   101   102 Farook Thameem  103 Brian Tomlinson  104 Russell P Tracy  105   106 Tiinamaija Tuomi  40   41   107   108   109 Jaakko Tuomilehto  110   111   112   113 Teresa Tusié-Luna  114   115 Rob M van Dam  20   65   116 Ramachandran S Vasan  45   117 James G Wilson  118 Daniel R Witte  119   120 Tien-Yin Wong  25   26   27 AMP-T2D-GENES ConsortiaNoël P Burtt  1 Noah Zaitlen  3 Mark I McCarthy  121   73   122 Michael Boehnke  50 Toni I Pollin  2 Jason Flannick  1   123   76 Josep M Mercader  1   124   68 Anne O'Donnell-Luria  1   123   76 Samantha Baxter  1 Jose C Florez  1   124   68 Daniel G MacArthur  1   125   126 Miriam S Udler  127   128   129
Affiliations

Determinants of penetrance and variable expressivity in monogenic metabolic conditions across 77,184 exomes

Julia K Goodrich et al. Nat Commun. .

Abstract

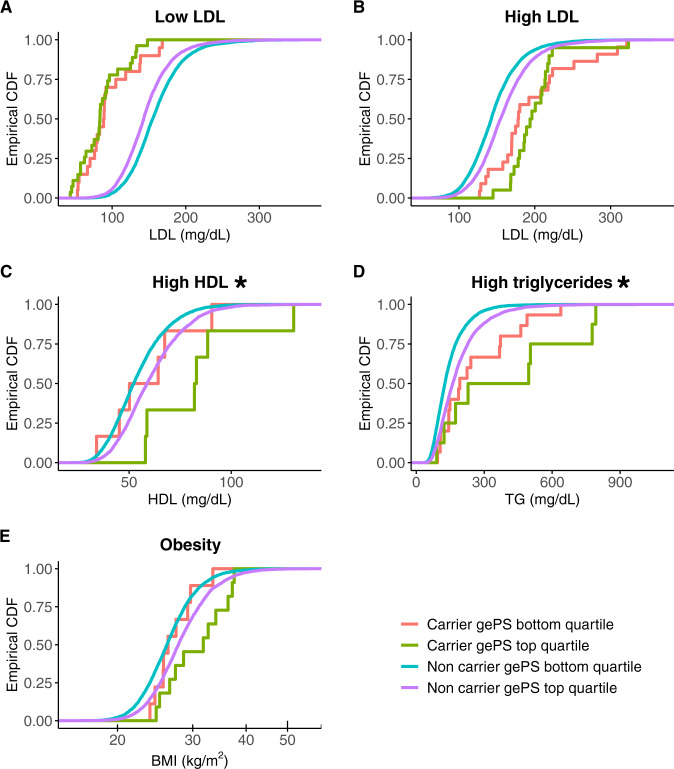
Hundreds of thousands of genetic variants have been reported to cause severe monogenic diseases, but the probability that a variant carrier develops the disease (termed penetrance) is unknown for virtually all of them. Additionally, the clinical utility of common polygenetic variation remains uncertain. Using exome sequencing from 77,184 adult individuals (38,618 multi-ancestral individuals from a type 2 diabetes case-control study and 38,566 participants from the UK Biobank, for whom genotype array data were also available), we apply clinical standard-of-care gene variant curation for eight monogenic metabolic conditions. Rare variants causing monogenic diabetes and dyslipidemias display effect sizes significantly larger than the top 1% of the corresponding polygenic scores. Nevertheless, penetrance estimates for monogenic variant carriers average 60% or lower for most conditions. We assess epidemiologic and genetic factors contributing to risk prediction in monogenic variant carriers, demonstrating that inclusion of polygenic variation significantly improves biomarker estimation for two monogenic dyslipidemias.


Conflict of interest statement

M.I.M. has served on advisory panels for Pfizer, Novo Nordisk, and Zoe Global; has received honoraria from Merck, Pfizer, Novo Nordisk, and Eli Lilly; has stock options in Zoe Global; and has received research funding from Abbvie, Astra Zeneca, Boehringer Ingelheim, Eli Lilly, Janssen, Merck, Novo Nordisk, Pfizer, Roche, Sanofi Aventis, and Servier & Takeda. M.I.M. is an employee of Genentech and holds stock in Roche. Psaty serves on the Steering Committee of the Yale Open Data Access Project funded by Johnson & Johnson. C.J.O’D. is an employee of the Novartis Institute for Biomedical Research. All other authors reported no relevant competing interests.

Figures

Fig. 1
Fig. 1. Curation of ClinVar and pLoF variants across the monogenic conditions.
Total number of curated ClinVar/Review (blue) and pLoF (red) variants with carriers in AMP-T2D-GENES (left panel) and UKB (right panel). Darker color shades indicate variants determined to be clinically significant (pathogenic, likely pathogenic, or pLoF) and lighter shades indicate variants excluded during curation from further analysis.
Fig. 2
Fig. 2. Carriers of rare clinically significant monogenic variants for lipid conditions and monogenic diabetes have more extreme effect size estimates than individuals with the top 1% of global extended polygenic scores (gePS).
In all plots data is from the UK Biobank participants. The left panels show the distribution of the phenotype in each percentile of the gePS for the relevant condition (black, N mean 364  individuals per centile), and the right panel shows the phenotype distribution in carriers of rare clinically significant monogenic variants for the corresponding condition (red); low LDL cholesterol (APOB, PCSK9; N = 90), high LDL cholesterol (LDLR, APOB; N = 83), high HDL cholesterol (CETP; N = 20), high triglycerides (APOA5, LPL; N = 54), monogenic obesity (MC4R; N = 31), and MODY (GCK, HNF1A, PDX1; N = 16). AE Mean and 95% CI of each phenotype are indicated by the point and error bars, respectively. The same gePS calculated for risk of increasing LDL levels was used for (A and B); however, the inverse of this gePS was used for (B) to illustrate that higher gePS indicates risk of lower LDL cholesterol. F The proportion of individuals with diabetes and 95% CI computed with the Clopper–Pearson method are shown as points and error bars, respectively. Individuals in the gePS analysis were restricted to those age ≥ 60 years. LDL cholesterol and triglyceride values were adjusted for lipid-lowering medication use (see “Methods”).
Fig. 3
Fig. 3. Phenotype distributions and penetrance estimates of clinically significant variant carriers.
In all plots, clinically significant variant carriers are shown in red and non-carriers are shown in grey. The left panel of each plot shows AMP-T2D-GENES participants (T2D case/control study) and the right panel shows UK Biobank participants (population-based study). See Supplementary Data 3 for individual counts. A Mean and 95% CI are represented by the black circle and black lines, respectively. Relevant lipid levels (mg/dl) or body mass index (kg/m2) are shown for carriers (C) and non-carriers (NC) of clinically significant variants for the five monogenic conditions. The blue boxes indicate the phenotype values that meet a clinical threshold for diagnosis of each of the conditions, and P values were obtained by two-tailed burden analysis in EPACTS (see “Methods”). No adjustment has been made for multiple testing. B Dots are the proportion of individuals that have the condition based on the clinical diagnosis threshold for each condition; for MODY, we show the proportion of individuals meeting T2D as well as T2D and prediabetes criteria (see “Methods”). Error bars reflect 95% CI computed with the Clopper–Pearson method.
Fig. 4
Fig. 4. Ascertainment bias significantly impacts expressivity of clinically significant variants for LDL cholesterol conditions.
LDL cholesterol levels are shown for carriers and non-carriers of LDL cholesterol raising (top panels) or lowering (bottom panels) clinically significant variants in AMP-T2D-GENES. The variants carriers are stratified by whether they were identified in individuals phenotypically ascertained for extreme serum LDL cholesterol levels (Yes, Red) or in a separate unascertained population (No, Blue) (see “Methods”). The left panels show all clinically significant variant carriers. The right panels show carriers of the single variants that were present in both ascertained and unascertained individuals. Top left, LDL-raising variant Non-carriers N = 19,131, Carriers not ascertained on LDL cholesterol level N = 55, Carriers ascertained on LDL cholesterol level N = 18. Bottom left, LDL-lowering variant Non-carriers N = 19,151, Carriers not ascertained N = 35, Carriers ascertained N = 15. Mean and 95% CI are represented by the black circle and black lines, respectively. LDL cholesterol values are adjusted for lipid-lowering medication use as per methods. See also Supplementary Table 4.
Fig. 5
Fig. 5. The combination of clinically significant monogenic variants and corresponding polygenic scores significantly improves prediction for high HDL cholesterol and high triglyceride conditions.
In all plots, an empirical cumulative distribution function (CDF) of each phenotype is shown for clinically significant variant carriers and non-carriers in the UKB for each monogenic condition stratified by bottom/top quartiles of the corresponding gePS. The monogenic conditions are (A) low LDL cholesterol (APOB, PCSK9), (B) high LDL cholesterol (LDLR, APOB), (C) high HDL cholesterol (CETP), (D) high triglycerides (APOA5, LPL), and (E) monogenic obesity (MC4R). The same gePS calculated for risk of increasing LDL cholesterol levels was used for (A and B), however, the inverse of the gePS was used for (A) to illustrate that higher gePS indicates risk of lower LDL cholesterol. The impact of higher gePS was testing in carrier-only linear regression analysis; asterisks indicate two-sided P < 0.05 unadjusted for multiple testing (High HDL P = 0.012, High Triglycerides P = 0.014). See also Supplementary Table 5.

References

    1. Directors ABO. ACMG policy statement: updated recommendations regarding analysis and reporting of secondary findings in clinical genome-scale sequencing. Genet. Med. 2015;17:68–69. doi: 10.1038/gim.2014.151. - DOI - PubMed
    1. Green RC, et al. ACMG recommendations for reporting of incidental findings in clinical exome and genome sequencing. Genet. Med. 2013;15:565–574. doi: 10.1038/gim.2013.73. - DOI - PMC - PubMed
    1. Kalia SS, et al. Recommendations for reporting of secondary findings in clinical exome and genome sequencing, 2016 update (ACMG SF v2.0): a policy statement of the American College of Medical Genetics and Genomics. Genet. Med. 2017;19:249–255. doi: 10.1038/gim.2016.190. - DOI - PubMed
    1. Directors ABO. The use of ACMG secondary findings recommendations for general population screening: a policy statement of the American College of Medical Genetics and Genomics (ACMG) Genet. Med. 2019;21:1467–1468. doi: 10.1038/s41436-019-0502-5. - DOI - PubMed
    1. Khera AV, et al. Genome-wide polygenic scores for common diseases identify individuals with risk equivalent to monogenic mutations. Nat. Genet. 2018;50:1219–1224. doi: 10.1038/s41588-018-0183-z. - DOI - PMC - PubMed

Publication types