. 2021 Jun 9;11(1):10867.
doi: 10.1038/s41598-021-90084-y.

Menopause impacts human brain structure, connectivity, energy metabolism, and amyloid-beta deposition

Affiliations

Menopause impacts human brain structure, connectivity, energy metabolism, and amyloid-beta deposition

Lisa Mosconi et al. Sci Rep. .

Abstract

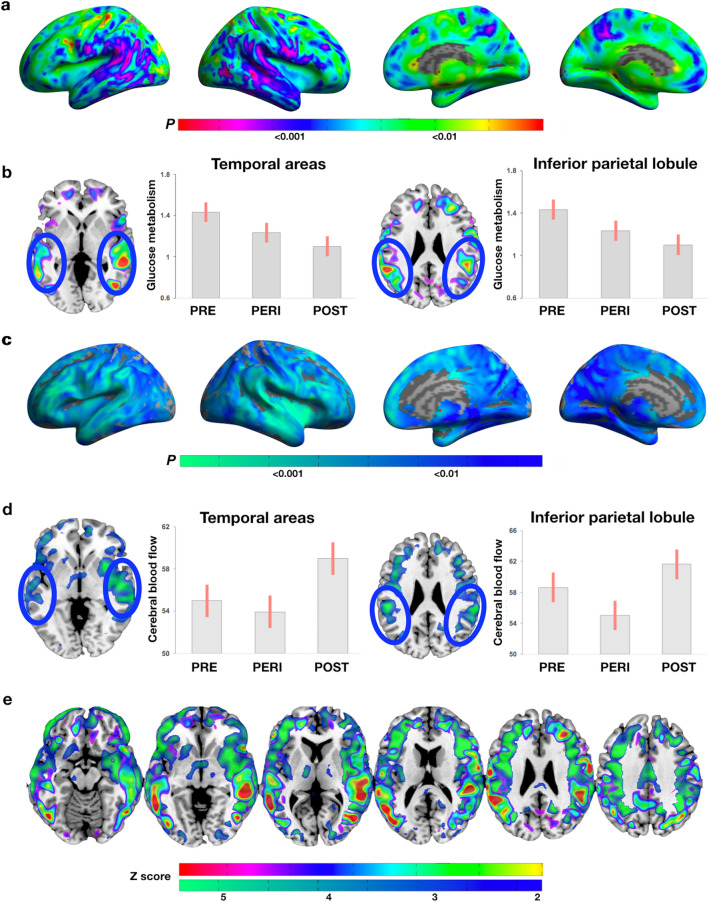
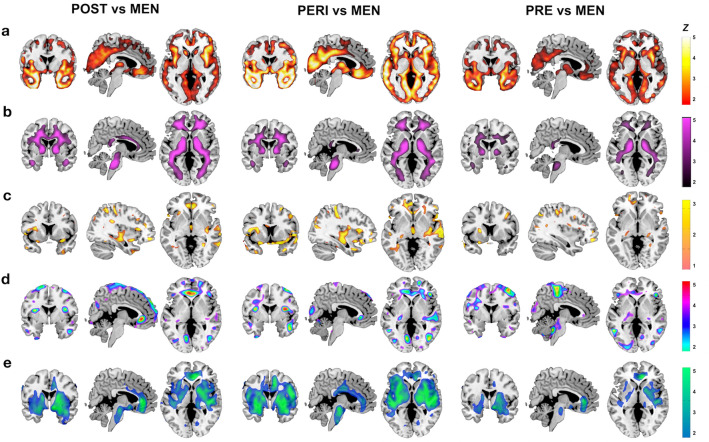
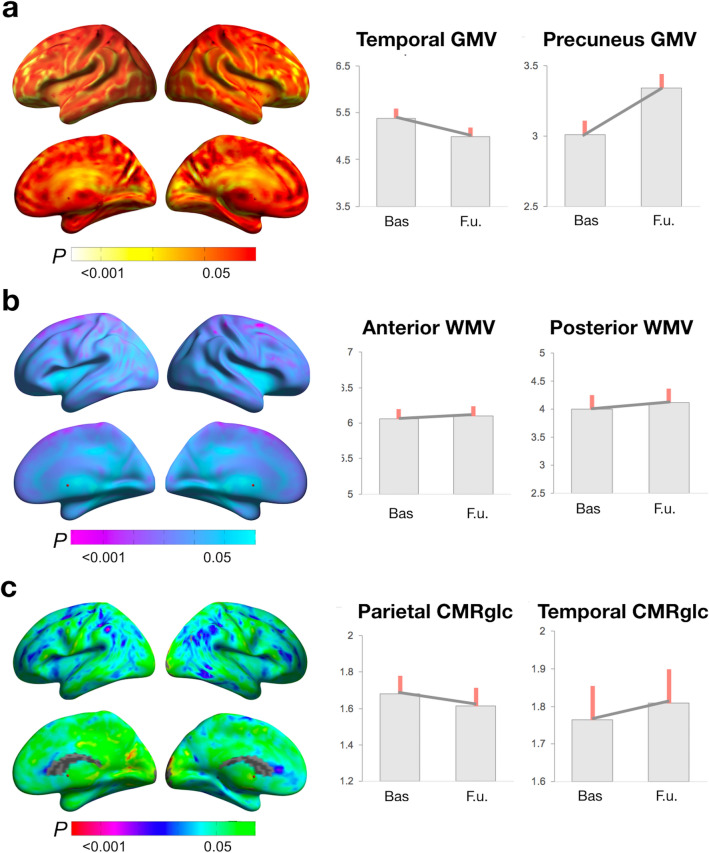
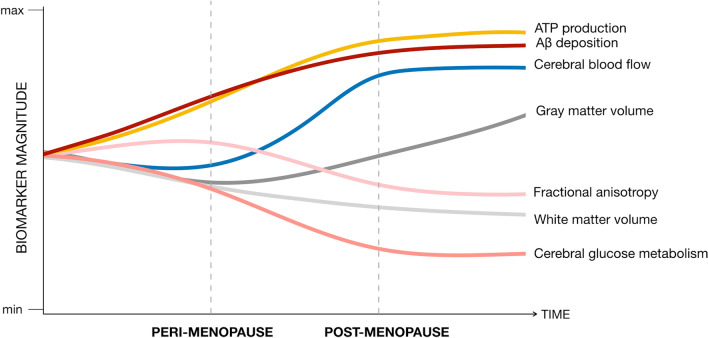
All women undergo the menopause transition (MT), a neuro-endocrinological process that impacts aging trajectories of multiple organ systems including brain. The MT occurs over time and is characterized by clinically defined stages with specific neurological symptoms. Yet, little is known of how this process impacts the human brain. This multi-modality neuroimaging study indicates substantial differences in brain structure, connectivity, and energy metabolism across MT stages (pre-menopause, peri-menopause, and post-menopause). These effects involved brain regions subserving higher-order cognitive processes and were specific to menopausal endocrine aging rather than chronological aging, as determined by comparison to age-matched males. Brain biomarkers largely stabilized post-menopause, and gray matter volume (GMV) recovered in key brain regions for cognitive aging. Notably, GMV recovery and in vivo brain mitochondria ATP production correlated with preservation of cognitive performance post-menopause, suggesting adaptive compensatory processes. In parallel to the adaptive process, amyloid-β deposition was more pronounced in peri-menopausal and post-menopausal women carrying apolipoprotein E-4 (APOE-4) genotype, the major genetic risk factor for late-onset Alzheimer's disease, relative to genotype-matched males. These data show that human menopause is a dynamic neurological transition that significantly impacts brain structure, connectivity, and metabolic profile during midlife endocrine aging of the female brain.


Conflict of interest statement

The authors declare no competing interests.

Figures

Figure 1
Figure 1
Structural biomarker differences between menopausal groups. (a) Surface maps of regional GMV differences. (b) MRI slice overlays and plots representing GMV in temporal and precuneus clusters. (c) Surface maps of regional WMV differences. (d) MRI slice overlays and plots representing WMV in anterior and posterior areas averaged between hemispheres. (e) Surface maps of regional FA differences. (f) MRI slice overlays and plots representing FA in external capsule. (g) Slice overlays depicting lack of overlap between WMV (purple) and FA (yellow) effects. In (a, c, e), SPMs are represented on modality-specific color-coded scales with corresponding P values. In (g), Z scores are reported in lieu of p values to enable multi-modality comparison. In (b, d), values are mean (SE). Results are adjusted by age and total intracranial volume. Abbreviations FA, fractional anisotropy; GMV, gray matter volume; PERI, peri-menopause; POST, post-menopause; PRE, pre-menopause; SPMs, statistical parametric maps; WMV, white matter volume.
Figure 2
Figure 2
Metabolic biomarker differences between menopausal groups. (a) Surface maps of regional CMRglc differences. (b) MRI slice overlays and plots representing CMRglc in temporal and parietal regions. (c) Surface maps of regional CBF differences. (d) MRI slice overlays and plots representing CBF extracted in temporal and parietal clusters. (e) Slice overlays depicting the overlap between CMRglc (green to red scale) and CBF (blue to green scale) effects. (f) In (a, c), SPMs are represented on modality-specific color-coded scales with corresponding p values. In (e), Z scores are reported to enable multi-modality comparisons. In (b, d), values are mean (SE). Results are adjusted by age and global activity. Abbreviations CBF, cerebral blood flow; CMRglc, cerebral glucose metabolism; PERI, peri-menopause; POST, post-menopause; PRE, pre-menopause; SPMs, statistical parametric maps.
Figure 3
Figure 3
MRI slice overlays displaying biomarker differences between each MT group and males in the corresponding age ranges: (a) Lower GMV in (left) POST, (middle) PERI, and (right) PRE groups versus males. (b) Lower WMV in (left) POST, (middle) PERI, and (right) PRE groups versus males. (c) Higher FA in (left) POST, and (middle) PERI versus males; (right) no differences between PRE and males. (d) Lower CMRglc in (left) POST, (middle) PERI, and (right) PRE groups versus males. (e) Higher CBF in (left) POST, (middle) PERI, and (right) PRE groups versus males. (f) SPMs are represented on modality-specific color-coded scales with corresponding Z scores to enable multi-modality comparisons. Abbreviations See legend to Figs. 1 and 2.
Figure 4
Figure 4
Longitudinal biomarker changes post-menopause. (a) Surface maps of GMV change. (b) Surface maps of WMV change. (c) Surface maps of CMRglc change. (d) Plots representing mean (SE) biomarker levels at baseline (POST) versus 2-year follow-up (POST + 2) in the subset of POST participants with longitudinal brain scans. Surface maps are represented on modality-specific color-coded scales with corresponding p values. See legends to Figs. 1 and 2.
Figure 5
Figure 5
Summary of brain biomarker effects during the menopause transition. This figure summarizes the main results of the study by mapping estimated brain biomarker outcomes from pre-menopausal to peri-menopausal and post-menopausal stages. Biomarker measures extracted from representative clusters for each modality are displayed on a standardized scale and normalized to pre-menopausal levels to enable examination of the magnitude of biomarker effects by menopausal stage and across modalities.

References

    1. Brinton RD, Yao J, Yin F, Mack WJ, Cadenas E. Perimenopause as a neurological transition state. Nat Rev Endocrinol. 2015;11:393–405. doi: 10.1038/nrendo.2015.82. - DOI - PMC - PubMed
    1. Monteleone P, Mascagni G, Giannini A, Genazzani AR, Simoncini T. Symptoms of menopause—global prevalence, physiology and implications. Nat Rev Endocrinol. 2018;14:199–215. doi: 10.1038/nrendo.2017.180. - DOI - PubMed
    1. McEwen BS, Alves SE, Bulloch K, Weiland NG. Ovarian steroids and the brain: implications for cognition and aging. Neurology. 1997;48:8S–15S. doi: 10.1212/WNL.48.5_Suppl_7.8S. - DOI - PubMed
    1. Yue X, et al. Brain estrogen deficiency accelerates Abeta plaque formation in an Alzheimer's disease animal model. Proc Natl Acad Sci U S A. 2005;102:19198–19203. doi: 10.1073/pnas.0505203102. - DOI - PMC - PubMed
    1. Yao J, et al. Mitochondrial bioenergetic deficit precedes Alzheimer's pathology in female mouse model of Alzheimer's disease. Proc Natl Acad Sci U S A. 2009;106:14670–14675. doi: 10.1073/pnas.0903563106. - DOI - PMC - PubMed

Publication types

MeSH terms