. 2021 Jun 9;11(1):12157.
doi: 10.1038/s41598-021-91231-1.

Endothelial glycocalyx shields the interaction of SARS-CoV-2 spike protein with ACE2 receptors

Affiliations

Endothelial glycocalyx shields the interaction of SARS-CoV-2 spike protein with ACE2 receptors

Marta Targosz-Korecka et al. Sci Rep. .

Abstract

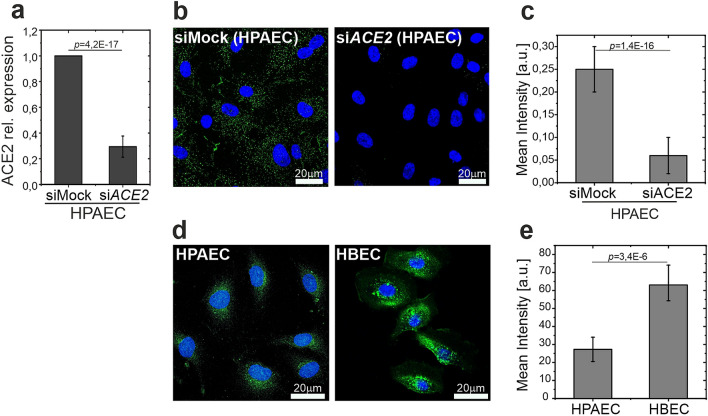
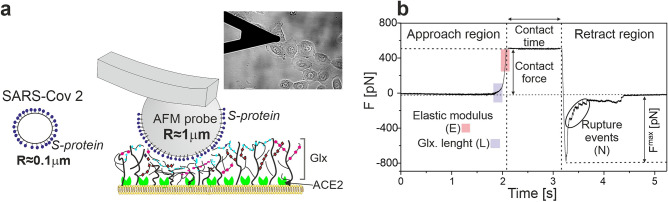
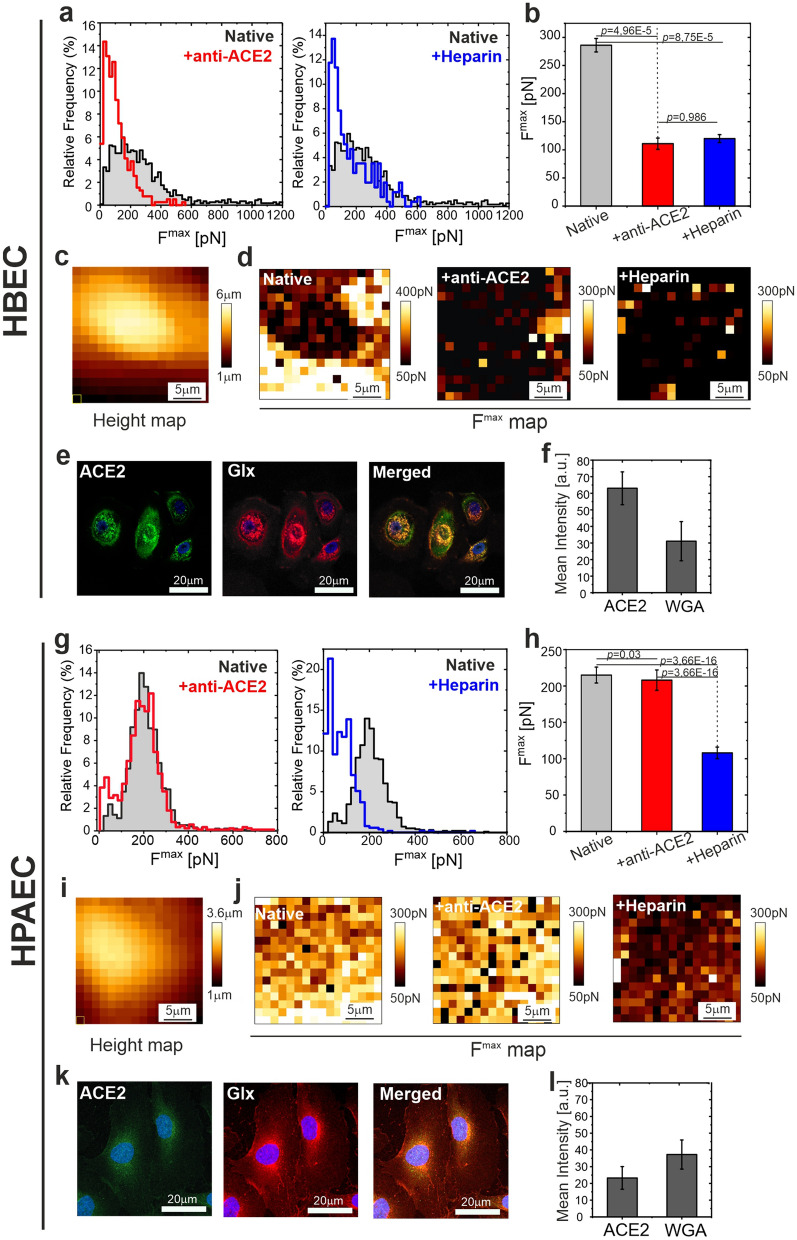
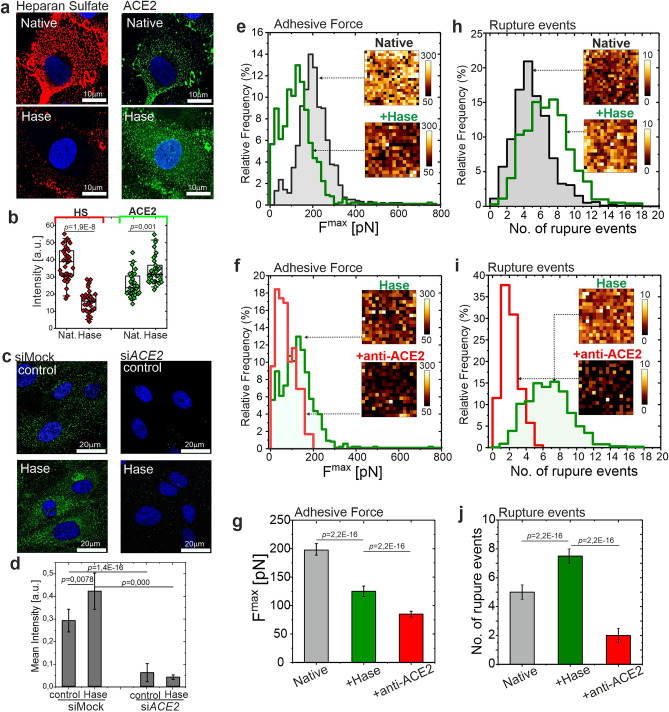
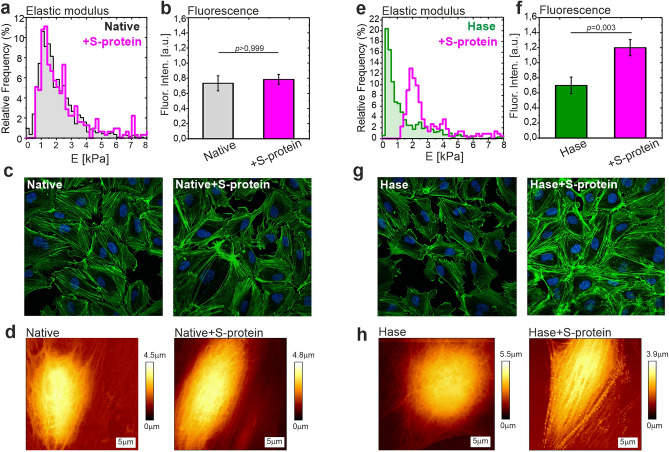
Endothelial cells (ECs) play a crucial role in the development and propagation of the severe COVID-19 stage as well as multiorgan dysfunction. It remains, however, controversial whether COVID-19-induced endothelial injury is caused directly by the infection of ECs with SARS-CoV-2 or via indirect mechanisms. One of the major concerns is raised by the contradictory data supporting or denying the presence of ACE2, the SARS-CoV-2 binding receptor, on the EC surface. Here, we show that primary human pulmonary artery ECs possess ACE2 capable of interaction with the viral Spike protein (S-protein) and demonstrate the crucial role of the endothelial glycocalyx in the regulation of the S-protein binding to ACE2 on ECs. Using force spectroscopy method, we directly measured ACE2- and glycocalyx-dependent adhesive forces between S-protein and ECs and characterized the nanomechanical parameters of the cells exposed to S-protein. We revealed that the intact glycocalyx strongly binds S-protein but screens its interaction with ACE2. Reduction of glycocalyx layer exposes ACE2 receptors and promotes their interaction with S-protein. These results indicate that the susceptibility of ECs to COVID-19 infection may depend on the glycocalyx condition.


Conflict of interest statement

The authors declare no competing interests.

Figures

Figure 1
Figure 1
Examination of the presence of ACE2 in human ECs. (a) Expression of ACE2 in siMock and siACE2-transfected HPAECs. (b,c) Immunofluorescent staining of HPAECs transfected with ACE2-targeting (siACE2) and non-targeting (siMock) siRNA, with anti-ACE2 antibody. Representative photographs and quantitative analysis of immunofluorescence intensity. (d,e) Immunofluorescent staining of ACE2 in HPAECs and HBECs. Representative photographs and quantitative analysis of immunofluorescence intensity. Statistics: p values were determined by one-way ANOVA followed by Tukey’s post-hoc test. Figure created with OriginPro2021 (https://www.originlab.com/2021) and ImageJ 1.53e (https://imagej.nih.gov/ij/).
Figure 2
Figure 2
Experimental design and characterization of studied HBEC and HPAEC cells. (a) The idea of the experimental setup. Multiple spike proteins are attached to a large spherical AFM probe that is approached to the cell surface. Inset: Optical image of the experimental setup with a spherical probe. The AFM cantilever with a probe and HBEC cells on the glass are immersed in the HBSS solution. (b) Time diagram of recording a single force-distance curve with the approach, contact and retract regions. In the approach part, regions of curves taken for analysis of glycocalyx parameters (blue) and cell elasticity (red) are schematically marked. The maximal de-adhesive force and rupture events are marked on the retracting part of the curve. Figure created with OriginPro2021 (https://www.originlab.com/2021) and Corel Draw2020 (https://www.coreldraw.com/pl/).
Figure 3
Figure 3
Differences in adhesive interactions between the S-proteins of SARS-CoV-2 and the surfaces of human bronchial epithelial cells (HBECs) and human pulmonary artery endothelial cells (HPAECs). (a) Histograms of the maximal detachment force Fmax for HBECs. Left: comparison of data for native and anti-ACE2 treated cells. Right: comparison of data for native and heparin treated system. (b) Comparison of mean values determined from histograms. (c) AFM height map measured for a single HBEC cell. (d) Corresponding adhesive maps measured for this cell. Left: native cell. Middle: anti-ACE2 treatment. Right: heparin treatment. (e) Fluorescent staining of ACE2 (green, left column), glycocalyx (Glx, red, middle column) and Merged (right column). (f) Quantitative data of ACE2 and Glx mean fluorescence intensity. (g) Histograms of the maximal detachment force Fmax for HPAECs. Left: comparison of data for native and anti-ACE2 treated cells. Right: comparison of data for native and heparin treated system. (h) Comparison of mean values determined from histograms. (i) AFM height map measured for a single HPAEC cell. (j) Corresponding adhesive maps measured for this cell. (k) Fluorescent staining of ACE2 (green, left column), Glx (red, middle column) and Merged (right column) (l) Quantitative data of ACE2 and Glx mean fluorescence intensity. Left: native cell. Middle: anti-ACE2 treatment. Right: heparin treatment. Statistics: p values were determined by one-way ANOVA followed by Tukey’s post-hoc test. Experimental details are listed in Supplementary Table 1. Source data are provided as a Source Data file. Figure created with OriginPro2021 (https://www.originlab.com/2021), ImageJ 1.53e (https://imagej.nih.gov/ij/) and JPK Data Processing 6.1.79 (https://www.jpk.com/).
Figure 4
Figure 4
Removal of heparan sulfate from glycocalyx reduces the overall adhesion of S-protein to HPAECs but exposes ACE2 receptors for binding. (a) Fluorescence staining of HS (red, left column) and ACE2 receptors (green, right column) performed for native (top row) and heparinase (Hase) treated HPAECs (bottom row). (b) Quantitative data of HS and ACE2 mean fluorescence intensity. (c,d) Fluorescent staining of ACE2 in siMock and siACE2-transfected HPAECs treated with heparinase. Representative pictures and quantitative data. (e,h) Histograms of adhesive parameters for native cells (grey) and heparinase treated cells (green). (f,i) Histograms of adhesive parameters for heparinase treated cells (green) and heparinase treated cells successively incubated with anti-ACE2. (g,j) Comparison of mean values. Left: plots for maximal detachment force. Right: plots for the number of rupture events. In all histograms and insets show selected spatially resolved maps (25 µm × 25 µm). Statistics: p values were determined by one-way ANOVA followed by Tukey’s post-hoc test. Experimental details are listed in Supplementary Table 1. Source data are provided as a Source Data file. HS heparan sulfate, Hase heparinase, anti-ACE2 ACE2 blocking antibody, Glx glycocalyx. Figure created with OriginPro2021 (https://www.originlab.com/2021), ImageJ 1.53e (https://imagej.nih.gov/ij/) and JPK Data Processing 6.1.79 (https://www.jpk.com/).
Figure 5
Figure 5
Endothelial cells stiffening after incubation with S-protein is more pronounced for cells with removed glycocalyx. (a) Elastic modulus of HPAECs for native cells (grey histogram) and for cells incubated with S-protein (magenta). (b) Mean fluorescence intensity of phalloidin (AlexaFluor488). (c) Examples of fluorescence images depict the actin structure in native HPAECs and after incubation with S-protein. Green—actin. Blue—nucleus. (d) Examples of AFM-QI images of native HPAECs and after incubation with S-protein. (e) Elastic modulus obtained for HPAECs pre-incubated with heparinase (green) and next incubated with S-protein (magenta). (f) Mean fluorescence intensity of phalloidin (AlexaFluor488) after removal of HS. (g) Fluorescence images show the actin polymerization that occurred after incubation with S-protein for HPAECs pre-incubated with heparinase. (h) Examples of AFM-QI images depict the changes of cell morphology and cortical actin network after incubation with S-protein for HPAECs pre-incubated with heparinase. Statistics: p values were determined by one-way ANOVA followed by Tukey’s post-hoc test. Figure created with OriginPro2021 (https://www.originlab.com/2021), ImageJ 1.53e (https://imagej.nih.gov/ij/) and JPK Data Processing 6.1.79 (https://www.jpk.com/).

Similar articles

Cited by

References

    1. Hoffmann M, et al. SARS-CoV-2 cell entry depends on ACE2 and TMPRSS2 and is blocked by a clinically proven protease inhibitor. Cell. 2020;181:271–280.e8. doi: 10.1016/j.cell.2020.02.052. - DOI - PMC - PubMed
    1. Li W, et al. Angiotensin-converting enzyme 2 is a functional receptor for the SARS coronavirus. Nature. 2003;426:450–454. doi: 10.1038/nature02145. - DOI - PMC - PubMed
    1. Samavati L, Uhal BD. ACE2, much more than just a receptor for SARS-COV-2. Front. Cell. Infect. Microbiol. 2020;10:1–9. doi: 10.3389/fcimb.2020.00317. - DOI - PMC - PubMed
    1. Hamming I, et al. Rapid Communication Tissue distribution of ACE2 protein, the functional receptor for SARS coronavirus. A first step in understanding SARS pathogenesis. J. Pathol. 2004;203:631–637. doi: 10.1002/path.1570. - DOI - PMC - PubMed
    1. Nishiga M, Wang DW, Han Y, Lewis DB, Wu JC. COVID-19 and cardiovascular disease: From basic mechanisms to clinical perspectives. Nat. Rev. Cardiol. 2020;17:543–558. doi: 10.1038/s41569-020-0413-9. - DOI - PMC - PubMed

Publication types

MeSH terms

Substances