. 2021 Jun 9;11(1):12222.
doi: 10.1038/s41598-021-91615-3.

Development of a time-series shotgun metagenomics database for monitoring microbial communities at the Pacific coast of Japan

Affiliations

Development of a time-series shotgun metagenomics database for monitoring microbial communities at the Pacific coast of Japan

Kazutoshi Yoshitake et al. Sci Rep. .

Abstract

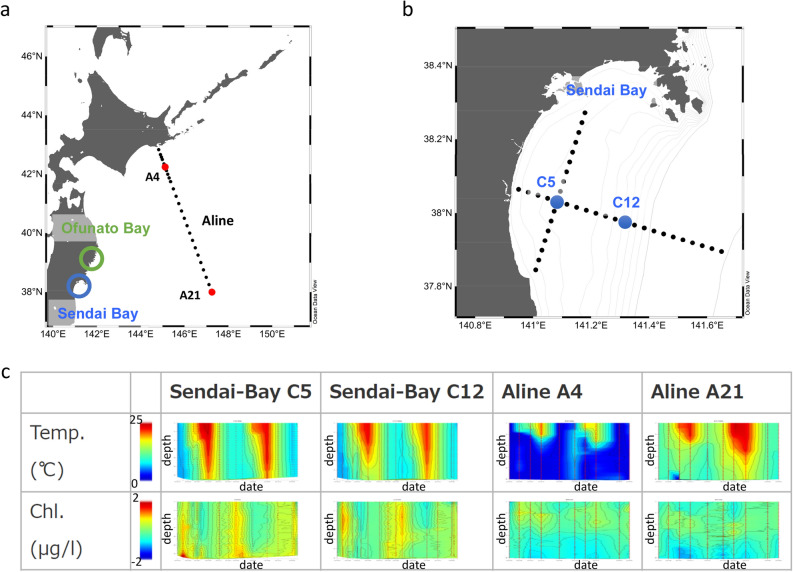
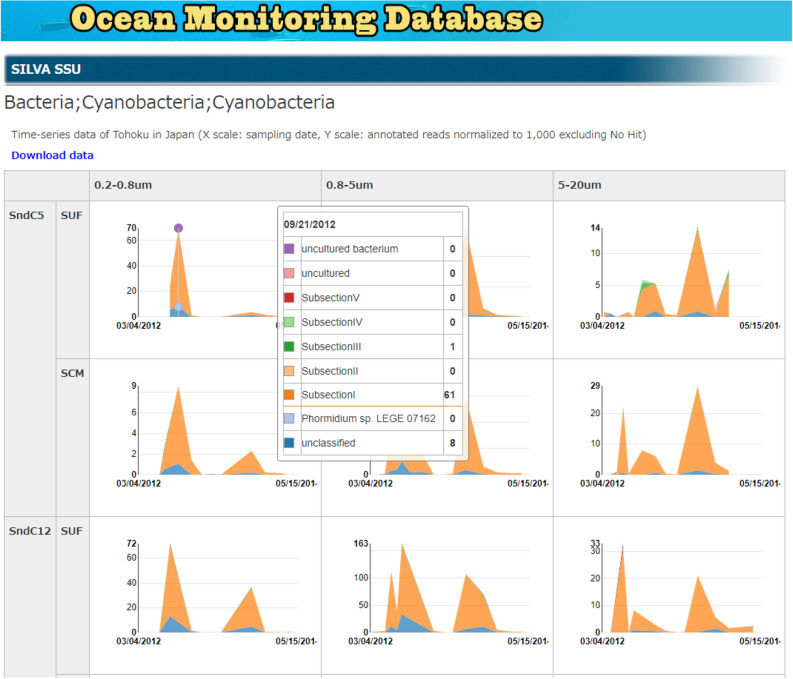
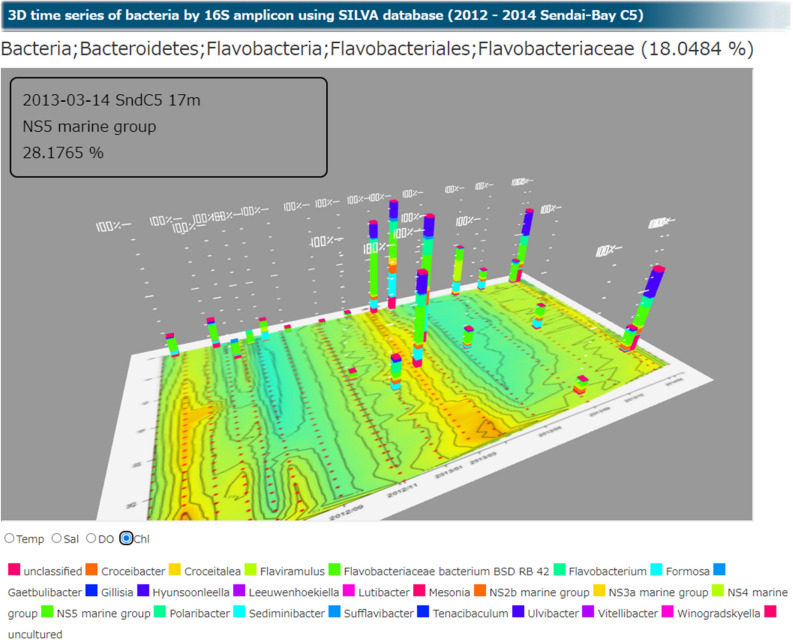
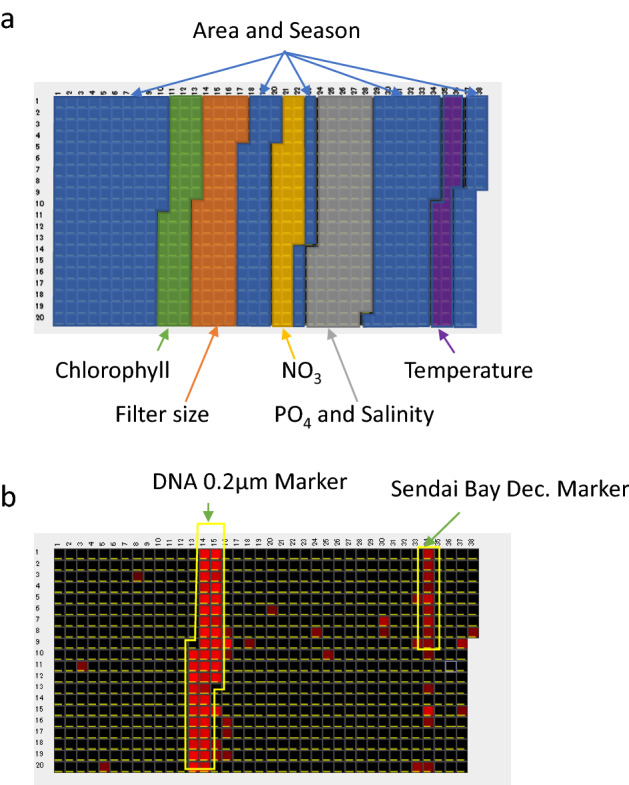
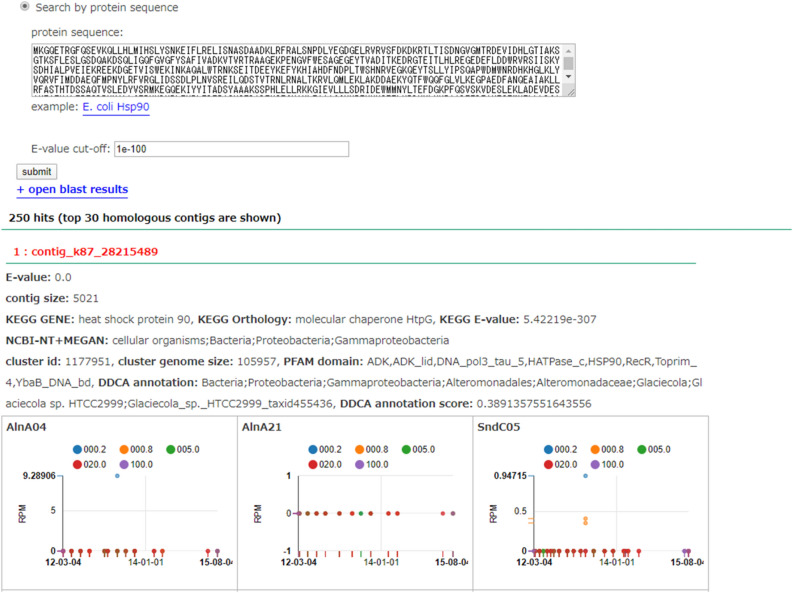
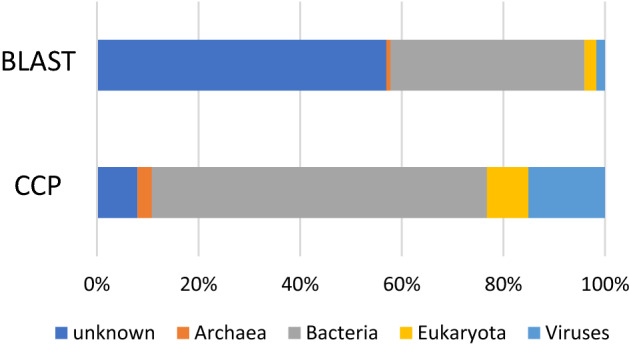
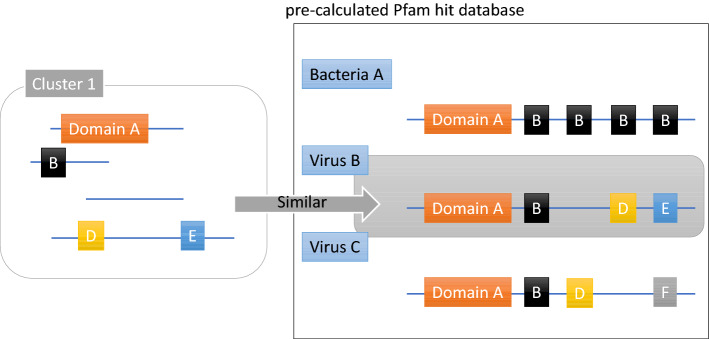
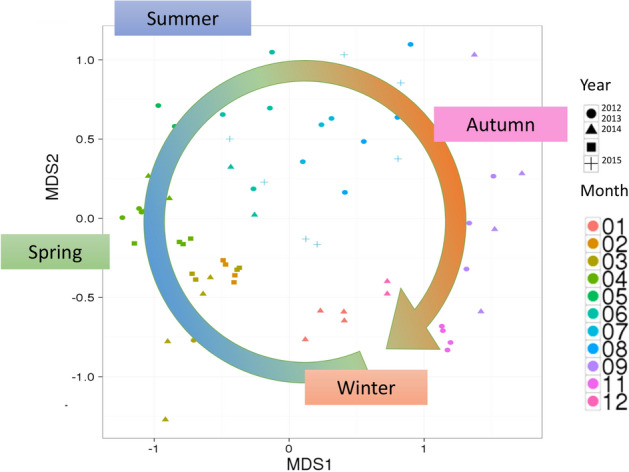
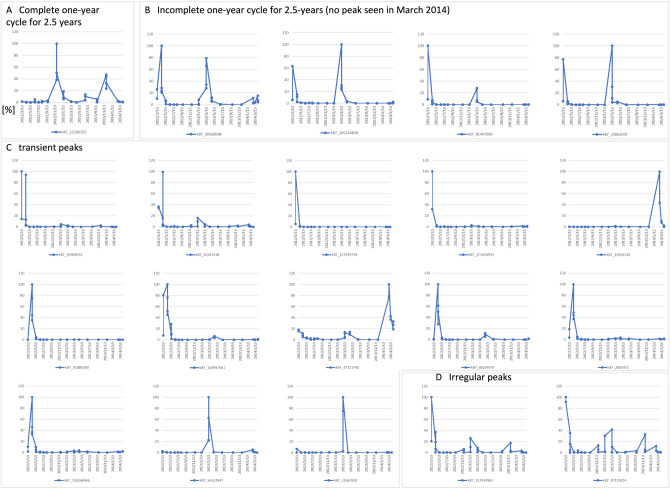
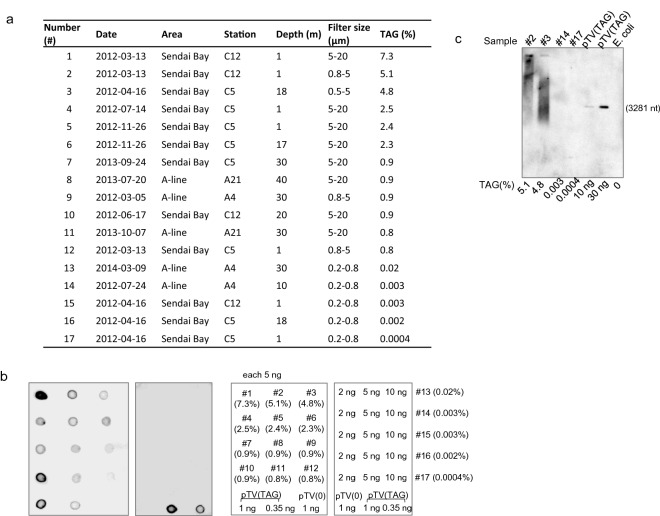
Although numerous metagenome, amplicon sequencing-based studies have been conducted to date to characterize marine microbial communities, relatively few have employed full metagenome shotgun sequencing to obtain a broader picture of the functional features of these marine microbial communities. Moreover, most of these studies only performed sporadic sampling, which is insufficient to understand an ecosystem comprehensively. In this study, we regularly conducted seawater sampling along the northeastern Pacific coast of Japan between March 2012 and May 2016. We collected 213 seawater samples and prepared size-based fractions to generate 454 subsets of samples for shotgun metagenome sequencing and analysis. We also determined the sequences of 16S rRNA (n = 111) and 18S rRNA (n = 47) gene amplicons from smaller sample subsets. We thereafter developed the Ocean Monitoring Database for time-series metagenomic data ( http://marine-meta.healthscience.sci.waseda.ac.jp/omd/ ), which provides a three-dimensional bird's-eye view of the data. This database includes results of digital DNA chip analysis, a novel method for estimating ocean characteristics such as water temperature from metagenomic data. Furthermore, we developed a novel classification method that includes more information about viruses than that acquired using BLAST. We further report the discovery of a large number of previously overlooked (TAG)n repeat sequences in the genomes of marine microbes. We predict that the availability of this time-series database will lead to major discoveries in marine microbiome research.


Conflict of interest statement

The authors declare no competing interests.

Figures

Figure 1
Figure 1
Location, changes in water temperature, and changes in chlorophyll-a (Chl-a) concentrations at the sampling points. (a) Sampling points along the Pacific coast of northeastern Japan (Sendai Bay, Ofunato Bay, and A-line). (b) Sampling points C5 and C12 in Sendai Bay. The map was generated using Ocean Data View (https://odv.awi.de) with data imported from the NOAA server (accessed on 22 February 2021). (c) Changes in water temperature and chlorophyll concentrations at Sendai Bay and A-line sampling points. Red circles indicate the depth of the sampled water. X-axis: dates from 2012 to 2014. Y-axis: water depth from the surface.
Figure 2
Figure 2
Time-series analysis of microbial communities along the Pacific coast of northeastern Japan. Each sampling point shows the number of ribosomal sequences normalized to 1000 (excluding no hits). Clicking on the graph at the website of Ocean Monitoring Database exhibits the next taxonomic levels. This figure shows an example of the change in Cyanobacteria communities over time from April 2012 to May 2014. SUF: surface layer (1 m), SCM: the subsurface chlorophyll-a maximum layer.
Figure 3
Figure 3
Three-dimensional (3D) display of microbial communities. 3D display of bacterial communities identified using 16S rRNA gene amplicon analysis of the Sendai Bay C5 samples from 2012 to 2014. The x-axis indicates the date, the y-axis indicates the water depth, and the z-axis indicates the percentage abundance of bacterial genera. The contour plot on the xy plane indicates the chlorophyll concentration. The composition of Flavobacteriaceae is shown as an example.
Figure 4
Figure 4
Visualization of metagenomics data using digital DNA chips. (a) Overview of in silico probes associated with the environmental factors on a digital DNA chip (See Supplementary Information 8 for details). (b) Digital DNA chip of shotgun metagenomics data of a 0.2–0.8-μm fraction of December 1, 2013, Sendai Bay C5. There are 748 probes, and spots that are positive for digital hybridization are shown in red. Negative spots are black. The hybridization positive probes are an indicator of environmental information of the sequence data.
Figure 5
Figure 5
Search for homologous contigs to a query sequence and display of temporal variation patterns. Using nucleotide and amino acid sequences as queries, contigs homologous to the query sequence are identified using BLAST, and the temporal variation patterns and taxonomy information of the hit contigs are displayed.
Figure 6
Figure 6
Comparison between BLAST and CCP annotation results at the super-kingdom level. Comparison of classification results using BLAST to annotate contigs and classification by clustering with Pfam (CCP); the percentage of unknowns was 57% for BLAST and 8% for CCP.
Figure 7
Figure 7
Overview of CCP. Flowchart of the search of the Pfam domain against known genomes of viruses, bacteria, archaea, and eukaryotes included in RefSeq to create a Pfam hit database. The Pfam domains were searched in metagenome-assembled genome (MAG) units and the known genomes whose type and number of Pfam domains are closest to the MAG.
Figure 8
Figure 8
Multidimensional scaling (MDS) plot as a function of the abundance of contigs. MDS plots of bacterial fractions (0.2–0.8 µm) of shotgun metagenomic data from 2012 to 2015 acquired from Sendai Bay according to the pattern of abundance of assembled contigs.
Figure 9
Figure 9
Variation patterns of contigs in the top 20 most abundant metagenome-assembled genomes (MAGs).The top 20 MAGs in the bacterial fractions of Sendai Bay C5 and C12 from March 13, 2012, to April 2, 2014, were classified as follows: (a) complete 1-year cycle for 2.5 years, (b) Incomplete 1-year cycle for 2.5 years, (c) transient peaks, and (d) irregular peaks. A peak within 1 month of ≥ 25% relative to the previous year’s peak was considered cyclical.
Figure 10
Figure 10
Detection of TAG repeats using Southern blot and dot-blot hybridization analyses. (a) Contents of the TAG repeats of the samples according to next-generation sequencing analysis. (b) Dot-blot analyses. The sample numbers and their amounts, (right side) correspond to the signals of each dot in the left panels. The intact pTV119N plasmid without an insert indicates pTV(0). The calculated contents of TAG repeats (%) are indicated in parentheses. (c) Southern blot analysis of EcoRI-digested samples subjected to 0.8% agarose gel electrophoresis. The plasmid pTV (TAG) (0.35 ng and 1 ng) served as a positive control. E. coli genomic DNA served as a negative control. The calculated contents of TAG repeats (%) are indicated on the bottom of each graph. The length (nt) of the TAG-repeated fragment excised from pTV (TAG) is shown on the right.

References

    1. Venter JC, et al. Environmental genome shotgun sequencing of the Sargasso Sea. Science. 2004;304:66–74. doi: 10.1126/science.1093857. - DOI - PubMed
    1. Mineta K, Gojobori T. Databases of the marine metagenomics. Gene. 2016;576:724–728. doi: 10.1016/j.gene.2015.10.035. - DOI - PubMed
    1. Ranjan R, Rani A, Metwally A, McGee HS, Perkins DL. Analysis of the microbiome: Advantages of whole genome shotgun versus 16S amplicon sequencing. Biochem. Biophys. Res. Commun. 2016;469:967–977. doi: 10.1016/j.bbrc.2015.12.083. - DOI - PMC - PubMed
    1. Kang DD, et al. MetaBAT 2: an adaptive binning algorithm for robust and efficient genome reconstruction from metagenome assemblies. PeerJ. 2019;7:e7359. doi: 10.7717/peerj.7359. - DOI - PMC - PubMed
    1. Nielsen HB, et al. Identification and assembly of genomes and genetic elements in complex metagenomic samples without using reference genomes. Nat. Biotechnol. 2014;32:822–828. doi: 10.1038/nbt.2939. - DOI - PubMed

Publication types

Substances