. 2021 Jun;23(6):631-641.
doi: 10.1038/s41556-021-00693-y. Epub 2021 Jun 9.

Quantitative proteomics identifies the core proteome of exosomes with syntenin-1 as the highest abundant protein and a putative universal biomarker

Affiliations

Quantitative proteomics identifies the core proteome of exosomes with syntenin-1 as the highest abundant protein and a putative universal biomarker

Fernanda G Kugeratski et al. Nat Cell Biol. 2021 Jun.

Abstract

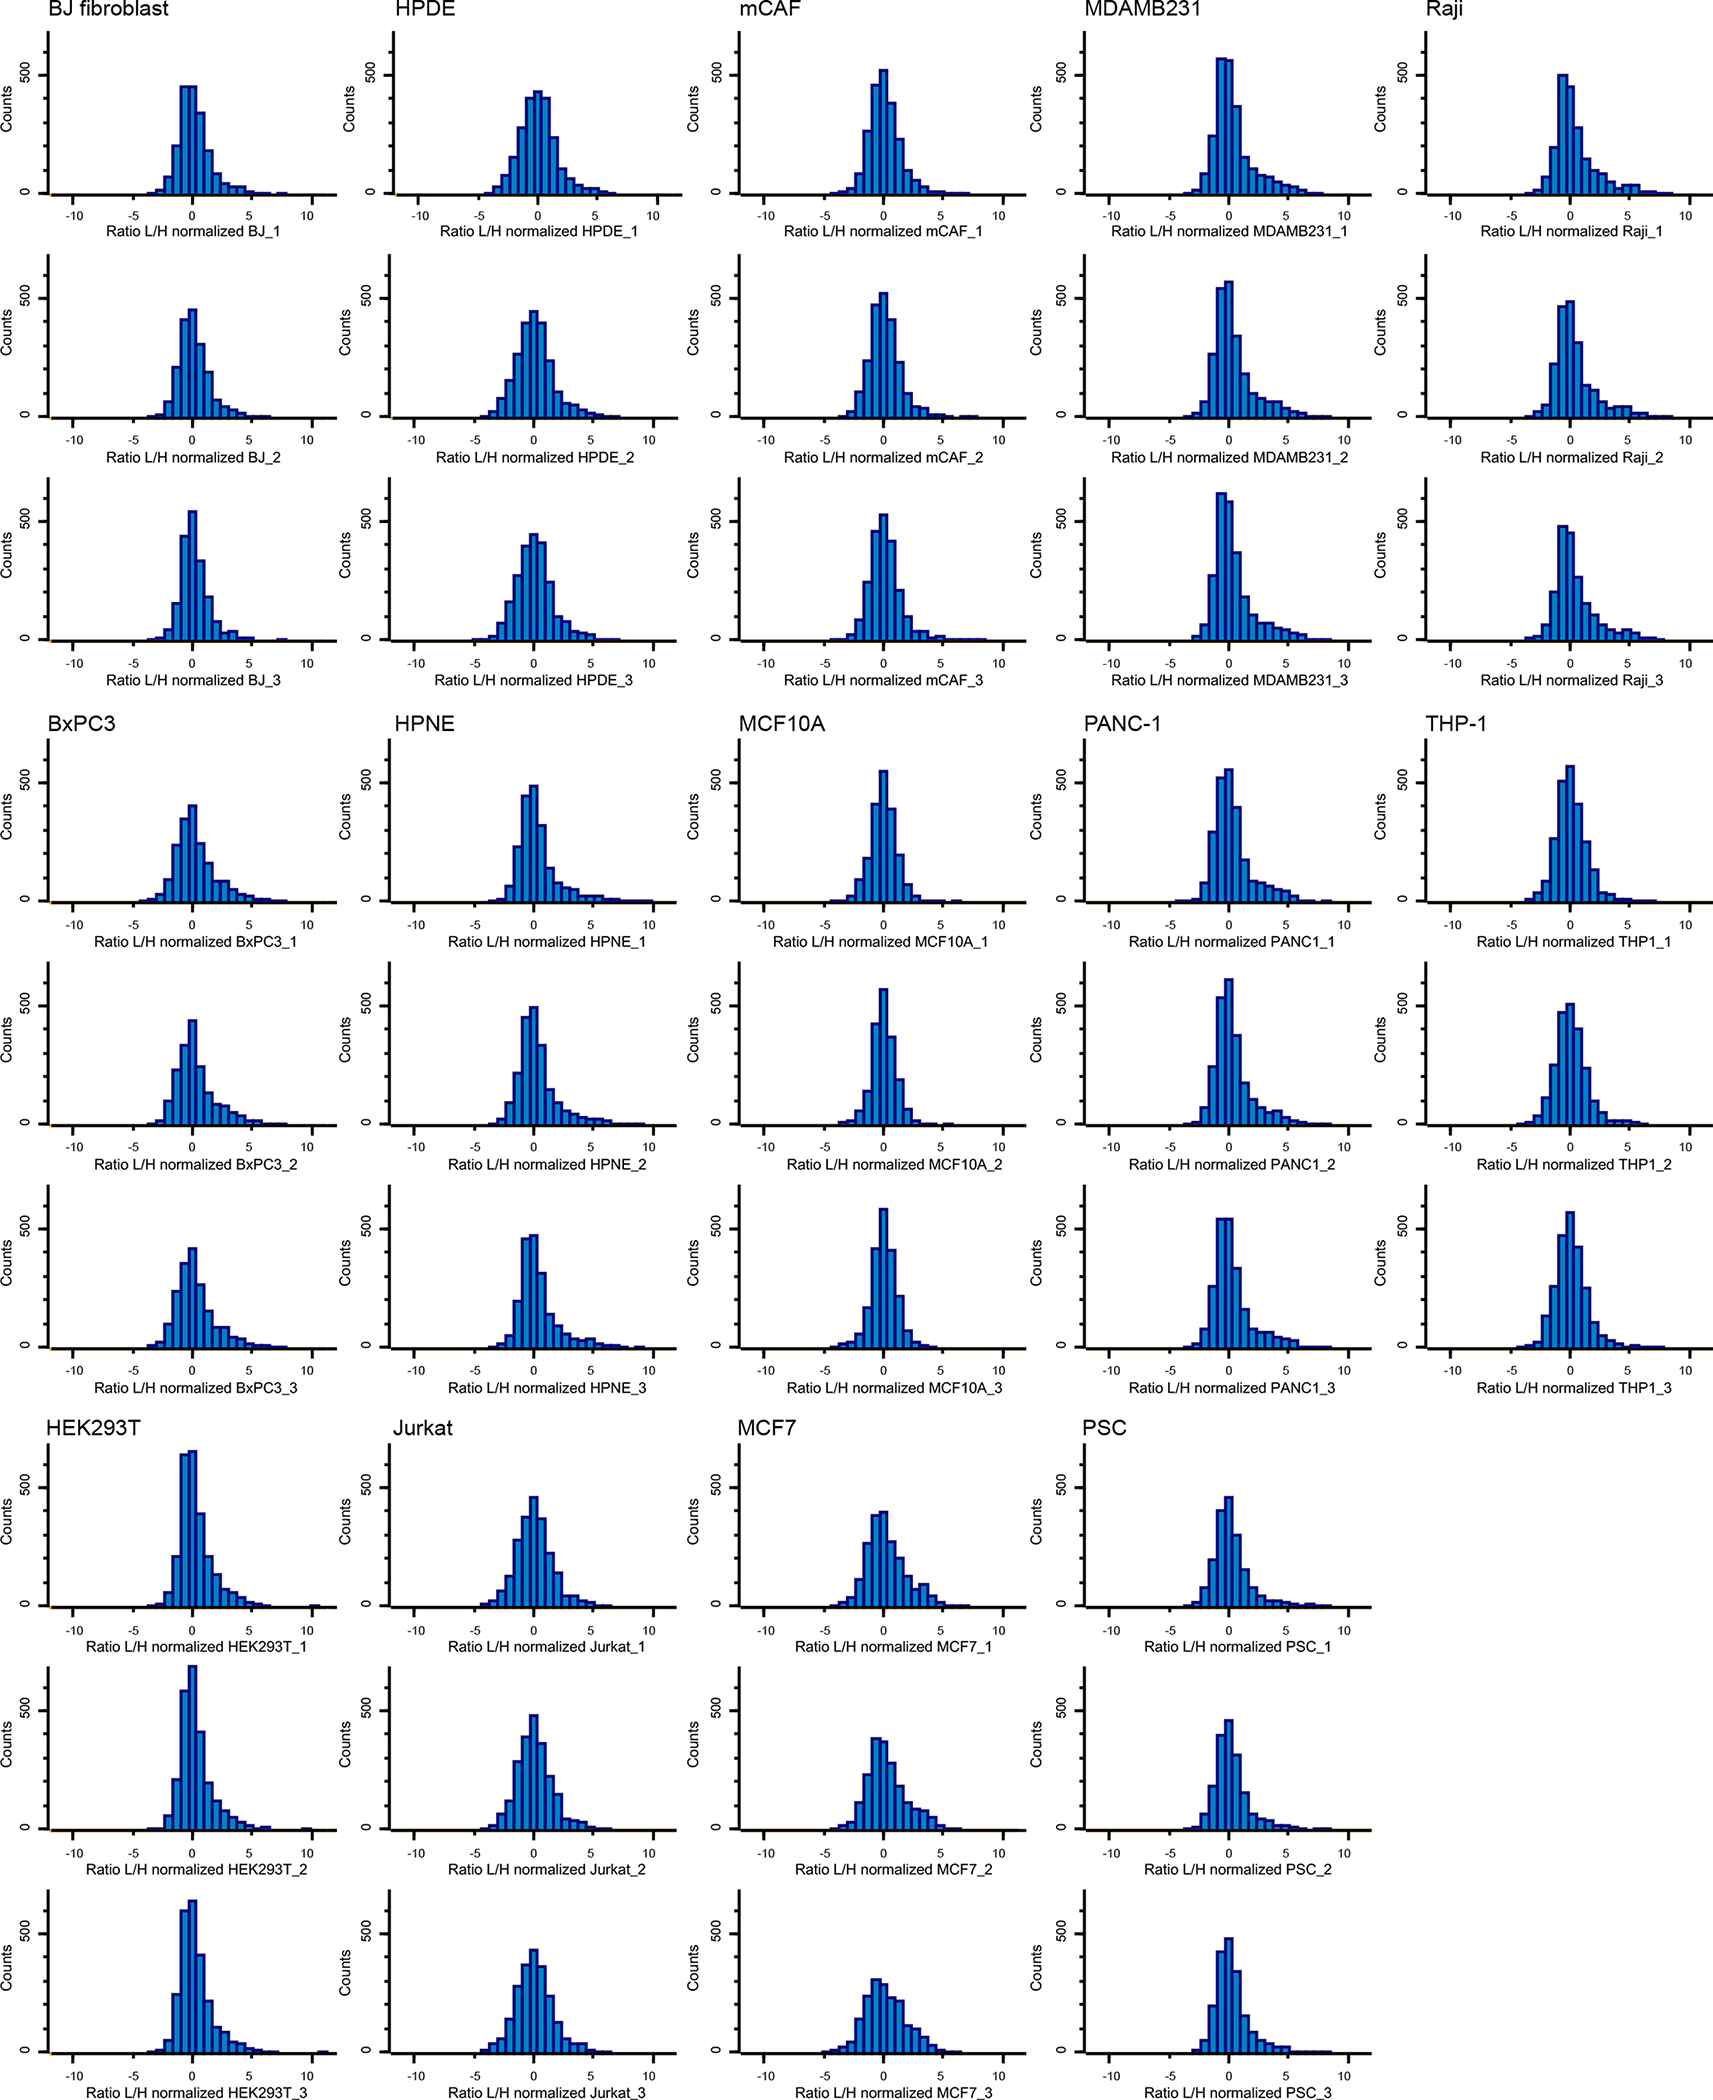
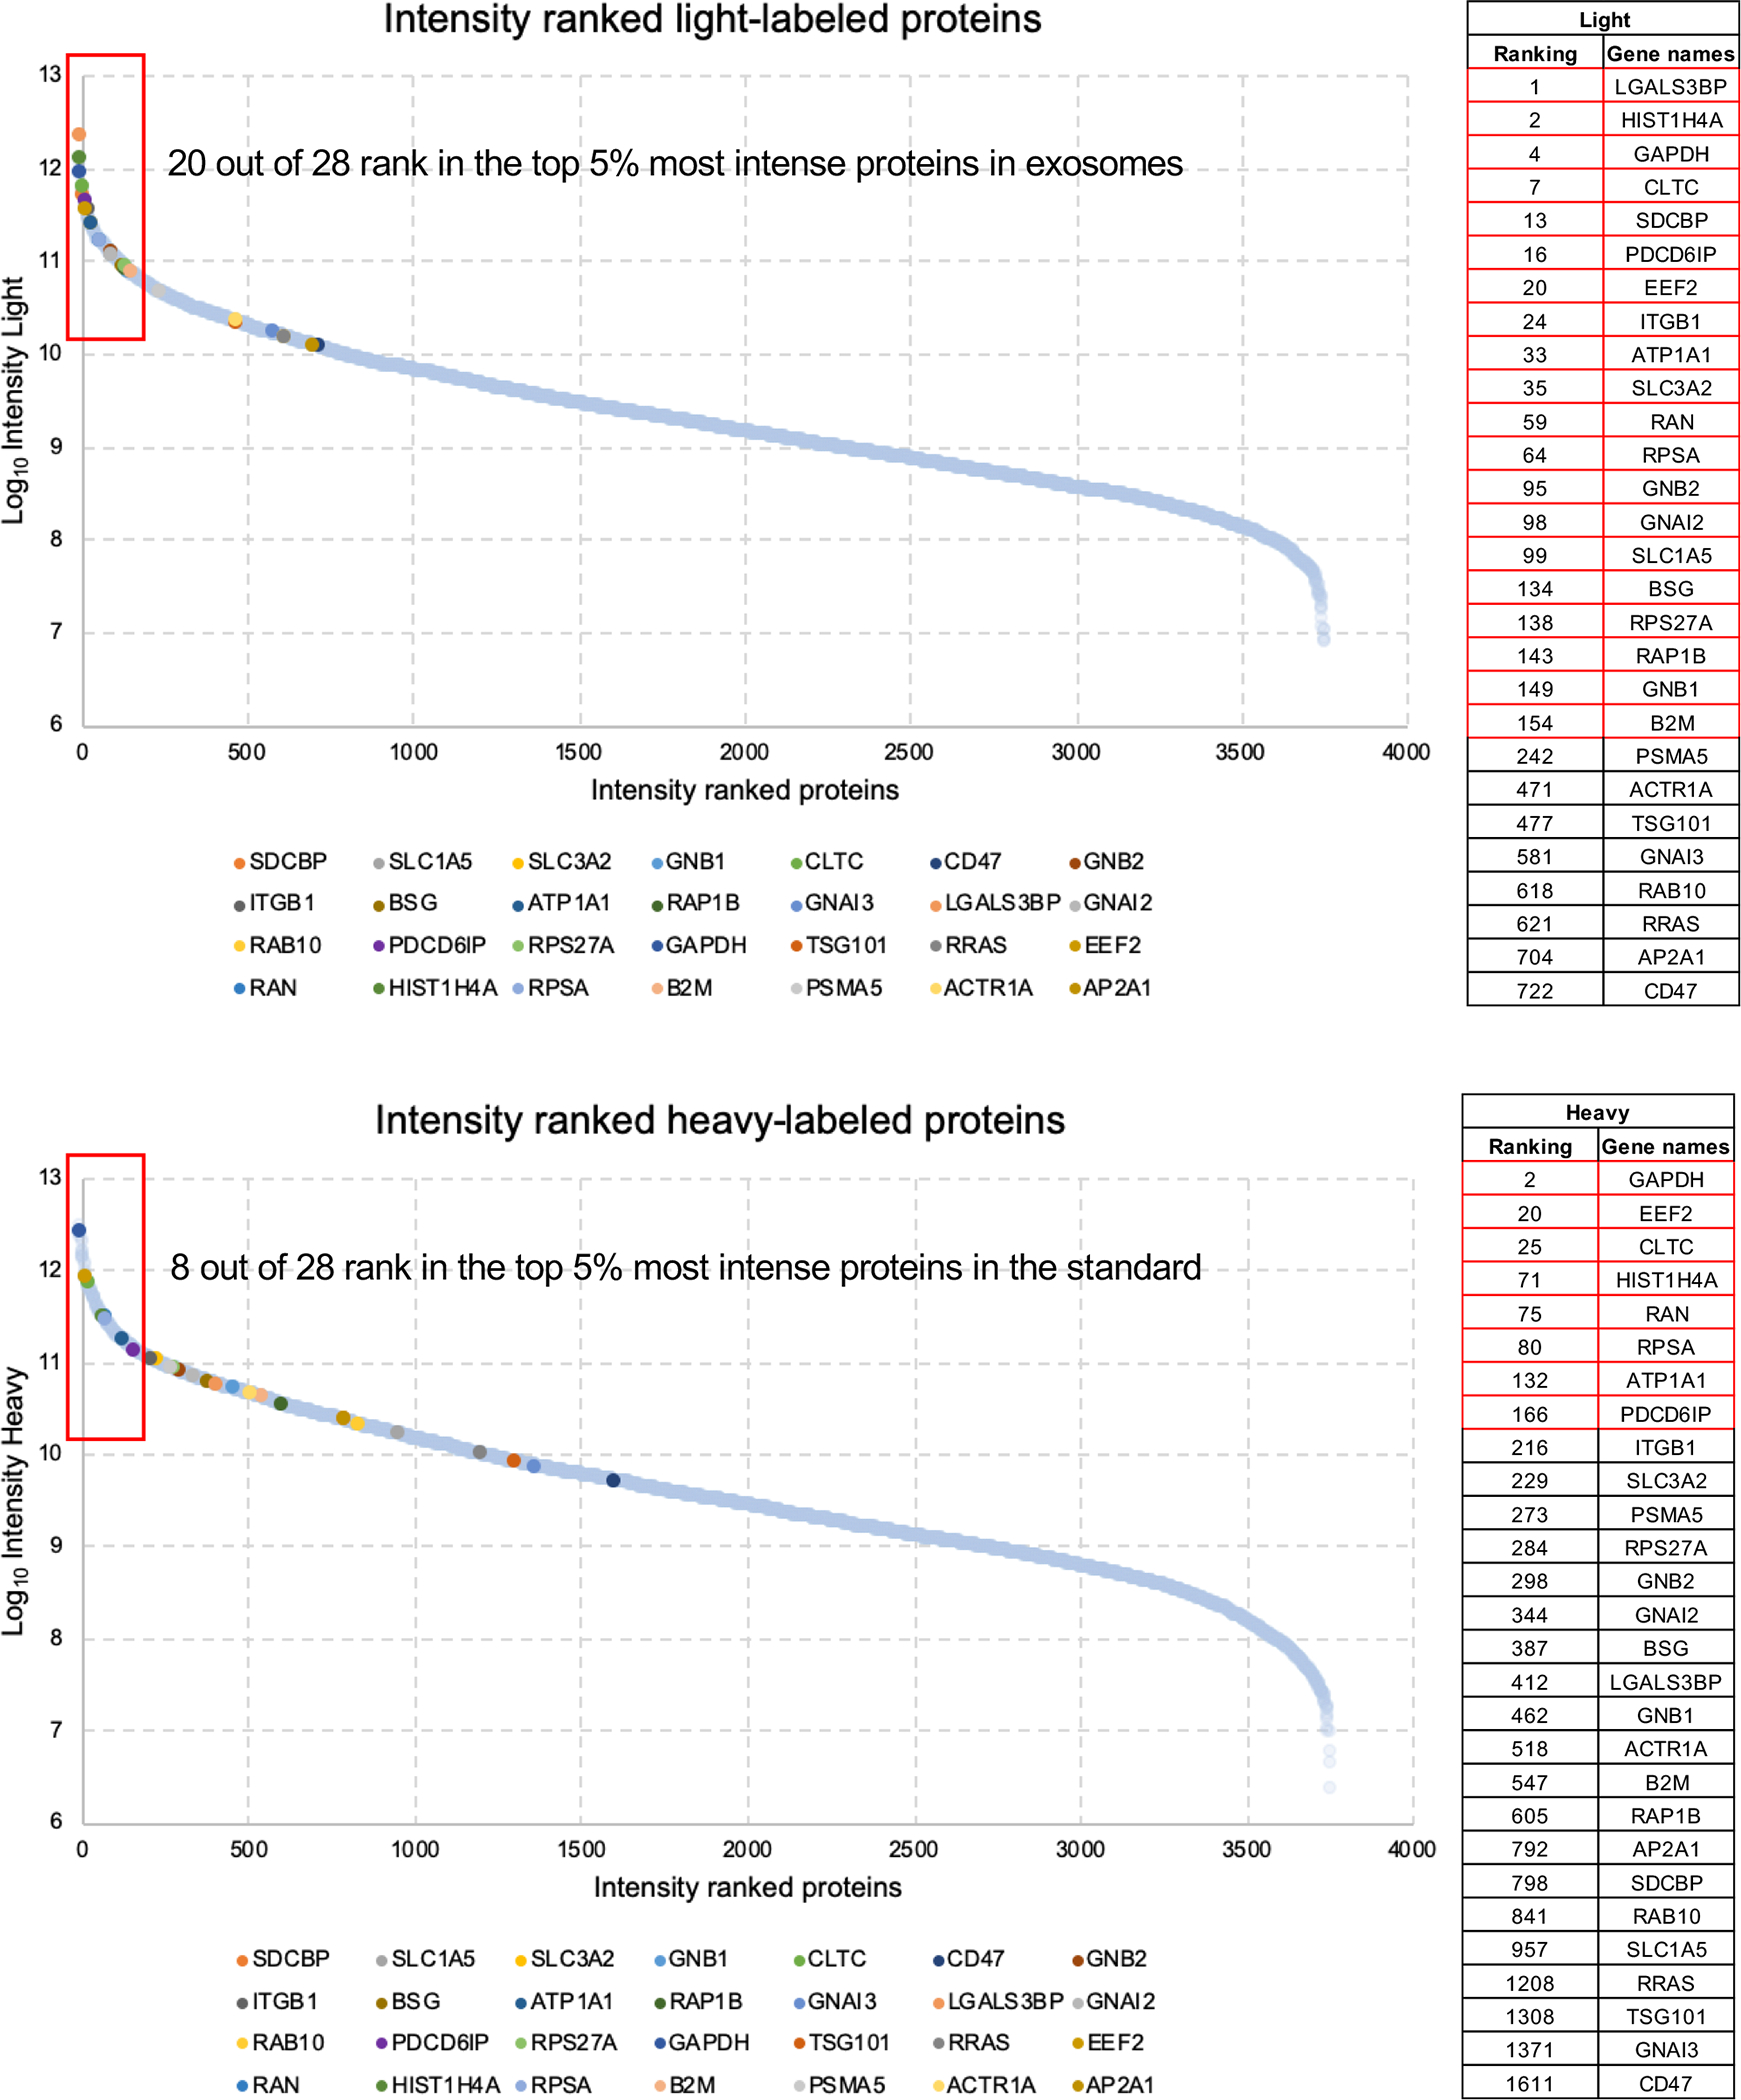
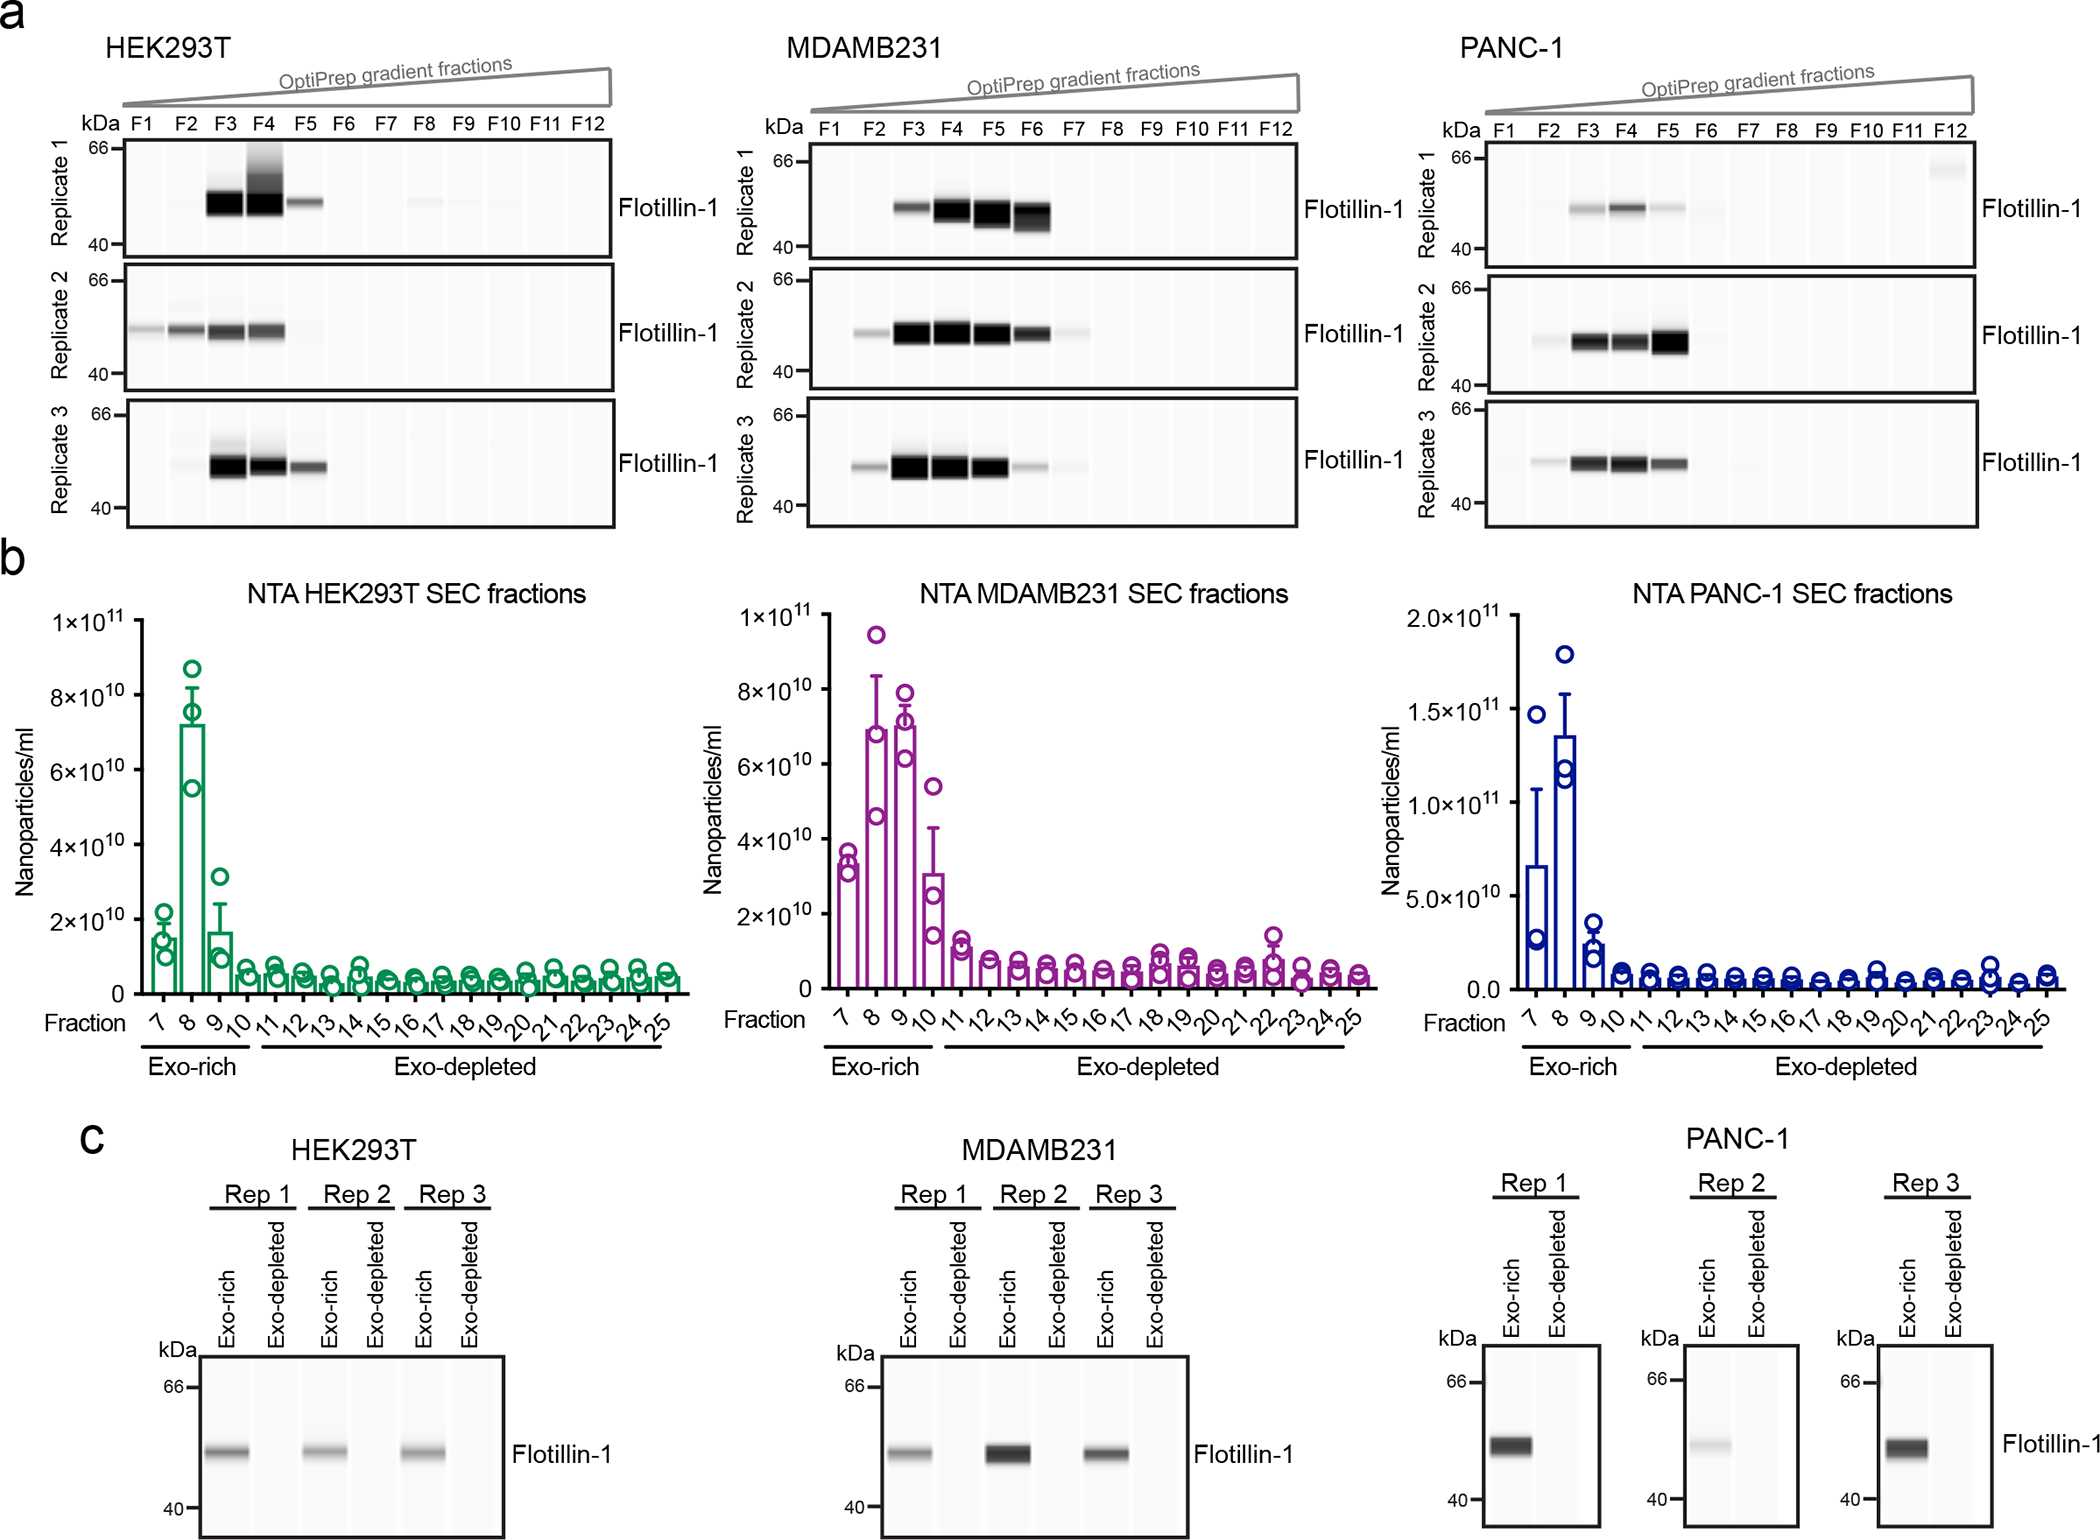
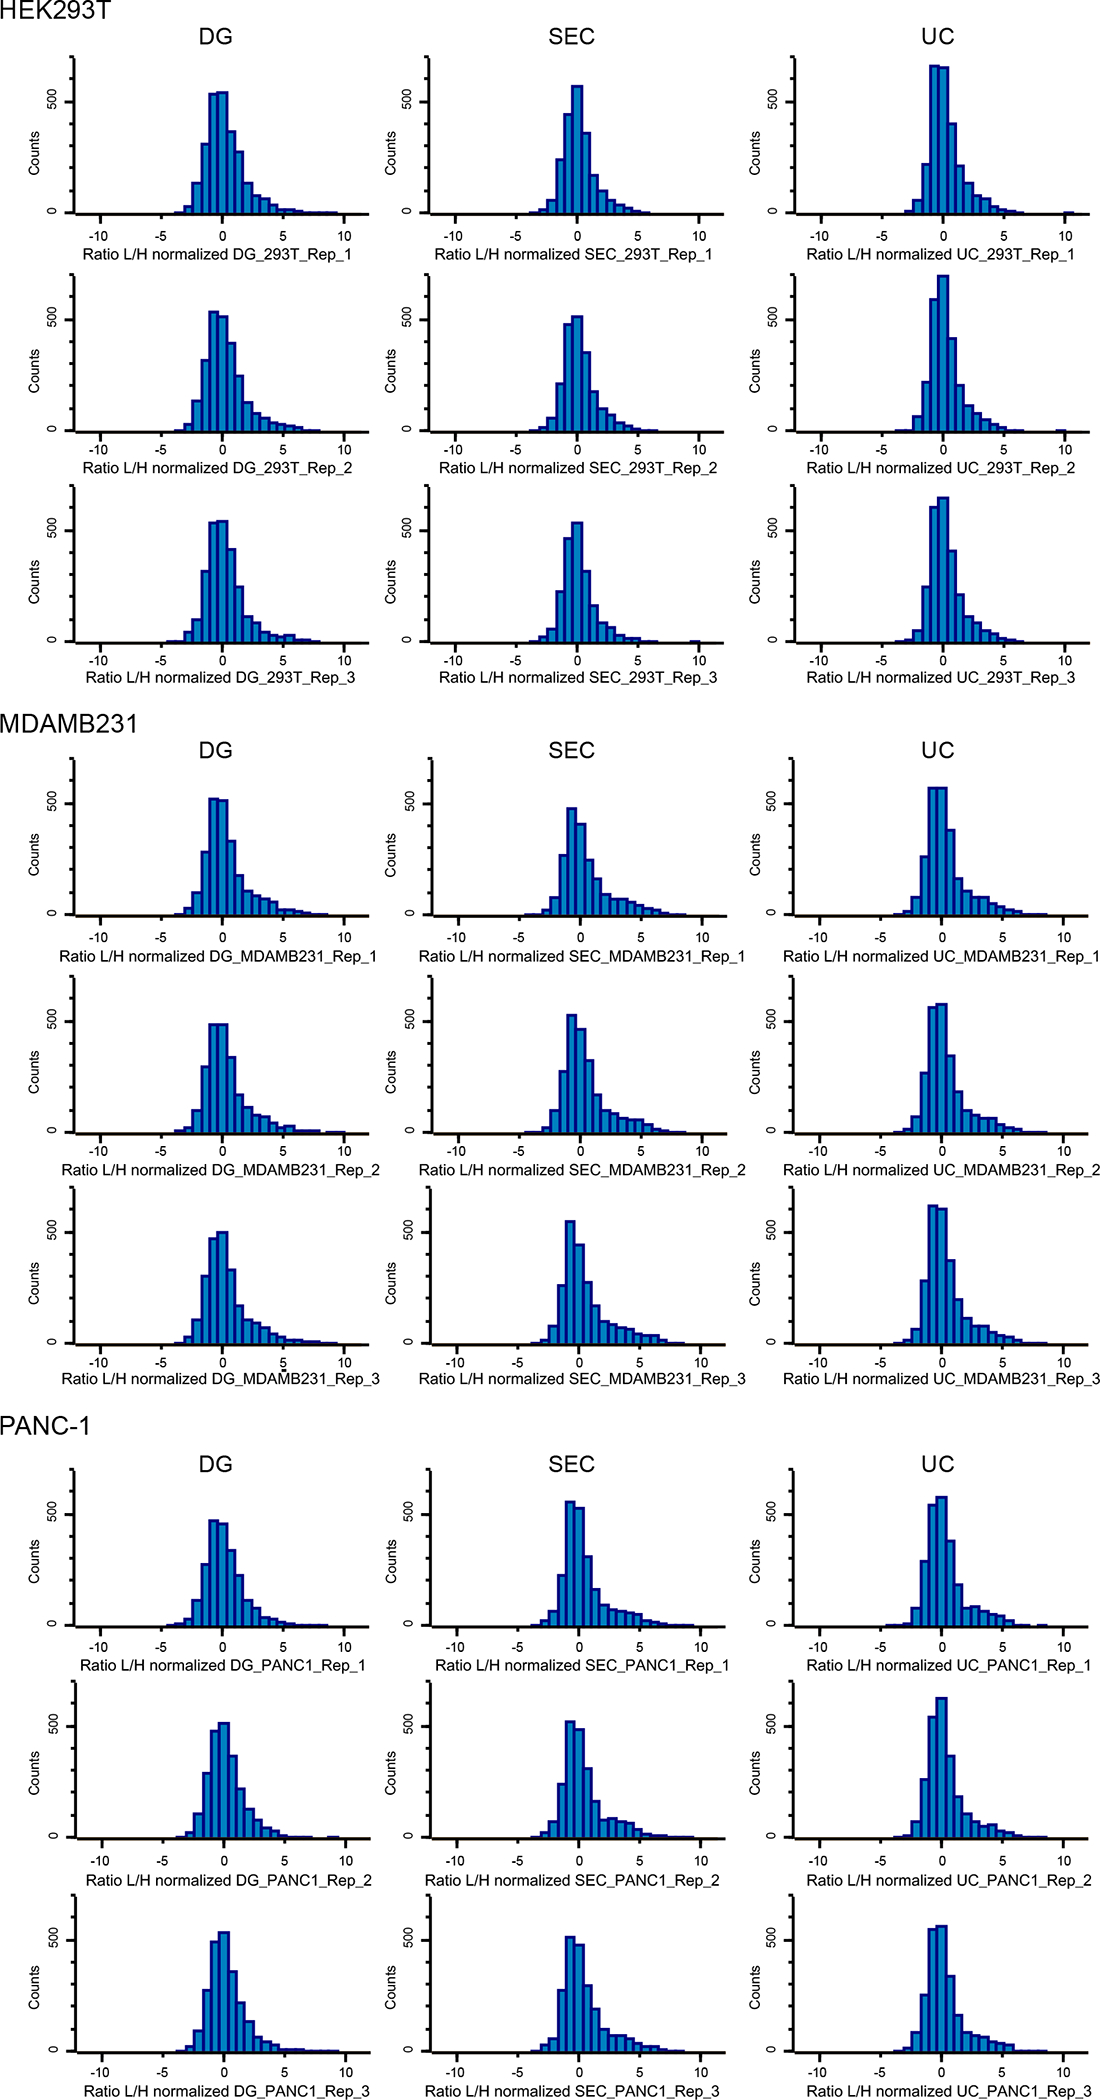
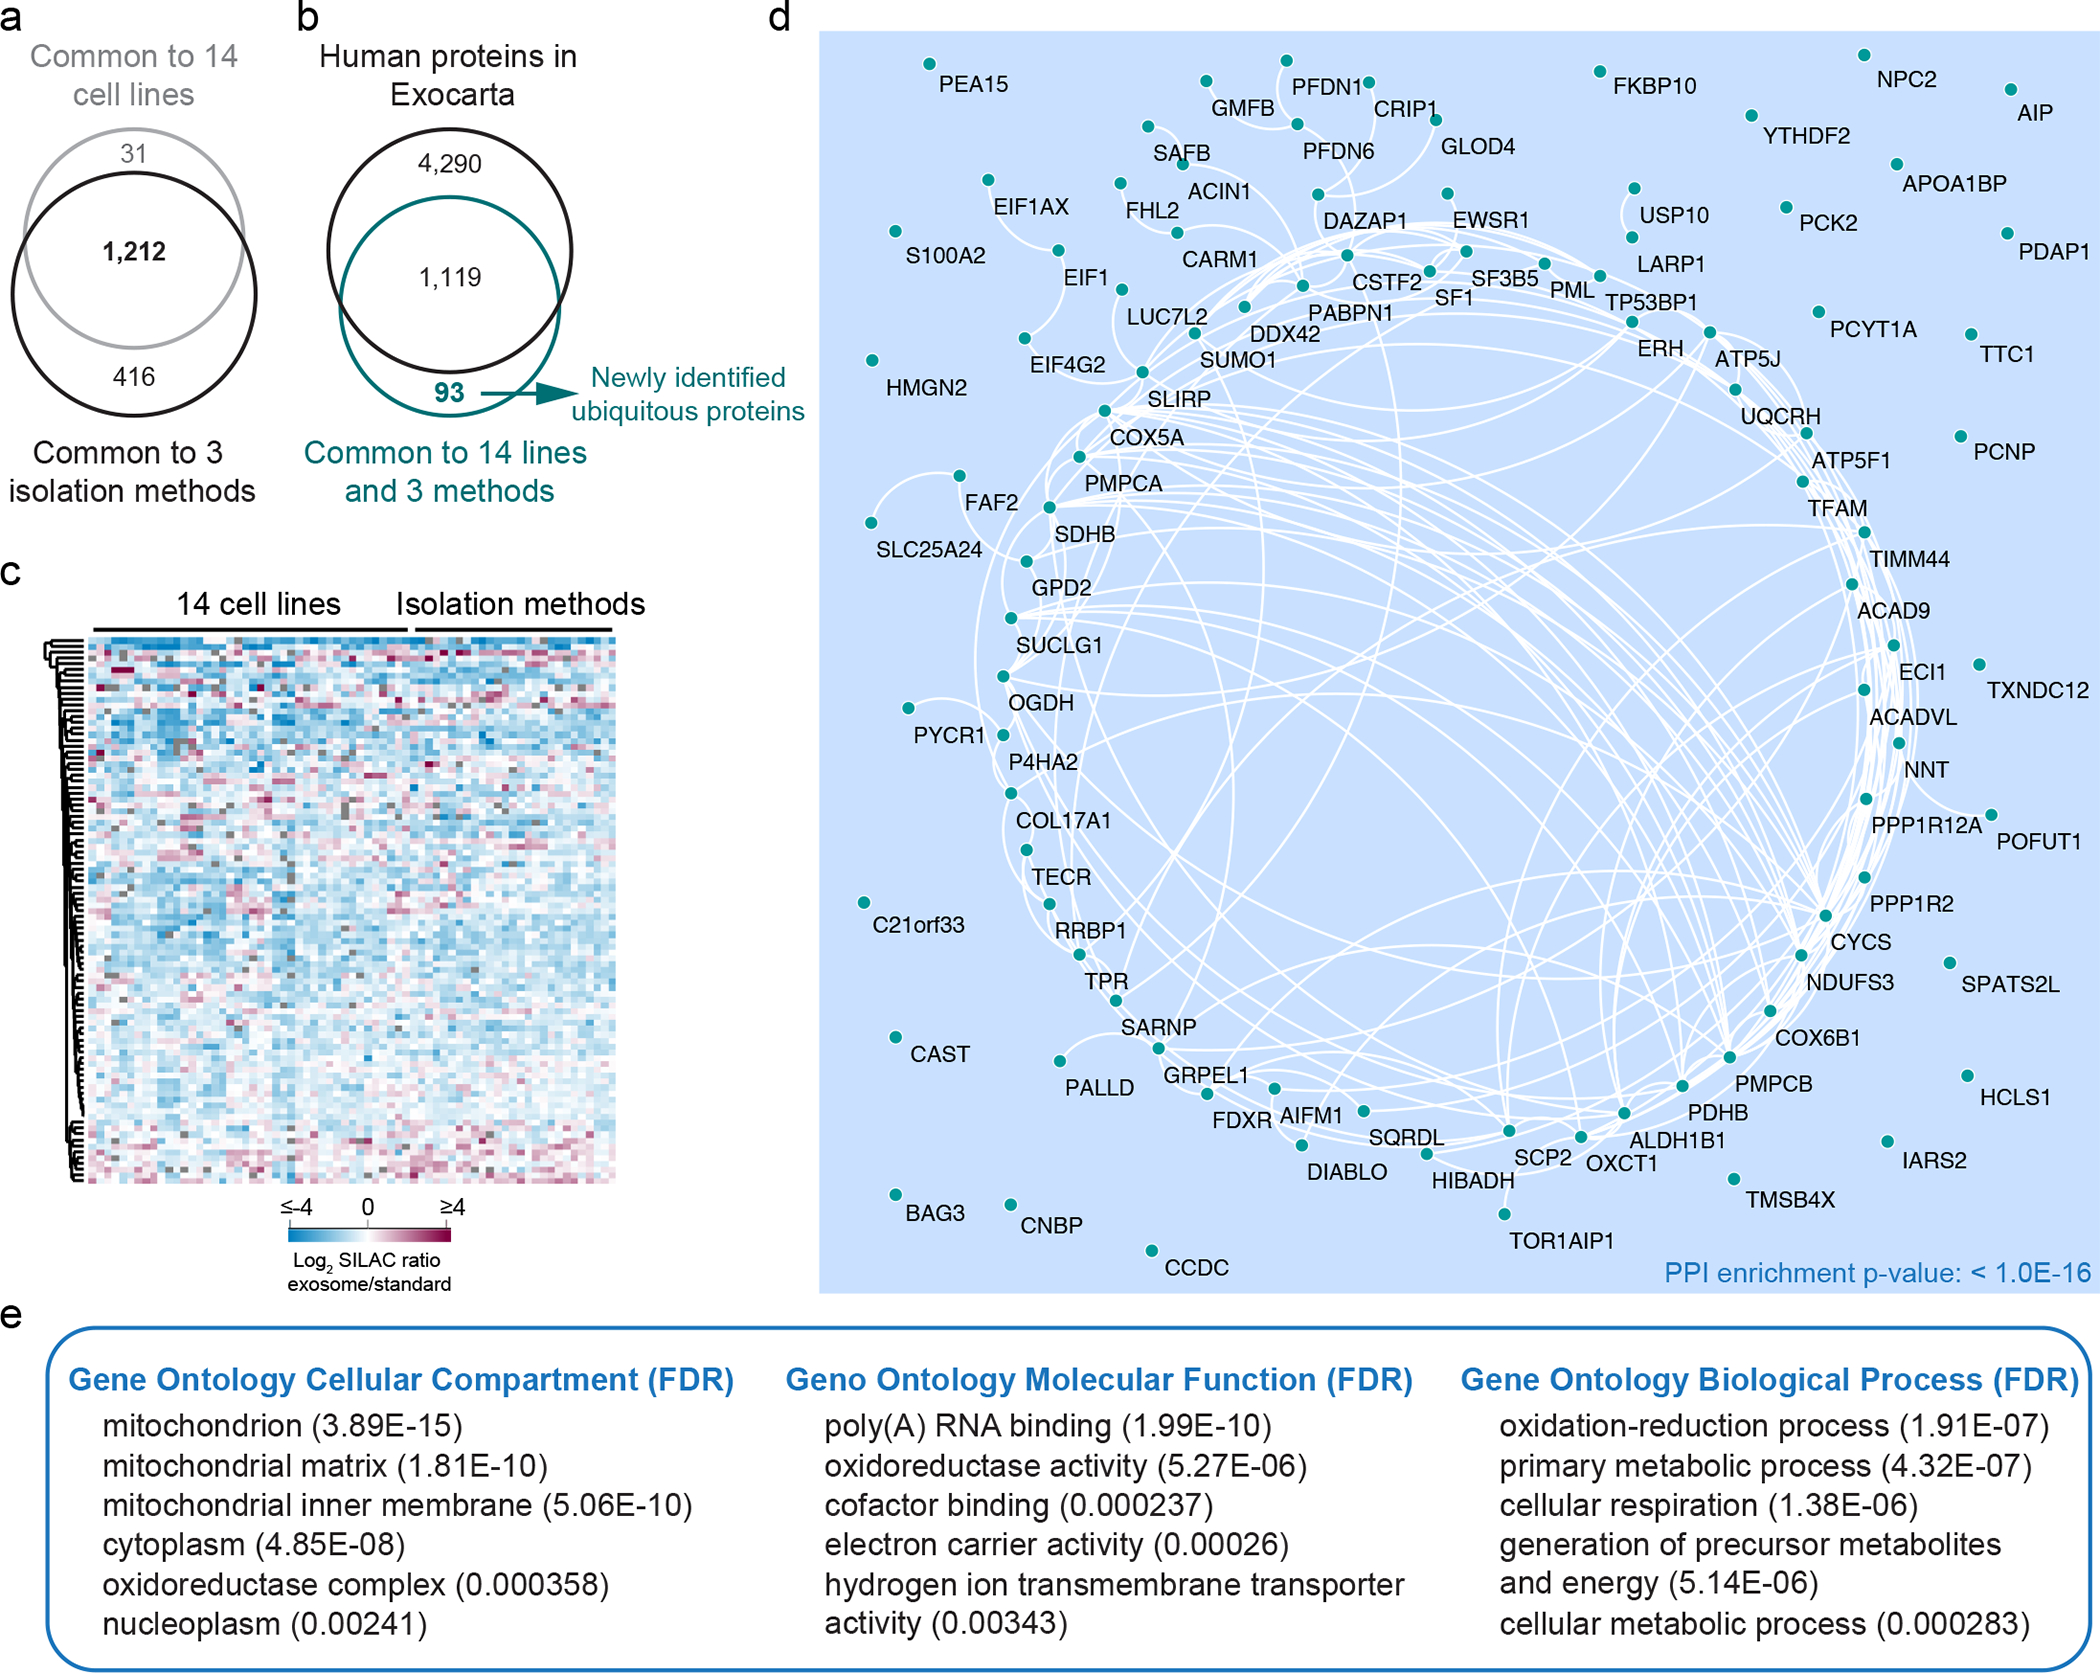
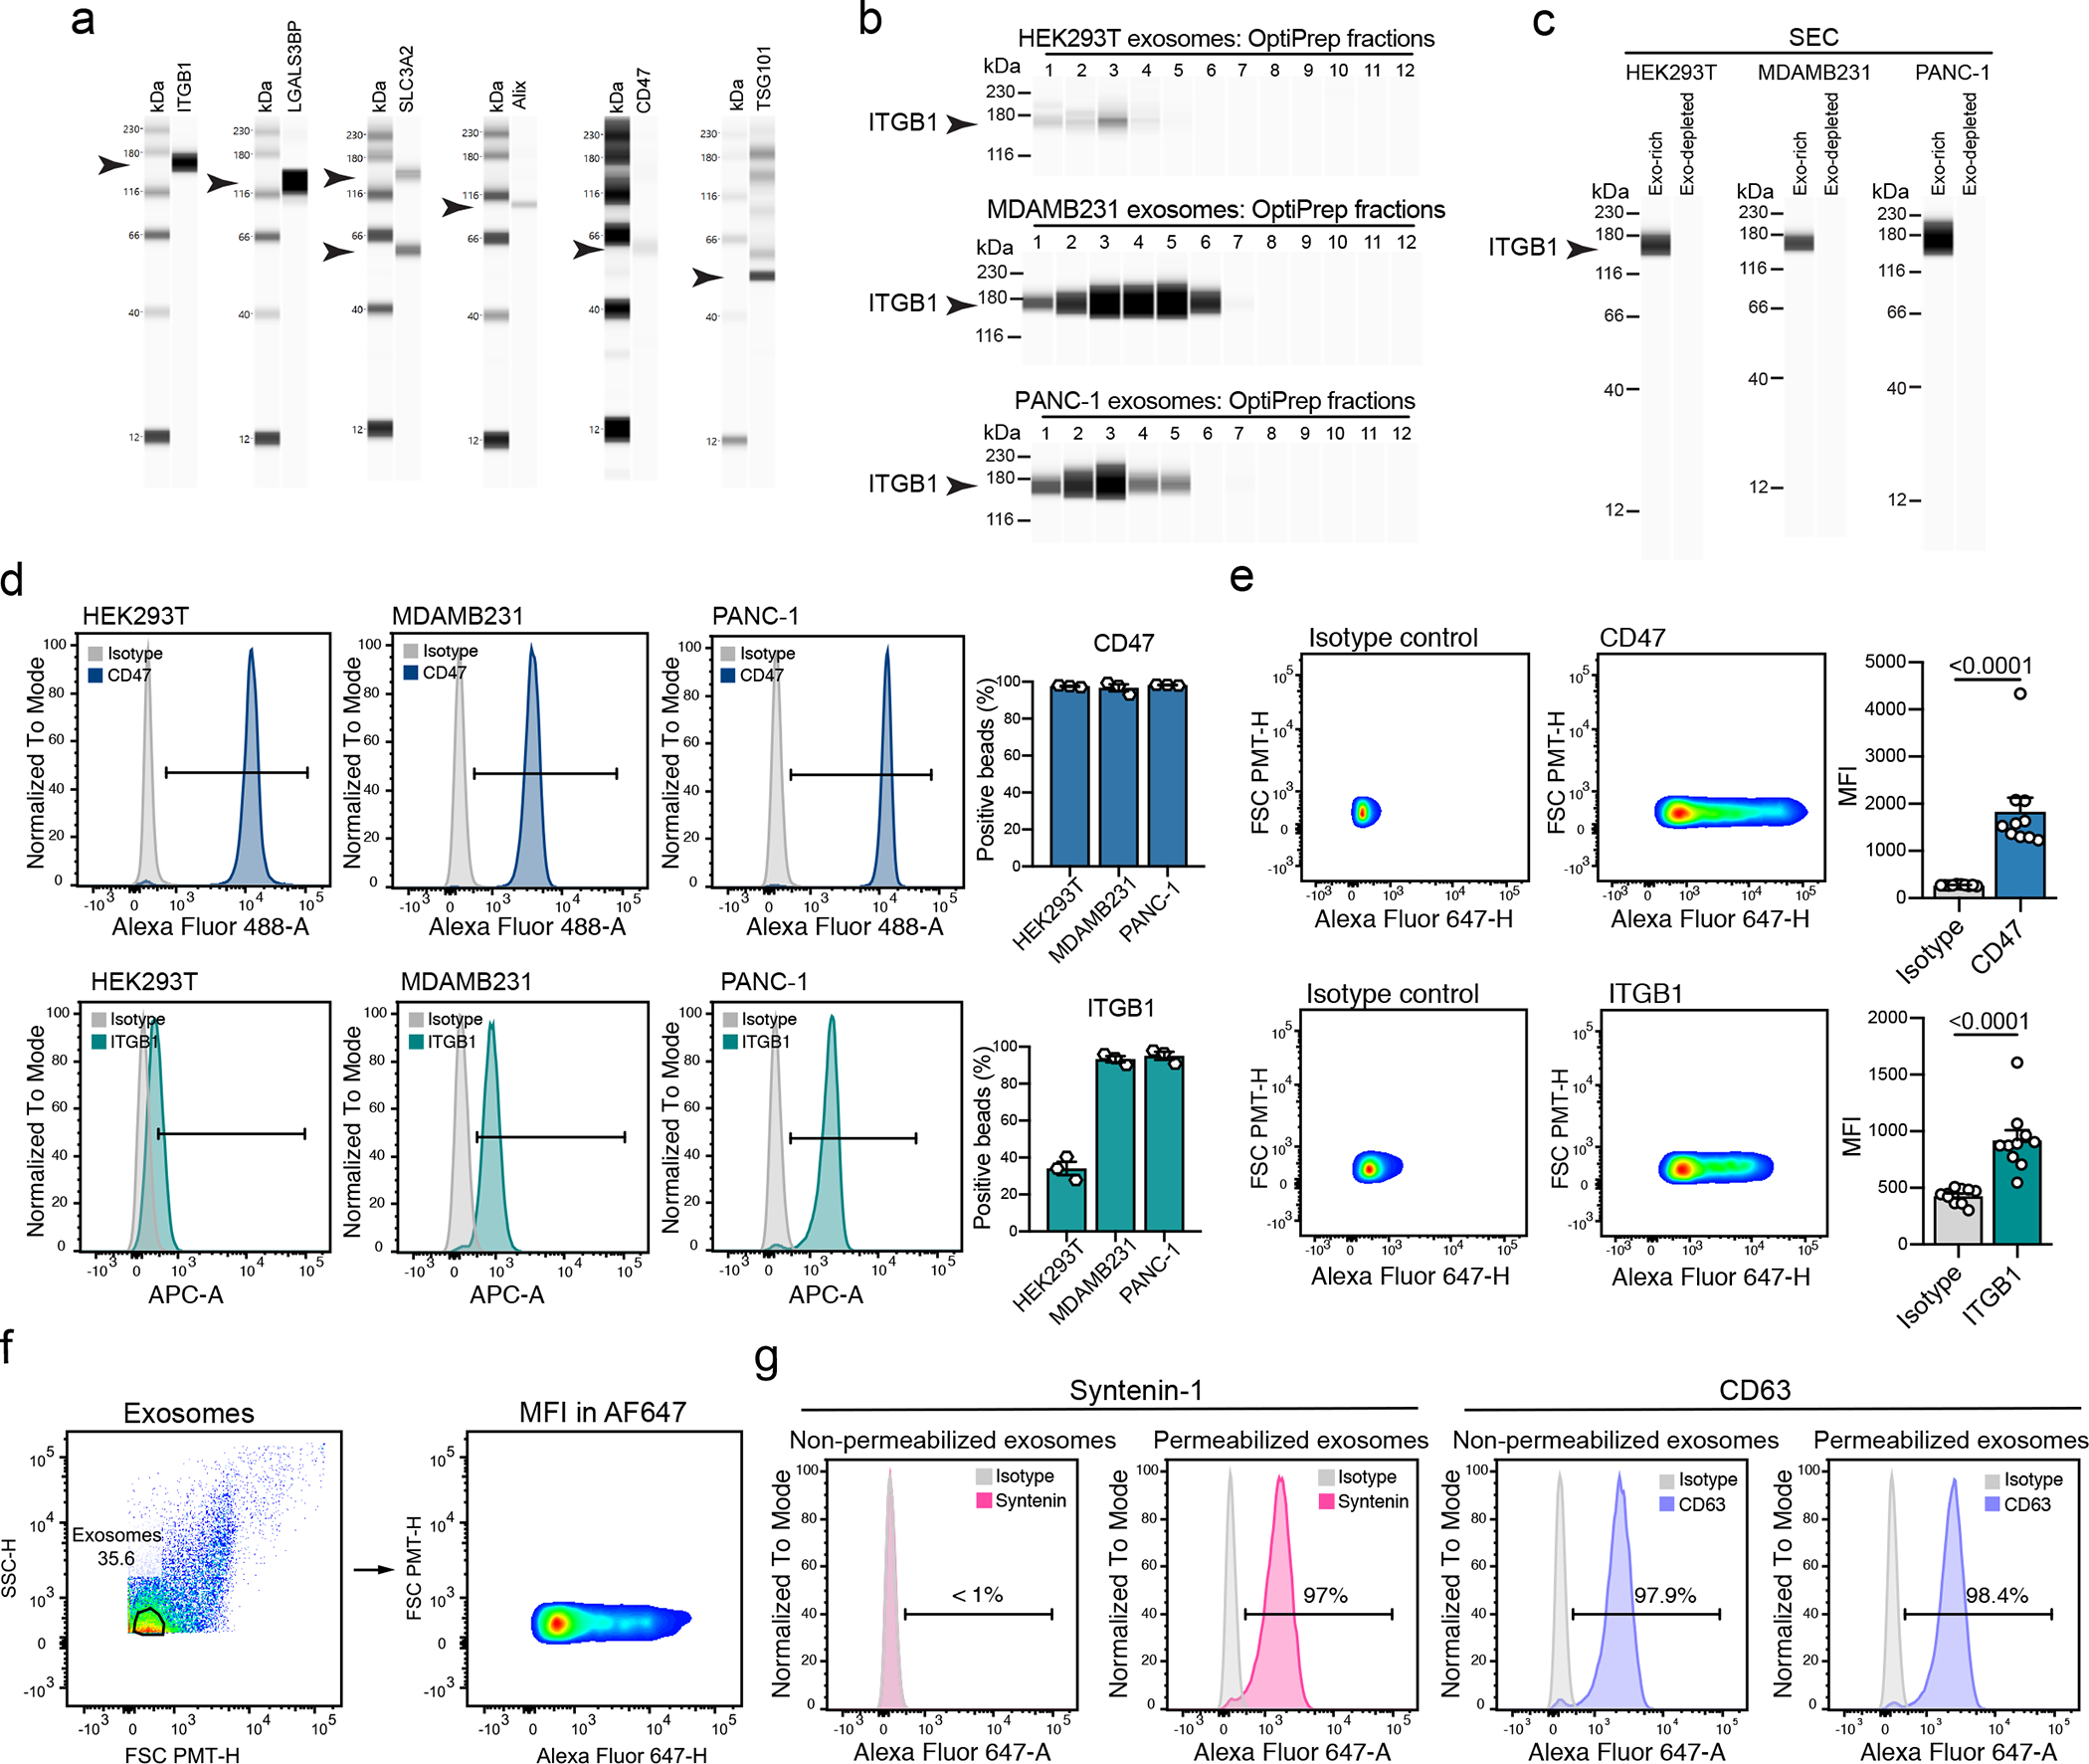
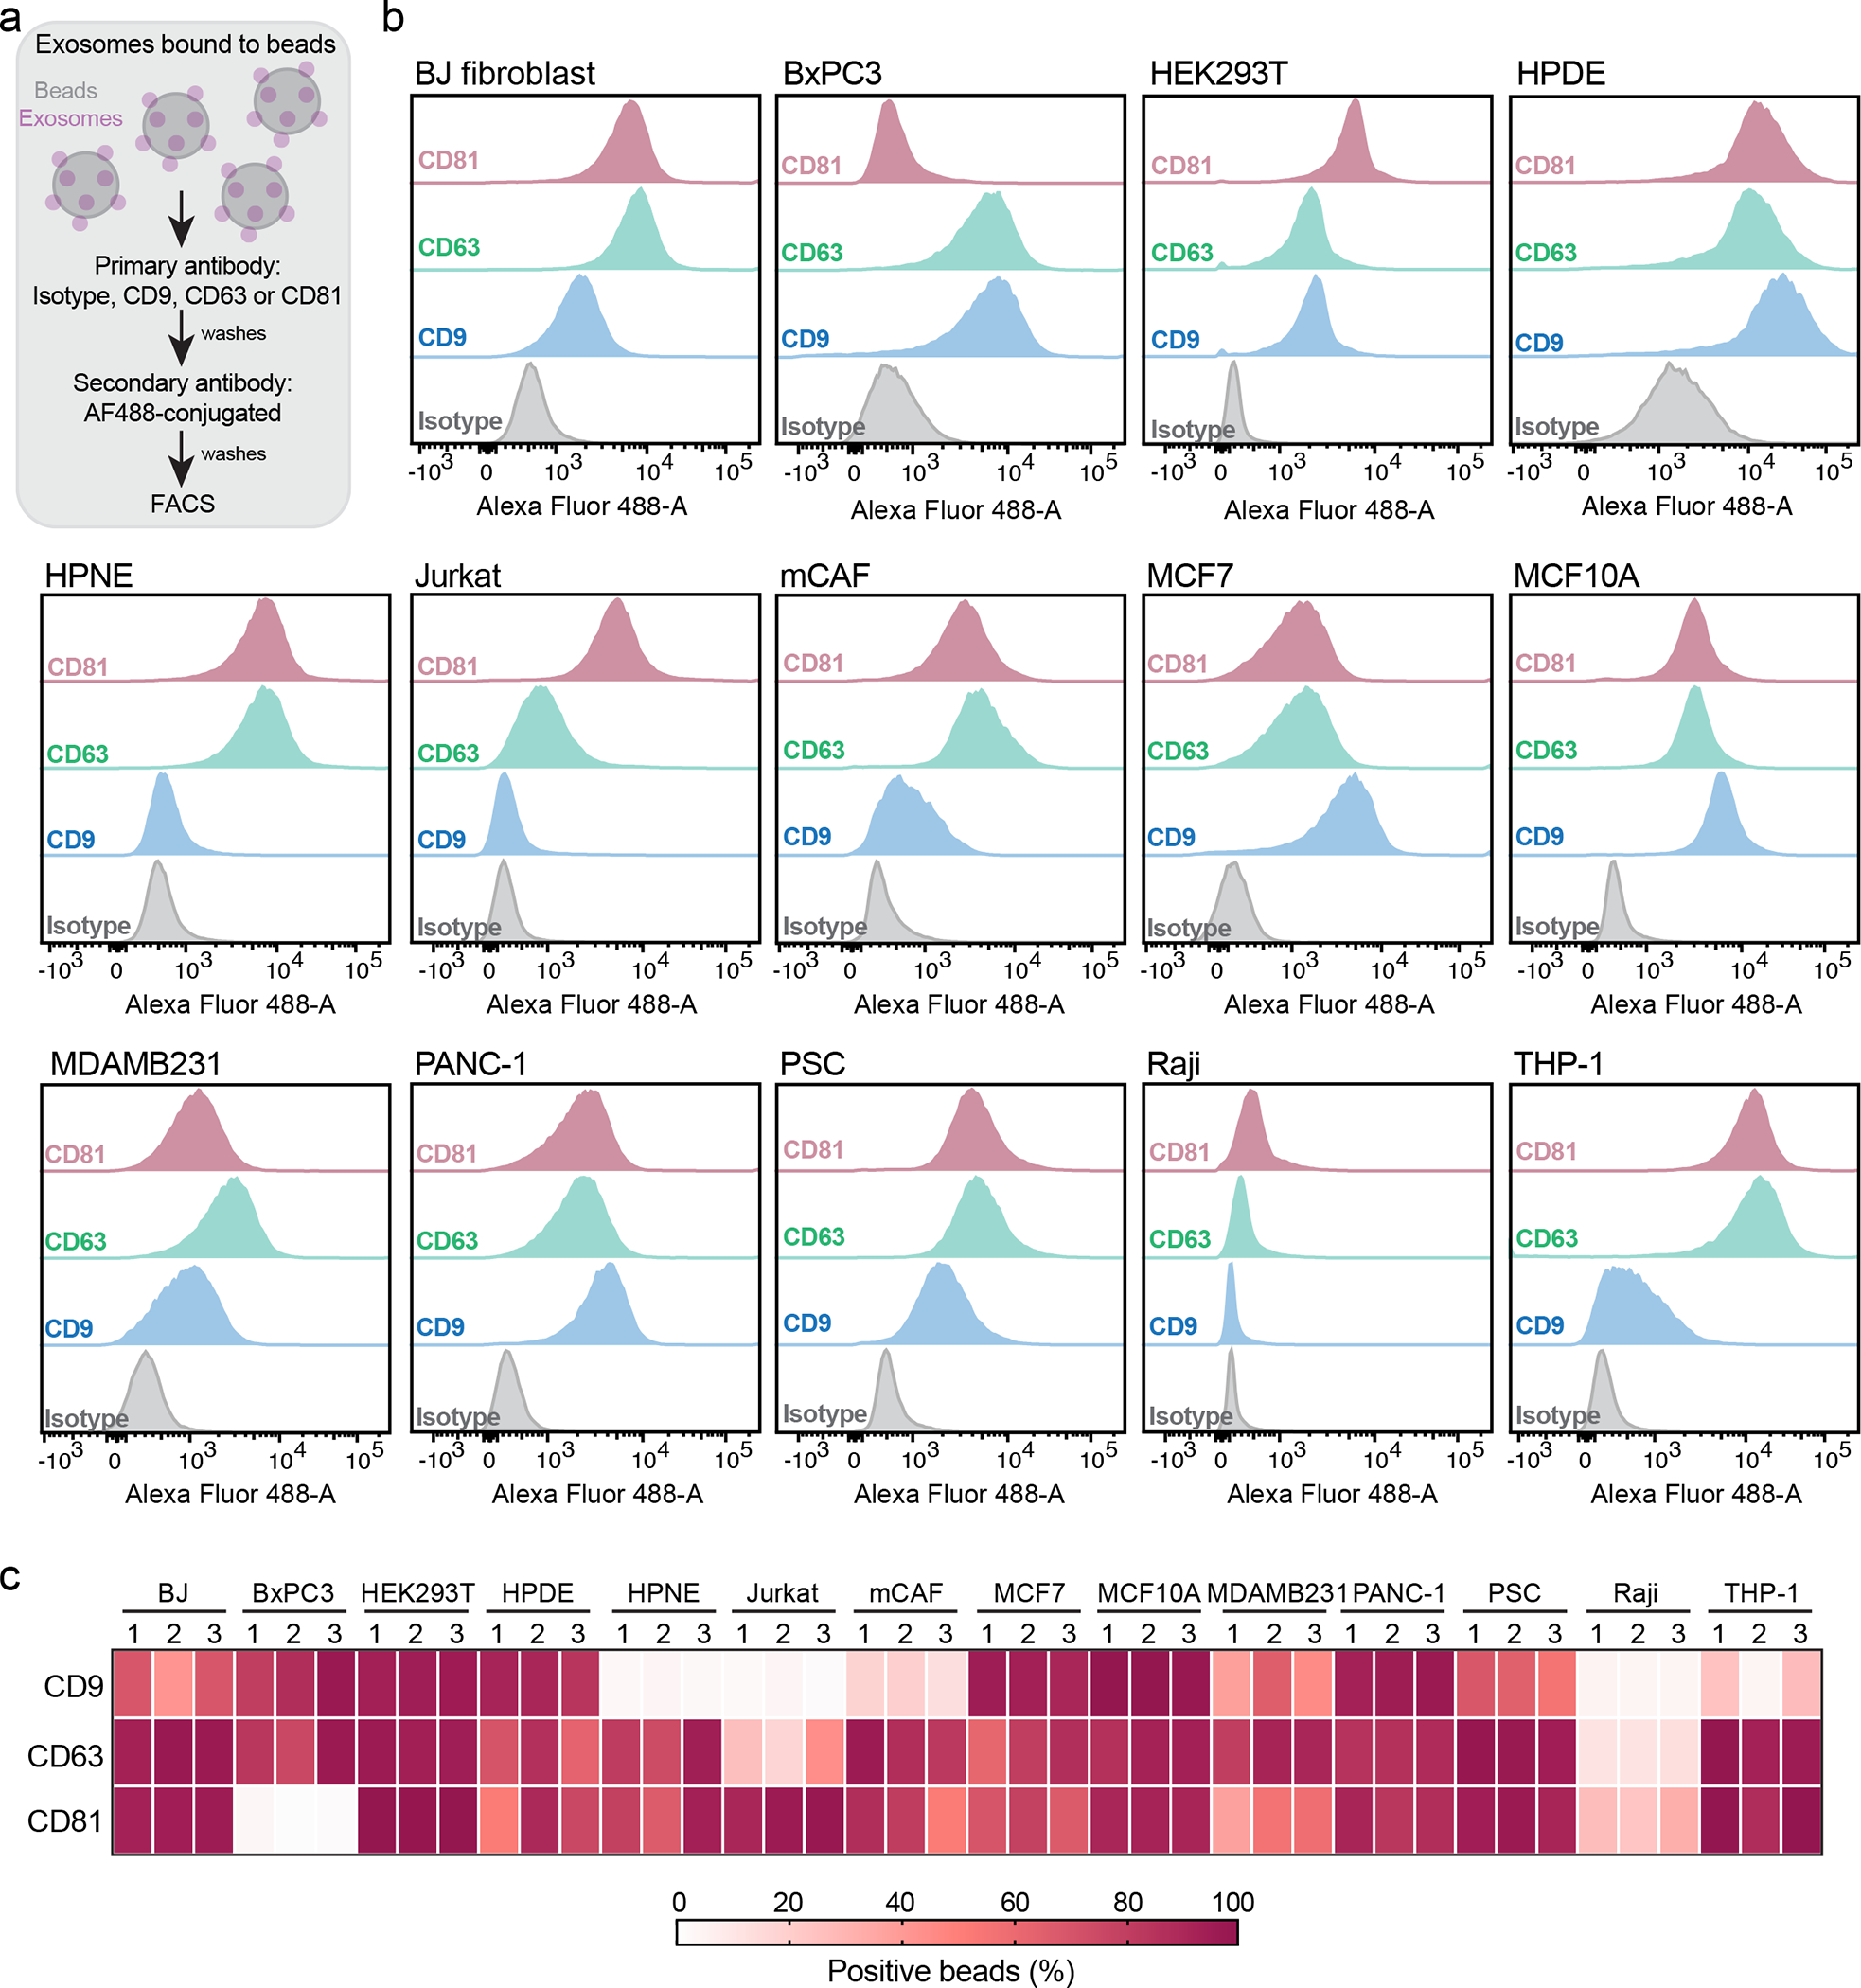
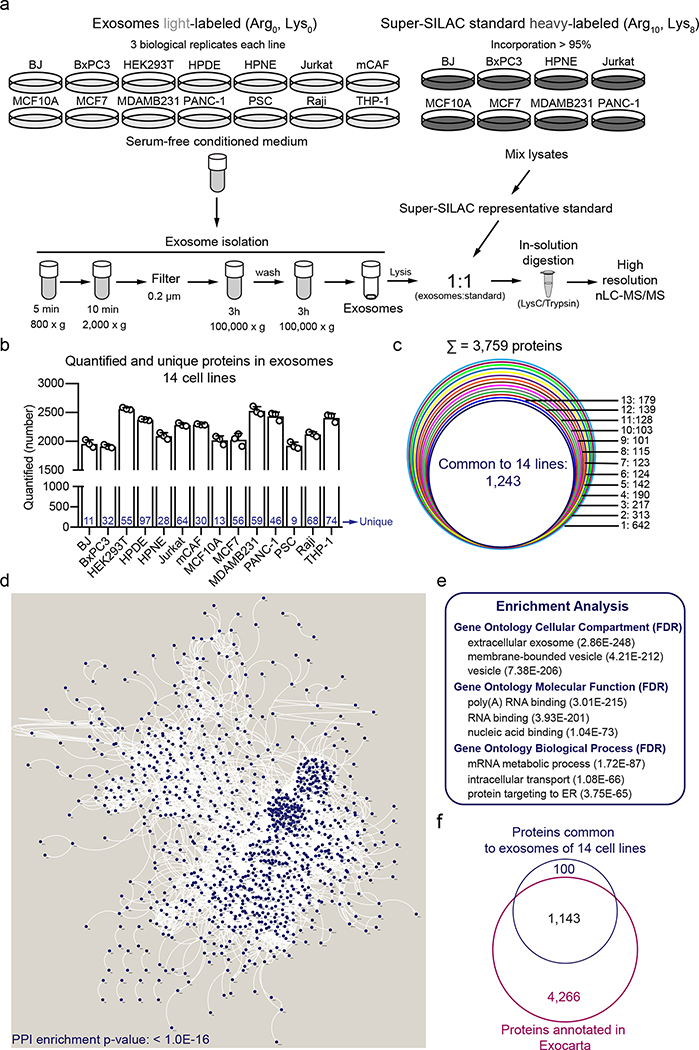
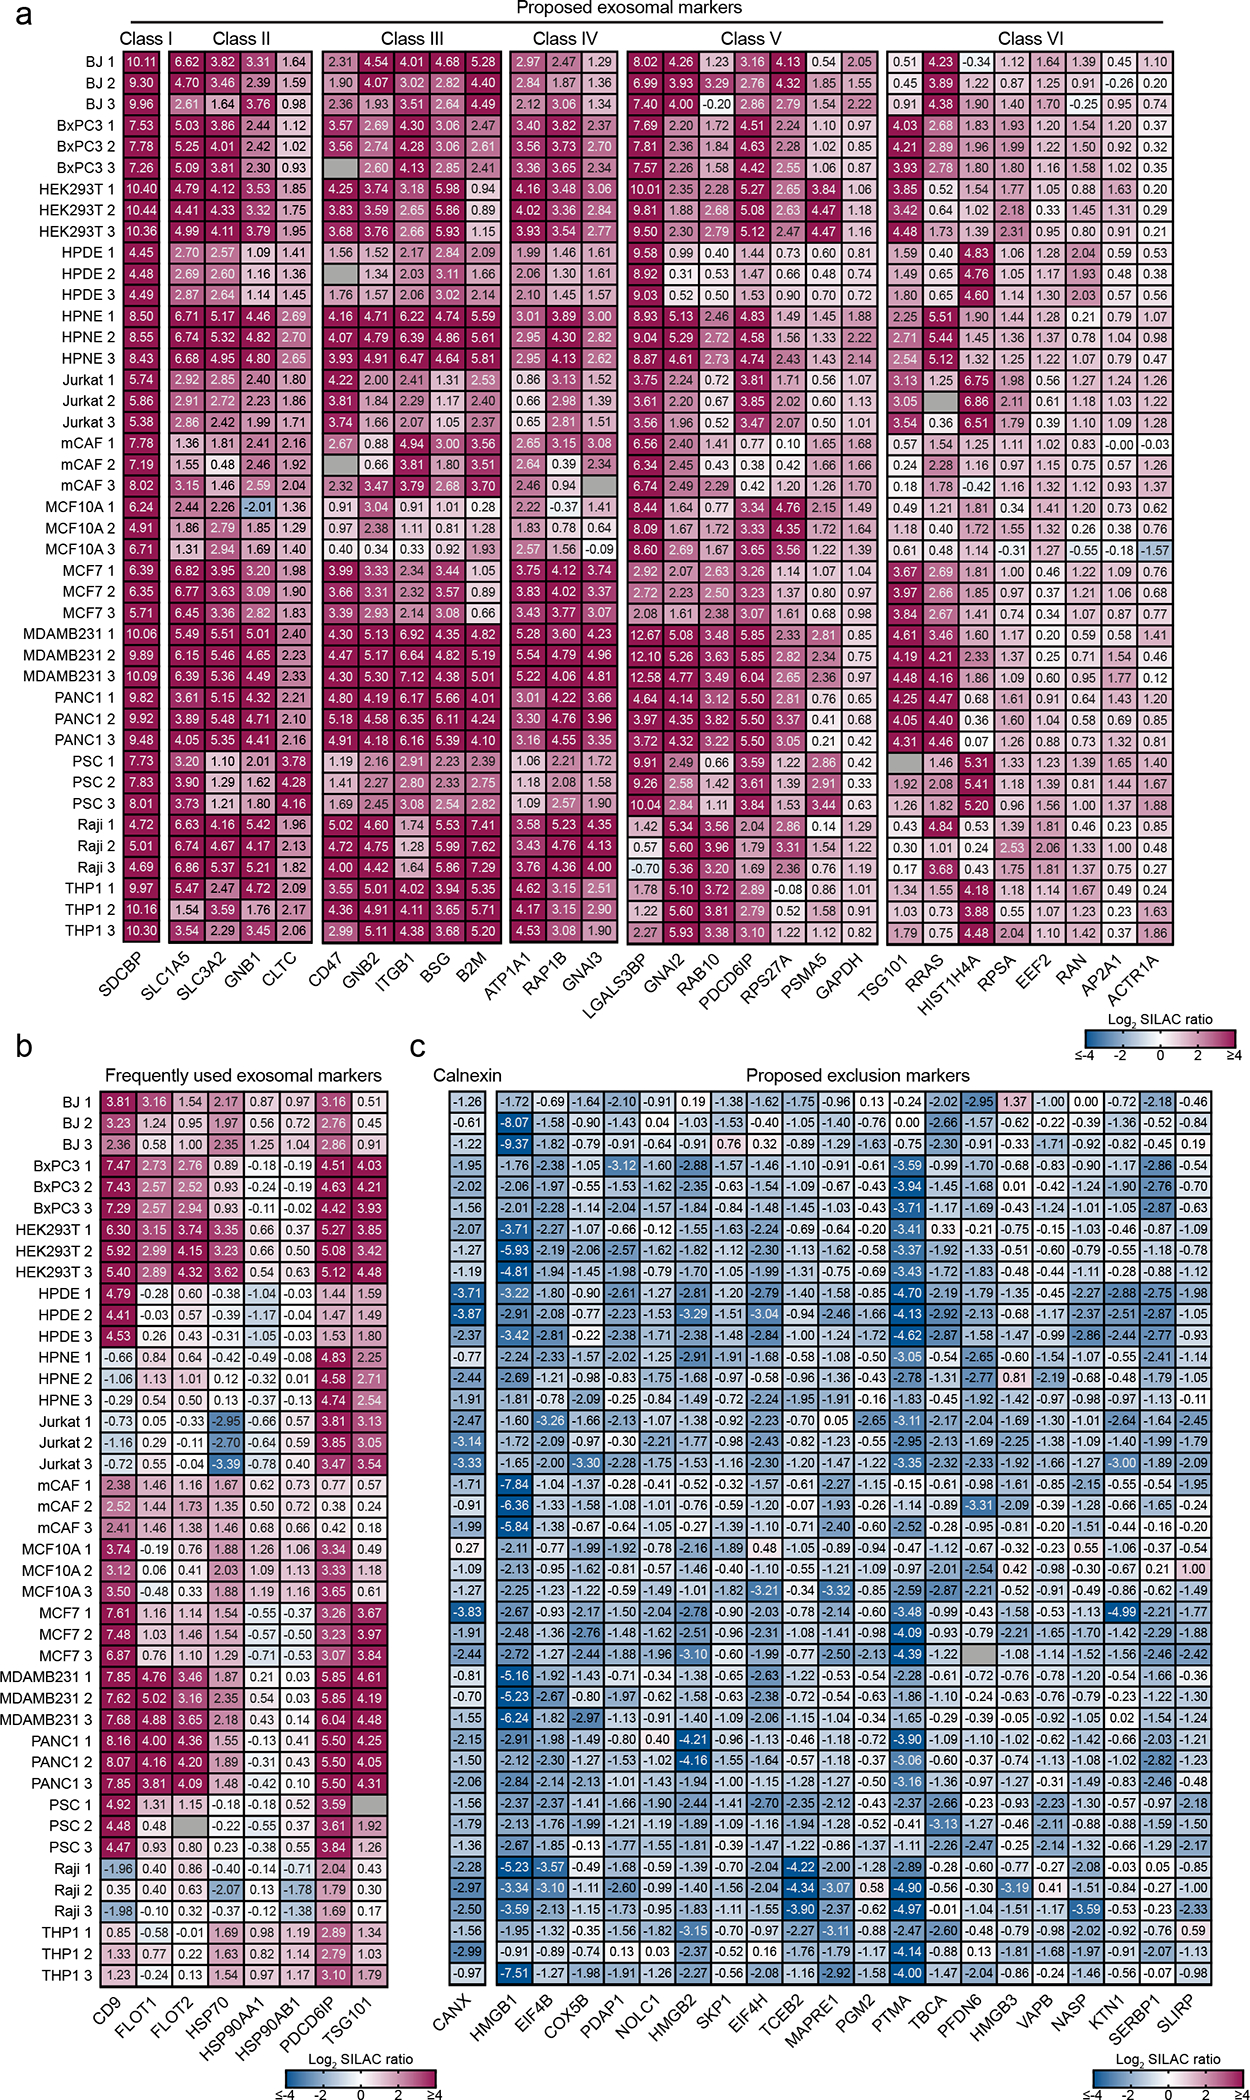
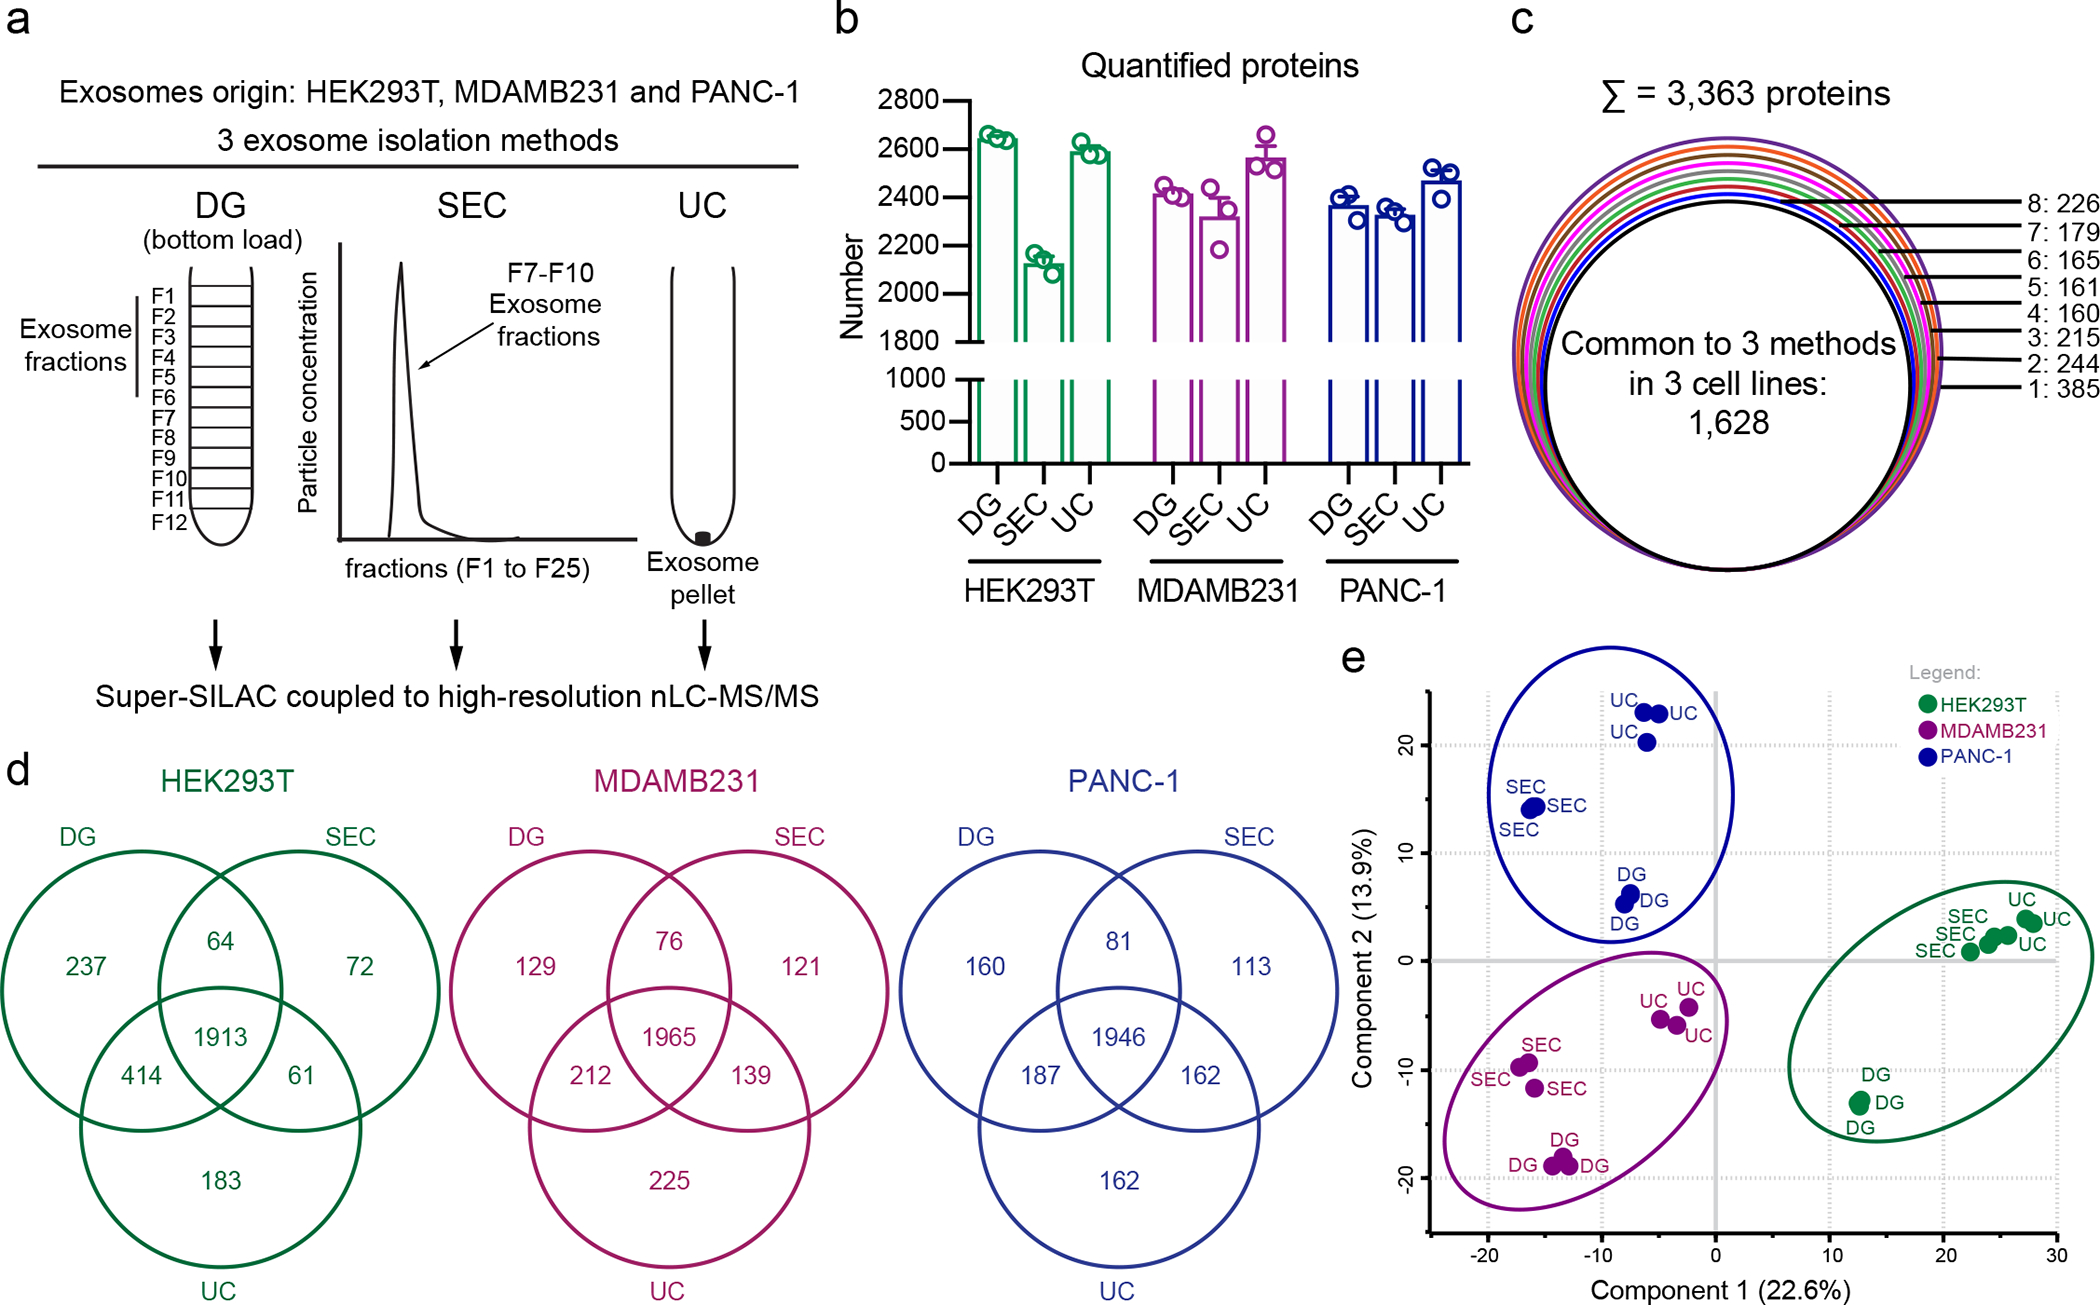
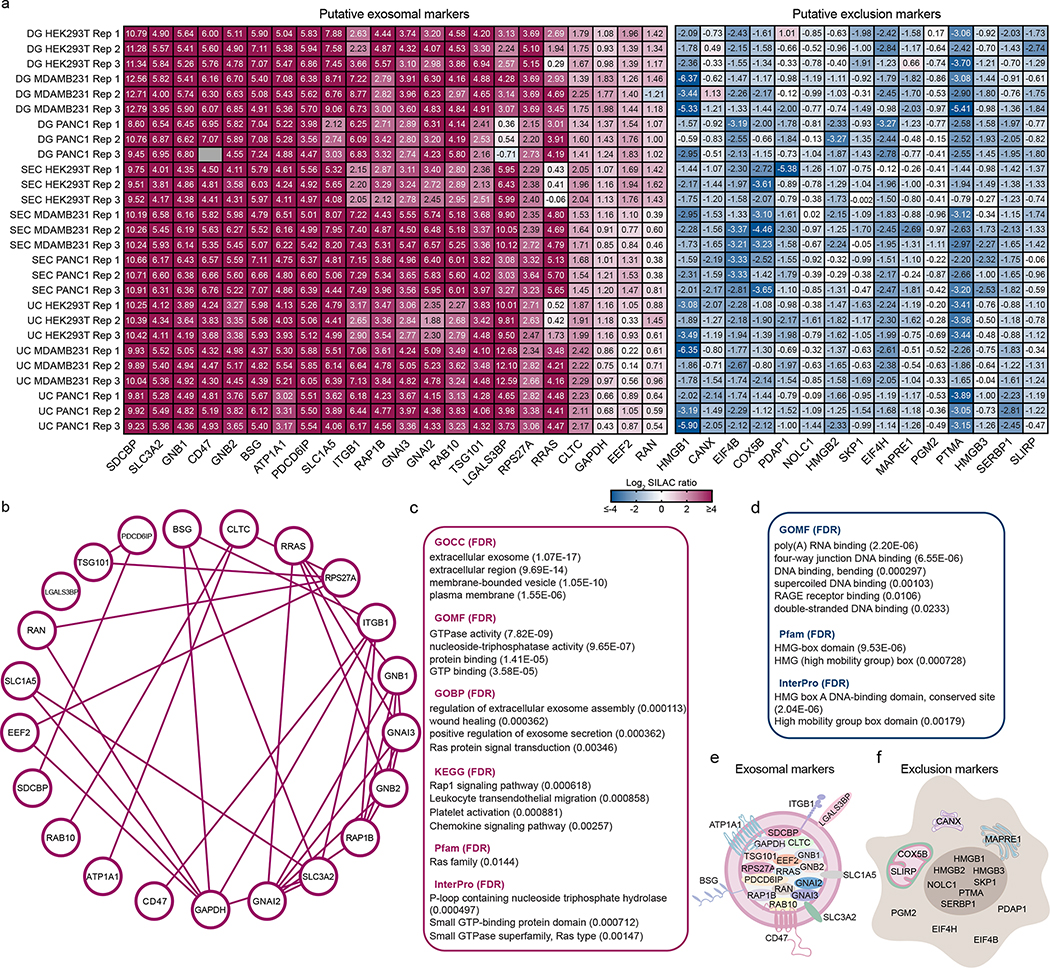
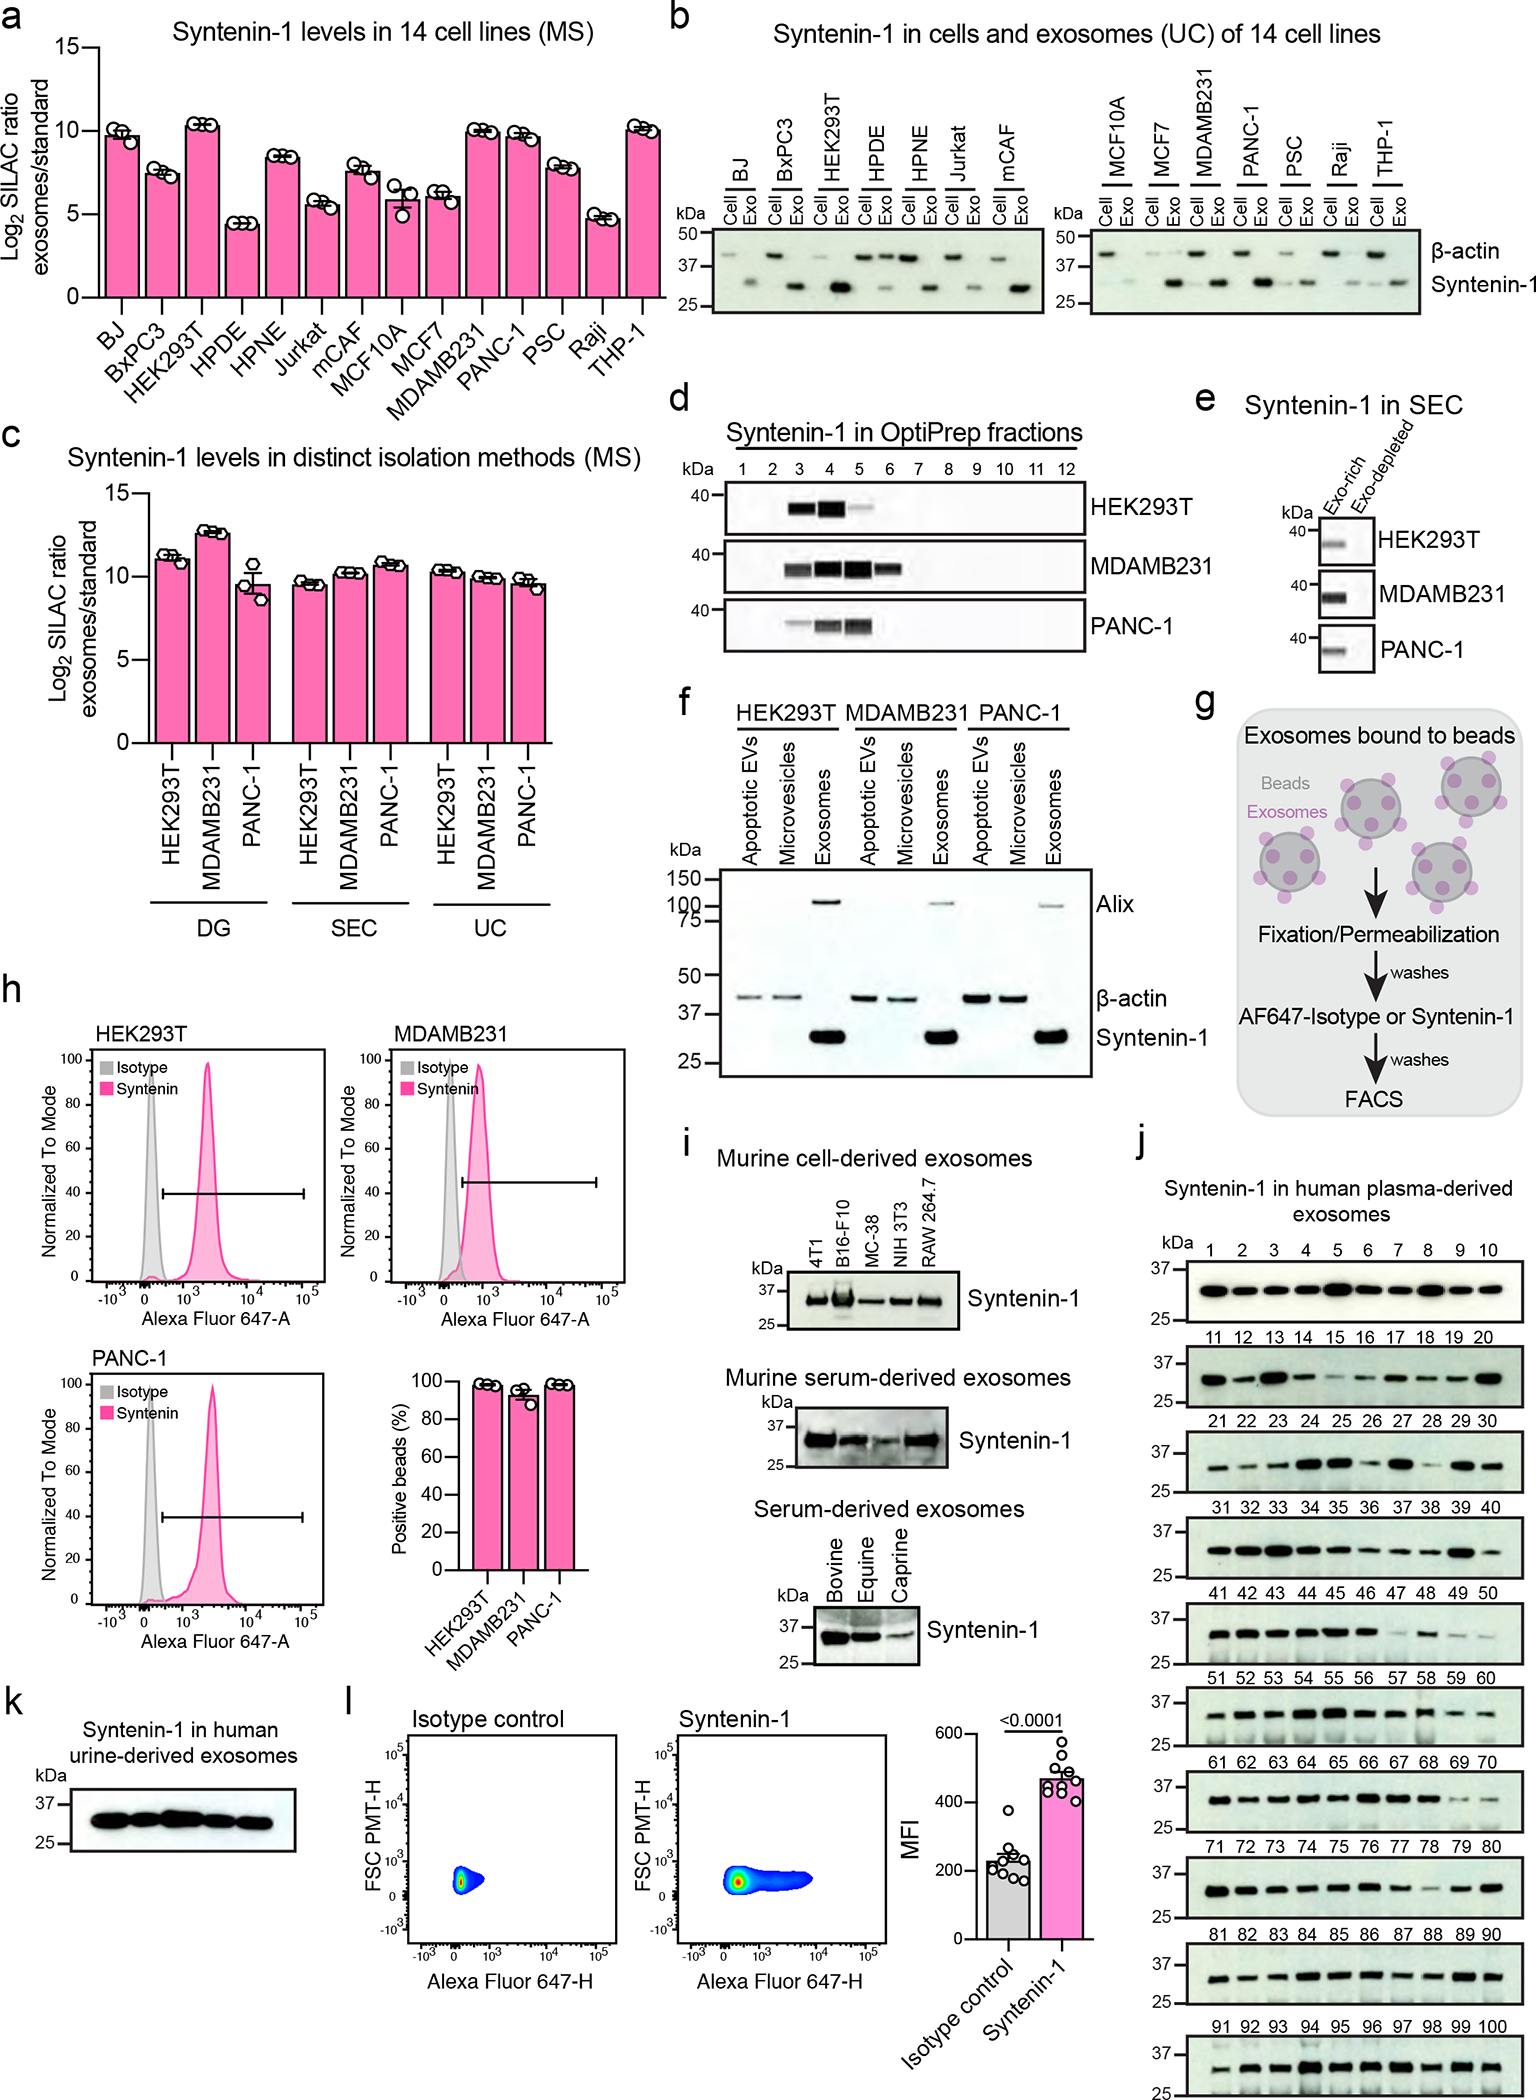
Exosomes are extracellular vesicles derived from the endosomal compartment that are potentially involved in intercellular communication. Here, we found that frequently used biomarkers of exosomes are heterogeneous, and do not exhibit universal utility across different cell types. To uncover ubiquitous and abundant proteins, we used an unbiased and quantitative proteomic approach based on super-stable isotope labeling with amino acids in cell culture (super-SILAC), coupled to high-resolution mass spectrometry. In total, 1,212 proteins were quantified in the proteome of exosomes, irrespective of the cellular source or isolation method. A cohort of 22 proteins was universally enriched. Fifteen proteins were consistently depleted in the proteome of exosomes compared to cells. Among the enriched proteins, we identified biogenesis-related proteins, GTPases and membrane proteins, such as CD47 and ITGB1. The cohort of depleted proteins in exosomes was predominantly composed of nuclear proteins. We identified syntenin-1 as a consistently abundant protein in exosomes from different cellular origins. Syntenin-1 is also present in exosomes across different species and biofluids, highlighting its potential use as a putative universal biomarker of exosomes. Our study provides a comprehensive quantitative atlas of core proteins ubiquitous to exosomes that can serve as a resource for the scientific community.


Conflict of interest statement

Competing interests

MD Anderson Cancer Center and R.K. hold patents in the area of exosome biology and are licensed to Codiak Biosciences, Inc. MD Anderson Cancer Center and R.K. are stock equity holders in Codiak Biosciences, Inc. R.K. is a consultant and scientific adviser for Codiak Biosciences, Inc. The remaining authors declare no competing interests.

Figures

Extended Data Fig. 1
Extended Data Fig. 1. Flow cytometry-based evaluation of cell death in the 14 cell lines upon serum-starvation.
(a) Plots show Annexin V and 7-AAD co-staining in serum-starved cells and in the positive control spiked with apoptotic cells. The double positive population is shown in the top right quadrant. (b) Quantifications of apoptotic cells (Annexin V+ and 7-AAD+) in the parental cells upon serum-starvation for exosome production. Bar graph shows mean +/− s.e.m, individual data points refer to three biological replicates.
Extended Data Fig. 2
Extended Data Fig. 2. Characterization of size distribution and morphology of exosomes from the 14 cell lines.
(a) Representative profiles of size distribution of exosomes determined by nanoparticle tracking analysis (NTA), mode of the size distribution is indicated in the figure. (b) Quantification of the mode from NTA analysis. Bar graph shows mean +/− s.e.m, individual data points refer to three biological replicates for each cell line, dashed line at 100 nm. (c) Transmission electron microscopy of exosomes from the 14 cell lines, scale bar = 100 nm, results from one-two replicates per cell type. (d) Gating strategy used for flow cytometric analysis of beads-bound exosomes throughout the manuscript.
Extended Data Fig. 3
Extended Data Fig. 3. Evaluation of specificity of FACS-based beads assay using cells silenced for tetraspanins.
a) Expression of CD9, CD63 and CD81 in shRNA-silenced cells compared to shRNA control cells. Results normalized to 18S. Bar graphs show mean +/− s.e.m. of fold-change, individual data points from three biological replicates. Statistical analysis was performed on the delta CT values by two-tailed unpaired t-test, and the exact p-values are shown. Statistical significance defined as p < 0.05. (b) Quantification of the mode of exosomes from NTA analysis. Bar graph shows mean +/− s.e.m, individual data points refer to three biological replicates. (c) Representative profiles of size distribution of exosomes form U87 cells shRNA control, shRNA CD9, shRNA CD63 and shRNA CD81, determined by NTA. (d) Representative histograms show the profile of the CD9, CD63 and CD81 in comparison to isotype control-stained beads for shRNA control, shRNA CD9, shRNA CD63 and shRNA CD81 exosomes. Bar graphs show mean +/− s.e.m of MFI, individual data points from three biological replicates. Statistical significance was determined by two-tailed unpaired t-test, and the exact p-values are shown. Statistical significance defined as p < 0.05.
Extended Data Fig. 4
Extended Data Fig. 4. Expression levels of CD9, CD63 and CD81 in parental cells.
Expression of each tetraspanin was assessed using two distinct primer pairs (1 and 2), and using 18S for normalization. Bar graphs show mean +/− s.e.m. of 1/delta CT, individual data points from three biological replicates.
Extended Data Fig. 5
Extended Data Fig. 5. Distribution of SILAC ratios of MS samples from the 14 cell lines-derived exosomes.
Histograms show distribution of Log2 ratios toward the Super-SILAC standard. Results from three biological replicates per cell line are shown.
Extended Data Fig. 6
Extended Data Fig. 6. Intensity-based ranking of candidates to exosomal biomarkers.
The 3,759 unambiguously quantified proteins in exosomes from the 14 cell lines are ranked based on their summed light and heavy intensity. The 28 candidates to exosomal biomarkers are highlighted in the scatter plots and listed in the tables in their respective positions in the intensity ranking. Proteins in the range of 5% most intense are highlighted in red.
Extended Data Fig. 7
Extended Data Fig. 7. Validation of DG and SEC isolation methods.
(a) Western blot of Flotillin-1 in the 12 fractions (F1-F12) of the OptiPrep gradient. Exosomes from HEK293T, MDAMB231 and PANC-1. Blots from three biological replicates are shown. (b) NTA analysis shows the nanoparticle concentration in the recovered SEC fractions (F7-F25). Bar graph shows mean +/− s.e.m. of nanoparticles per ml, individual data points from three biological replicates. (c) Western blotting of Flotillin-1 in exosome-rich and exosome-depleted pooled SEC fractions. Blots from three biological replicates.
Extended Data Fig. 8
Extended Data Fig. 8. Distribution of SILAC ratios of MS samples from different isolation methods.
Histograms show distribution of ratios toward the Super-SILAC standard of HEK293T, MDAMB231 and PANC-1 samples. Results from three biological replicates for the three isolation methods are shown [density gradient (DG) left, size-exclusion chromatography (SEC) middle, and ultracentrifugation (UC) right].
Extended Data Fig. 9
Extended Data Fig. 9. A cohort of 93 ubiquitous exosomal proteins identified by MS.
(a) Venn diagram shows overlap of proteins quantified by Super-SILAC in all 14 cell lines with proteins quantified by the 3 isolation methods in our study. (b) Venn diagram shows overlap between proteins quantified in all 14 cell lines and validated by the 3 isolation methods with the proteins annotated in ExoCarta. (c) Heatmap shows the protein levels of the 93 newly identified exosomal proteins in our datasets. Protein abundance is expressed as Log2 SILAC ratios (Exosomes/Super-SILAC standard). (d) STRING-based PPI network of the 93 newly identified exosomal proteins. (e) Enriched Gene Ontology Cellular Compartment (GOCC), Molecular Function (GOMF) and Biological Process (GOBP) in the cohort of 93 newly identified exosomal proteins. Results from three biological replicates.
Extended Data Fig. 10
Extended Data Fig. 10. Analysis of ubiquitous and abundant exosomal proteins using different approaches.
(a) Western blot analysis of ITGB1, LGALS3BP, SLC3A2, Alix, CD47 and TSG101 in UC-isolated exosomes from HEK293T cells. Results from one biological replicate. (b) Western blot analysis of ITGB1 in exosomes from the OptiPrep fractions of HEK293T, MDAMB231 and PANC-1. Results from one biological replicate. (c) Western blot analysis of ITGB1 in exosomes from the exosome-rich and exosome-depleted SEC fractions, from HEK293T, MDAMB231 and PANC-1. Representative results from three biological replicates. (d) Representative histograms show CD47 and ITGB1 levels in comparison to isotype control-stained beads in HEK293T, MDAMB231 and PANC-1-derived exosomes. Bar graph shows mean +/− s.e.m. of percentage of positive beads, individual data points from three biological replicates. (e) Representative histograms show the profile of the CD47 and ITGB1 levels in comparison to isotype control-stained exosomes from human plasma. Bar graph shows MFI +/− s.e.m, and individual data points refer to ten donors. Statistical significance was determined using two-tailed unpaired Mann Whitney t-test, and the exact p-values are shown. Significance defined as p < 0.05. (f) Gating strategy used for the FACS-based single particle analysis of exosomes. (g) Representative histograms show Syntenin-1 and CD63 positivity in non-permeabilized and permeabilized exosomes, in comparison to isotype control stained beads-bound exosomes.
Figure 1:
Figure 1:. Commonly used exosome biomarkers are heterogeneous and not universally present in exosomes from different cell lines.
(a) Workflow of FACS-based analysis of beads-bound exosomes. (b) Representative histograms show the profile of the CD9, CD63 and CD81 in comparison to isotype control-stained beads for the 14 cell lines-derived exosomes. (c) Heatmap shows the quantification of exosomal CD9, CD63 and CD81, expressed and percentage of positive beads. Results from three biological replicates.
Figure 2:
Figure 2:. Super-SILAC-based proteomics identifies the core proteome of exosomes.
(a) Workflow of Super-SILAC-based MS of exosomes used in our study. (b) Number of proteins quantified in exosomes from the 14 cell lines. Bar graph shows mean +/− s.e.m., individual data points from three biological replicates are shown and the number of unique proteins to each cell line-derived exosomes are indicated in blue. (c) Occurrence analysis of proteins quantified in the 14 cell lines. (d) STRING-based PPI network of the 1,243 ubiquitous proteins in exosomes of the 14 cell lines. (e) Enriched Gene Ontology Cellular Compartment (GOCC), Molecular Function (GOMF) and Biological Process (GOBP) in the cohort of 1,243 ubiquitous exosomal proteins. (f) Venn diagram shows overlap between the ubiquitous proteins in the 14 cell lines-derived exosomes of our study with human proteins annotated in ExoCarta. MS results from three biological replicates.
Figure 3:
Figure 3:. Unbiased quantitative analysis of the core proteome of exosomes identifies putative universal biomarkers and exclusion proteins of identification in exosomes.
(a) Heatmap shows the candidates for exosomal biomarkers. Ubiquitous and abundant exosomal proteins hierarchically categorized into Class I to VI based on their measured abundance. (b) Heatmap shows the abundance of frequently used exosomal markers in the 14 cell lines. (c) Heatmap shows the exclusion marker Calnexin in exosomes from the 14 cell lines, and the proposed candidates for exclusion markers identified in our study. Protein abundance is expressed as Log2 SILAC ratios (Exosome/Super-SILAC standard) and the individual quantification values are depicted in the heatmaps. Results from three biological replicates.
Figure 4:
Figure 4:. Super-SILAC-based MS of exosomes purified using 3 different exosome isolation methods.
(a) Scheme of experimental design of the three isolation methods: OptiPrep-based density gradient (DG), size exclusion chromatography (SEC) and ultracentrifugation (UC). (b) Number of quantified proteins by MS in exosomes from HEK293T, MDAMB231 and PANC-1 purified by the different isolation methods. Bar graph shows mean +/− s.e.m., individual data points from three biological replicates. (c) Occurrence analysis of quantified proteins in the three isolation methods and three cell lines. (d) Venn diagrams show overlap of proteins quantified by the three isolation methods in each cell line. (e) Principal component analysis. Results from three biological replicates.
Figure 5:
Figure 5:. Candidates for exosomal inclusion biomarkers and exclusion biomarkers validated by different isolation methods.
(a) Heatmap shows the validated exosomal markers and exclusion markers candidates in exosomes purified by the three isolation methods in the three cell lines analyzed. Protein abundance is expressed as Log2 SILAC ratios (Exosome/Super-SILAC standard) and the individual quantification values are depicted in the heatmaps. Results from three biological replicates. (b) STRING-based PPI network of the 22 ubiquitous and abundant exosomal proteins. (c) Enriched Gene Ontology Cellular Compartment (GOCC), Molecular Function (GOMF), Biological Process (GOBP), KEGG, Pfam and InterPro categories in the 22 exosomal marker candidates. (d) Enriched Gene Ontology Molecular Function (GOMF), Pfam and InterPro categories in the cohort of low abundant exosomal proteins. (e) Representation of the putative exosomal markers identified in our study. (f) Representation of the putative exclusion markers identified in our study.
Figure 6:
Figure 6:. Syntenin-1 is the most abundant protein in exosomes and identified in exosomes from different species and biofluids.
(a) Syntenin-1 abundance in exosomes from the 14 cell lines determined by MS. Bar graph shows mean +/− s.e.m., individual data points from three biological replicates. (b) Western blot analysis of Syntenin-1 and β-actin in whole cell lysates and exosomes isolated from the 14 cell lines. Representative blot from two biological replicates. (c) Syntenin-1 abundance in exosomes from HEK293T, MDAMB231 and PANC-1 purified by density gradient (DG), size-exclusion chromatography (SEC) and ultracentrifugation (UC), determined by MS. Bar graph shows mean +/− s.e.m., individual data points from three biological replicates. (d) Western blot analysis of Syntenin-1 in exosomes from the distinct OptiPrep fractions of HEK293T, MDAMB231 and PANC-1. Representative blots from three biological replicates. (e) Western blot analysis of Syntenin-1 in exosomes from the exosome-rich and exosome-depleted fractions of SEC, from HEK293T, MDAMB231 and PANC-1. Representative blots from three biological replicates. (f) Western blot analysis of Syntenin-1, β-actin and Alix in apoptotic EVs, MVs and exosomes from HEK293T, MDAMB231 and PANC-1. Representative results from two biological replicates. (g) Workflow of FACS-based analysis of permeabilized exosomes bound to beads for analysis of intraluminal proteins. (h) Representative histograms show the profile of the Syntenin-1 levels in comparison to isotype control-stained beads in HEK293T, MDAMB231 and PANC-1-derived exosomes. Bar graph shows mean +/− s.e.m. of percentage of positive beads, individual data points from three biological replicates. (i) Western blot analysis of Syntenin-1 in exosomes isolated from murine, bovine, equine and caprine origin. Representative results from two replicates. (j) Western blot analysis of Syntenin-1 in exosomes isolated from human plasma. Results from one hundred individuals are shown. (k) Western blot analysis of Syntenin-1 in exosomes isolated from human urine. Results from five individuals are shown. (l) Representative histograms show the profile of the Syntenin-1 levels in comparison to isotype control-stained exosomes from human plasma. Bar graph shows MFI +/− s.e.m, individual data points from ten individuals. Statistical analysis was determined using unpaired two-tailed Mann Whitney t-test, and the exact p-value is shown. Significance defined as p < 0.05.

References

    1. Colombo M, Raposo G & Thery C Biogenesis, secretion, and intercellular interactions of exosomes and other extracellular vesicles. Annu Rev Cell Dev Biol 30, 255–289 (2014). - PubMed
    1. Kalluri R The biology and function of exosomes in cancer. J Clin Invest 126, 1208–1215 (2016). - PMC - PubMed
    1. Mathieu M, Martin-Jaular L, Lavieu G & Thery C Specificities of secretion and uptake of exosomes and other extracellular vesicles for cell-to-cell communication. Nat Cell Biol 21, 9–17 (2019). - PubMed
    1. Kalluri R & LeBleu VS The biology, function, and biomedical applications of exosomes. Science 367 (2020). - PMC - PubMed
    1. Kahlert C et al. Identification of double-stranded genomic DNA spanning all chromosomes with mutated KRAS and p53 DNA in the serum exosomes of patients with pancreatic cancer. J Biol Chem 289, 3869–3875 (2014). - PMC - PubMed

Publication types

MeSH terms