. 2021 Jun;23(6):608-619.
doi: 10.1038/s41556-021-00692-z. Epub 2021 Jun 9.

Elongation factor ELOF1 drives transcription-coupled repair and prevents genome instability

Affiliations

Elongation factor ELOF1 drives transcription-coupled repair and prevents genome instability

Marit E Geijer et al. Nat Cell Biol. 2021 Jun.

Erratum in

  • Publisher Correction: Elongation factor ELOF1 drives transcription-coupled repair and prevents genome instability.
    Geijer ME, Zhou D, Selvam K, Steurer B, Mukherjee C, Evers B, Cugusi S, van Toorn M, van der Woude M, Janssens RC, Kok YP, Gong W, Raams A, Lo CSY, Lebbink JHG, Geverts B, Plummer DA, Bezstarosti K, Theil AF, Mitter R, Houtsmuller AB, Vermeulen W, Demmers JAA, Li S, van Vugt MATM, Lans H, Bernards R, Svejstrup JQ, Ray Chaudhuri A, Wyrick JJ, Marteijn JA. Geijer ME, et al. Nat Cell Biol. 2021 Jul;23(7):809. doi: 10.1038/s41556-021-00720-y. Nat Cell Biol. 2021. PMID: 34163038 Free PMC article. No abstract available.

Abstract

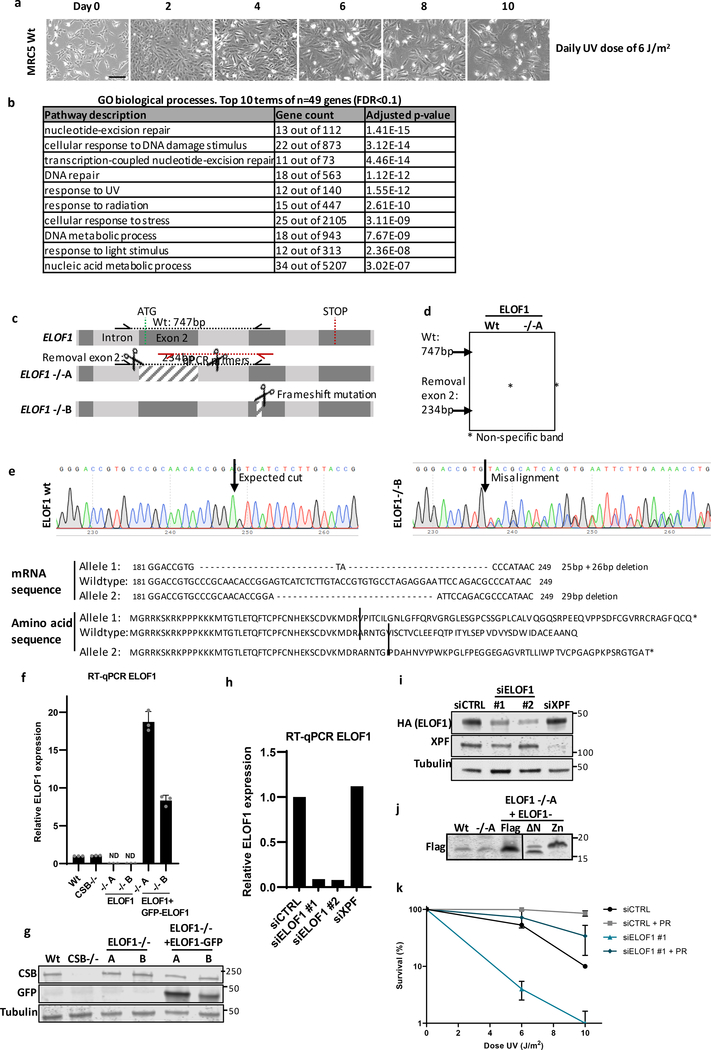
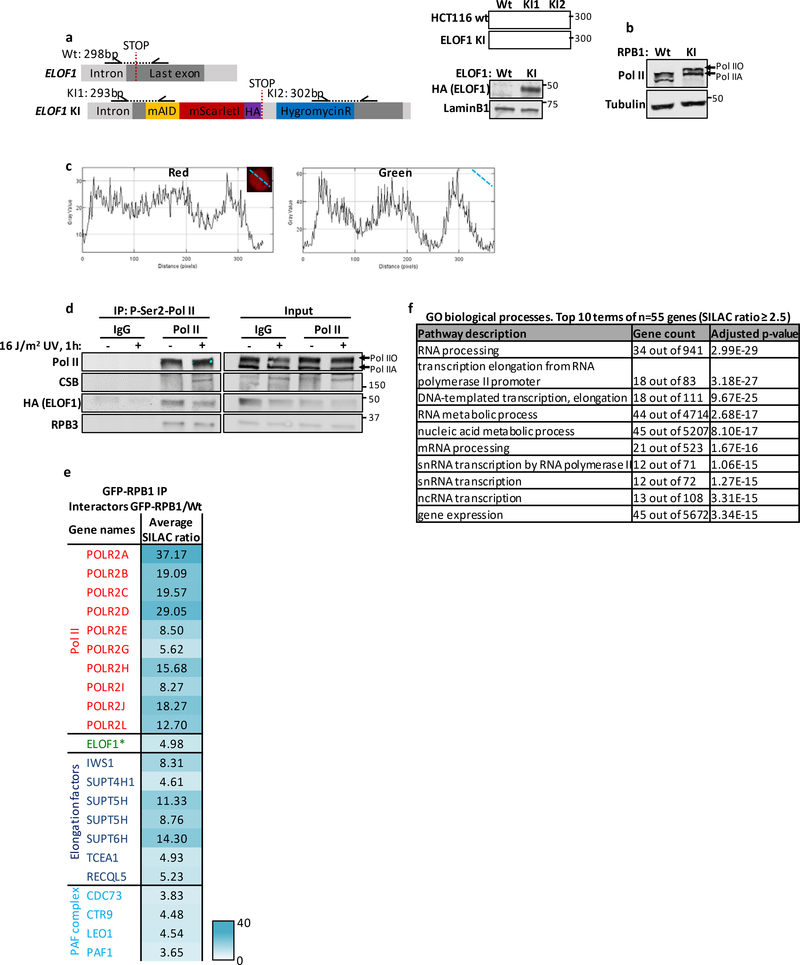
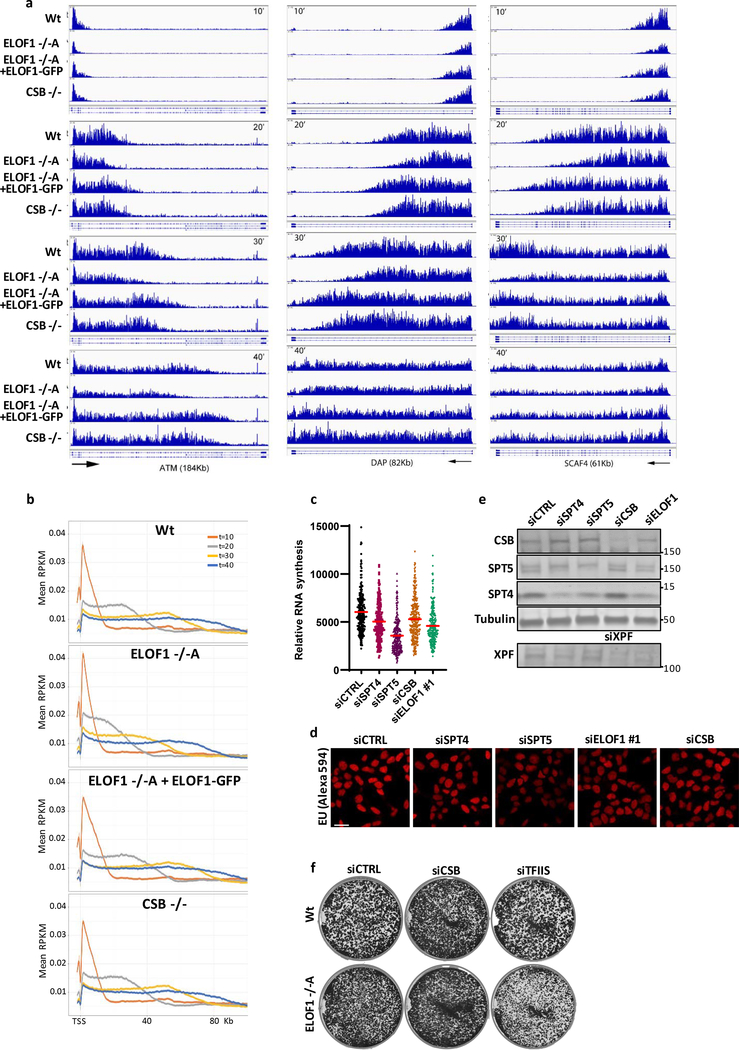
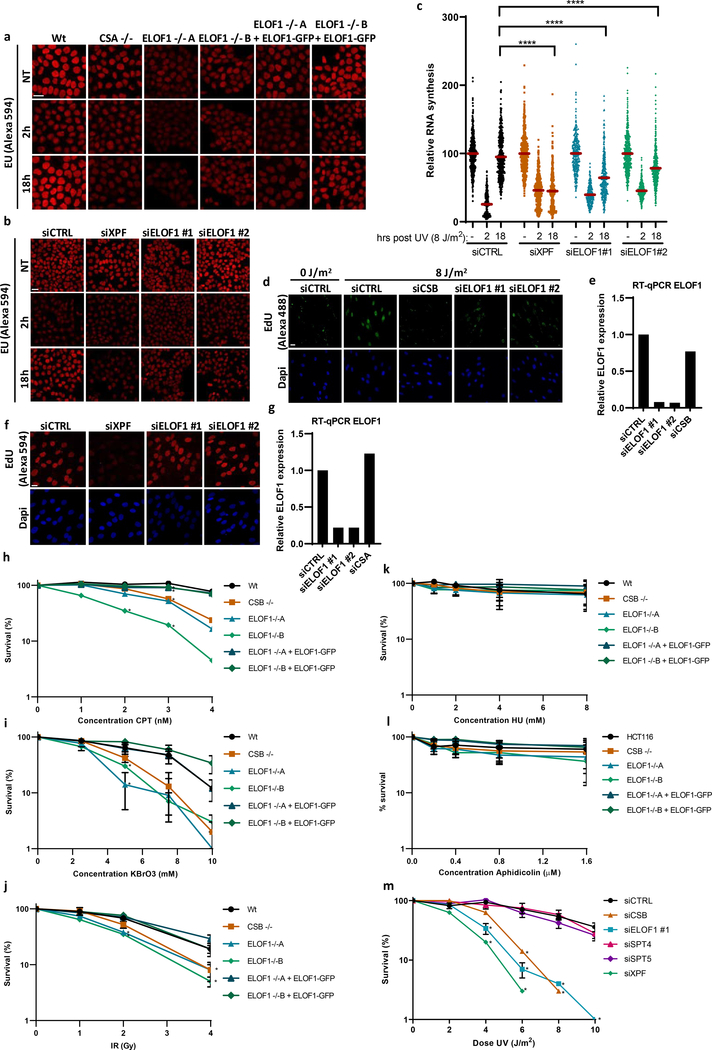
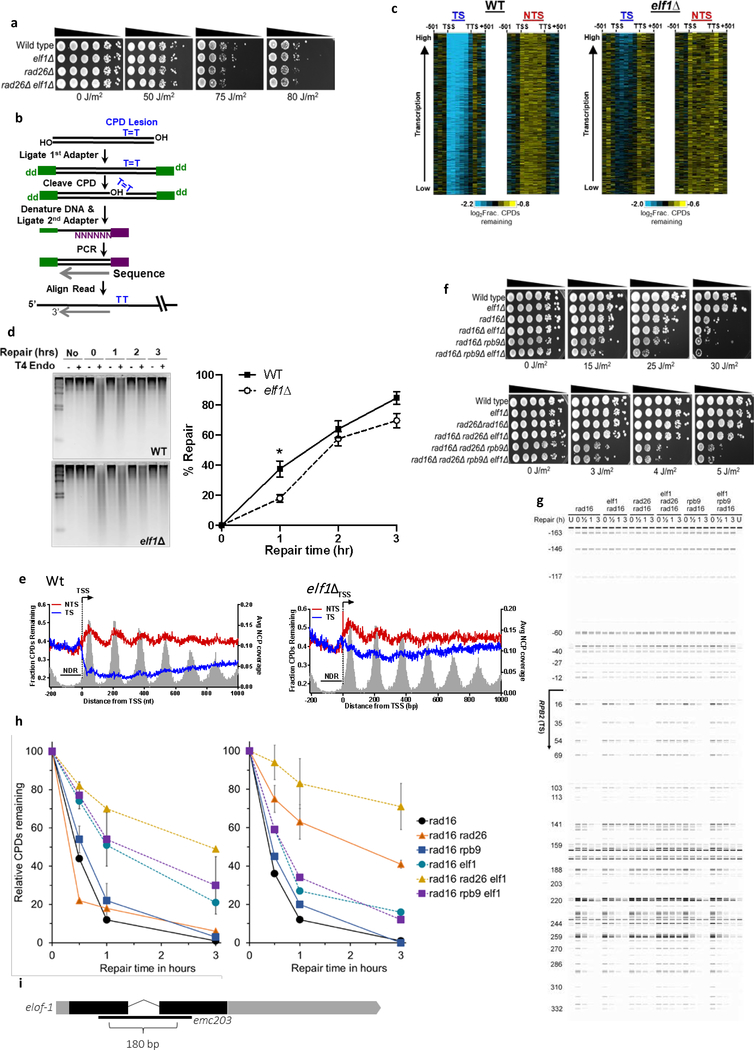
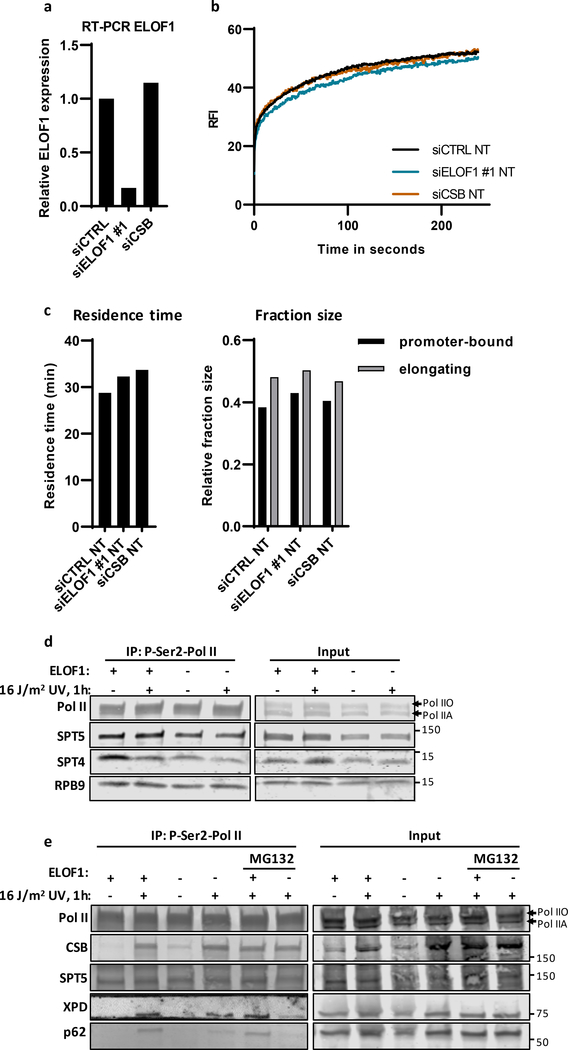
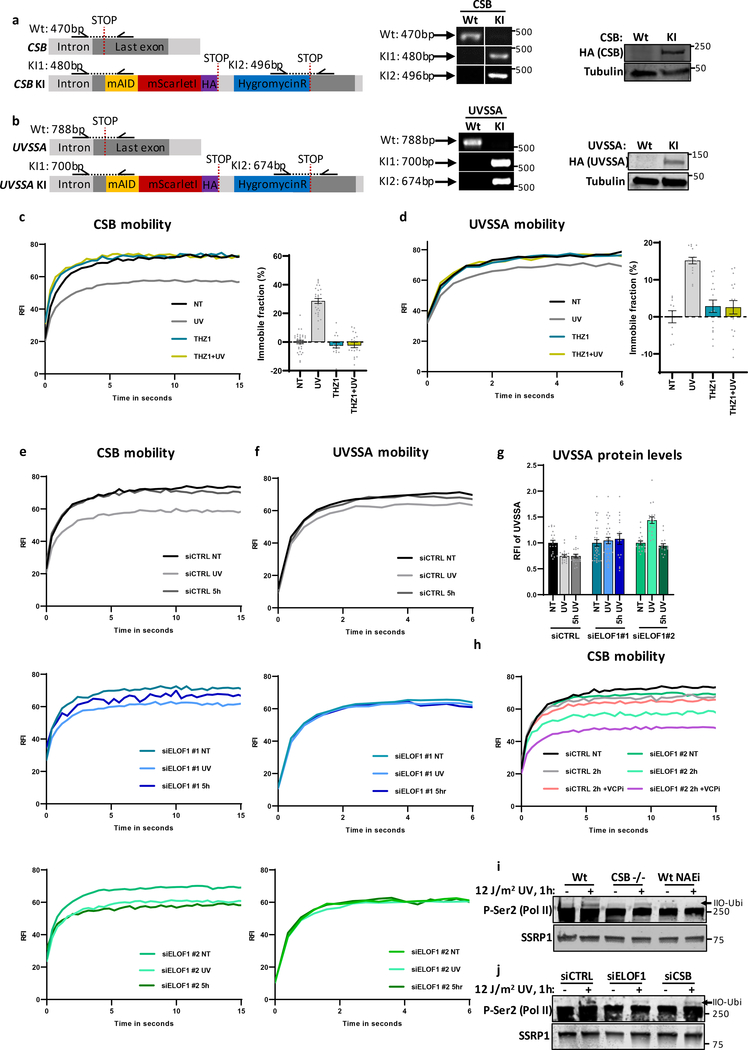
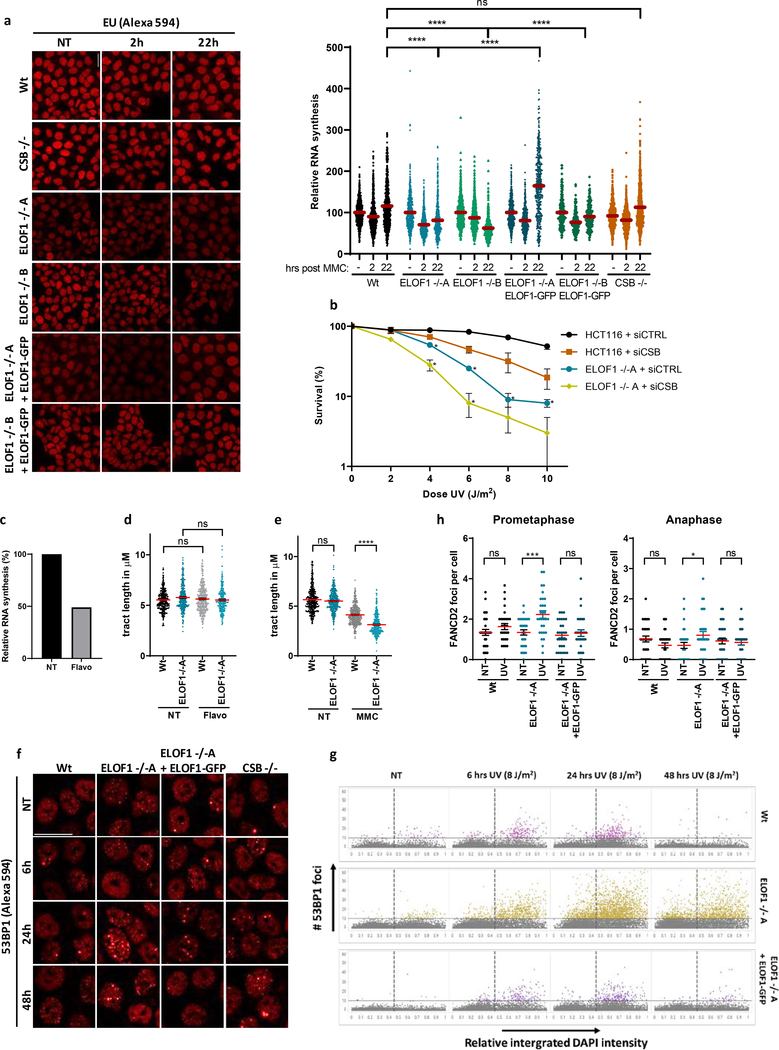
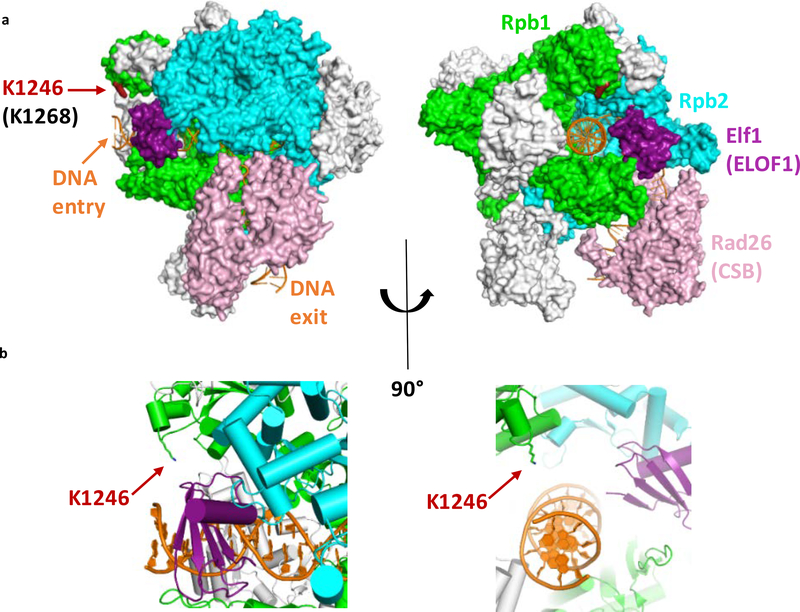
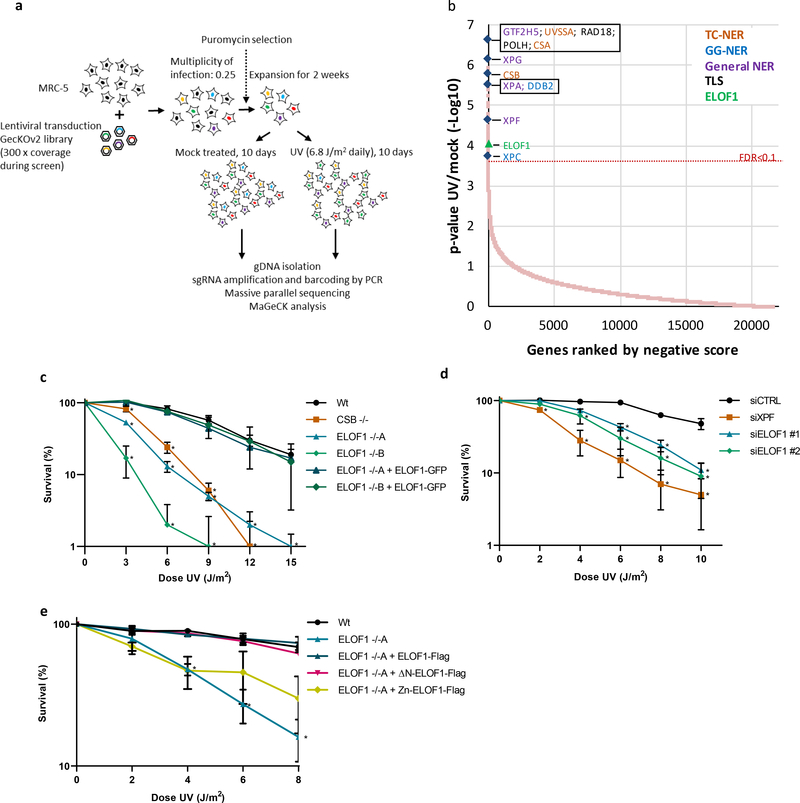
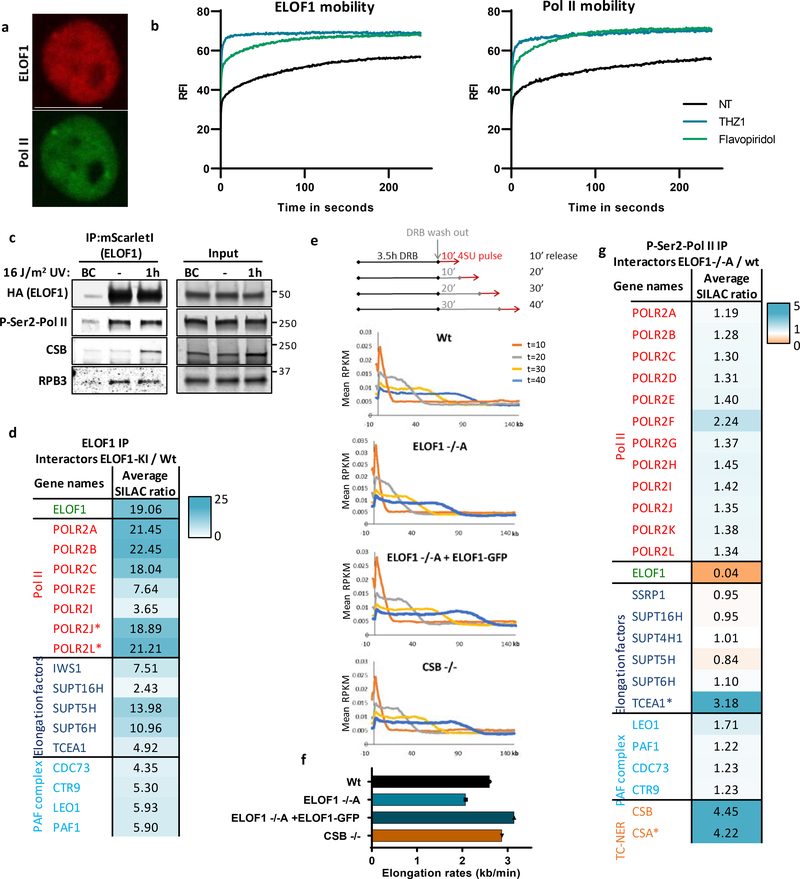
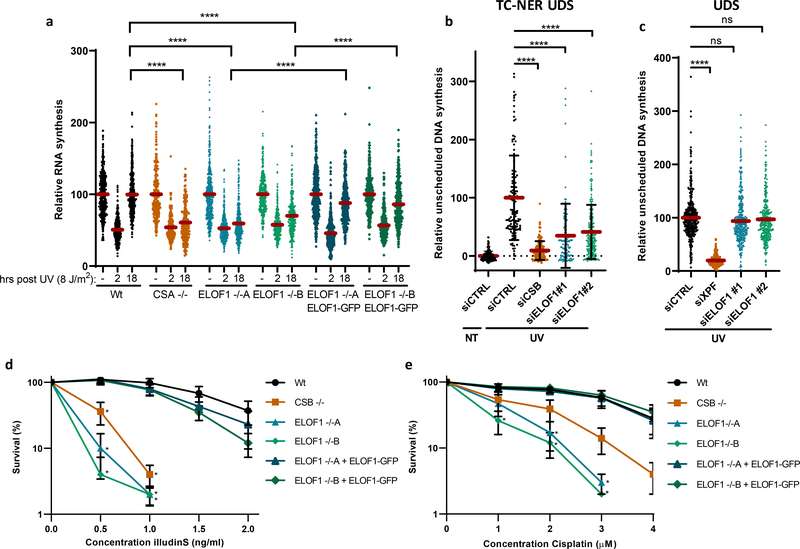
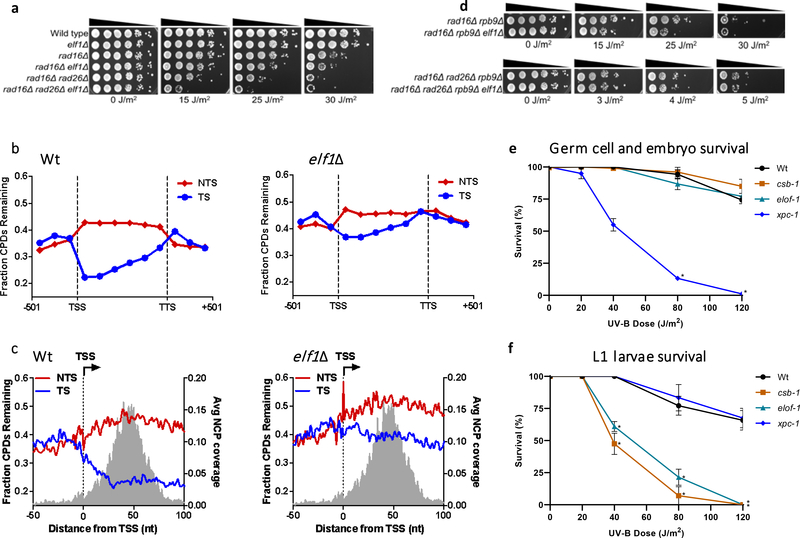
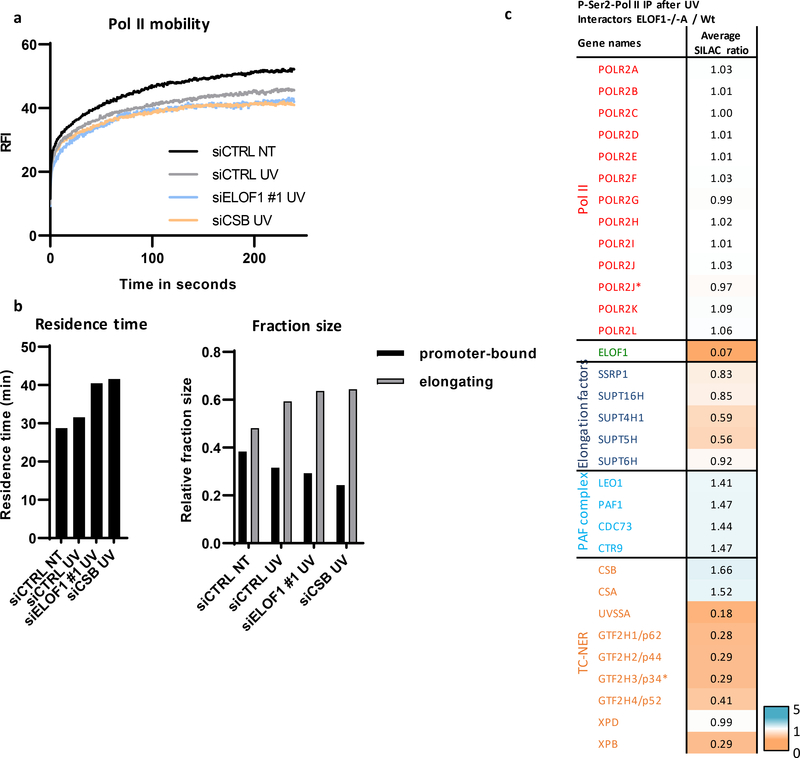
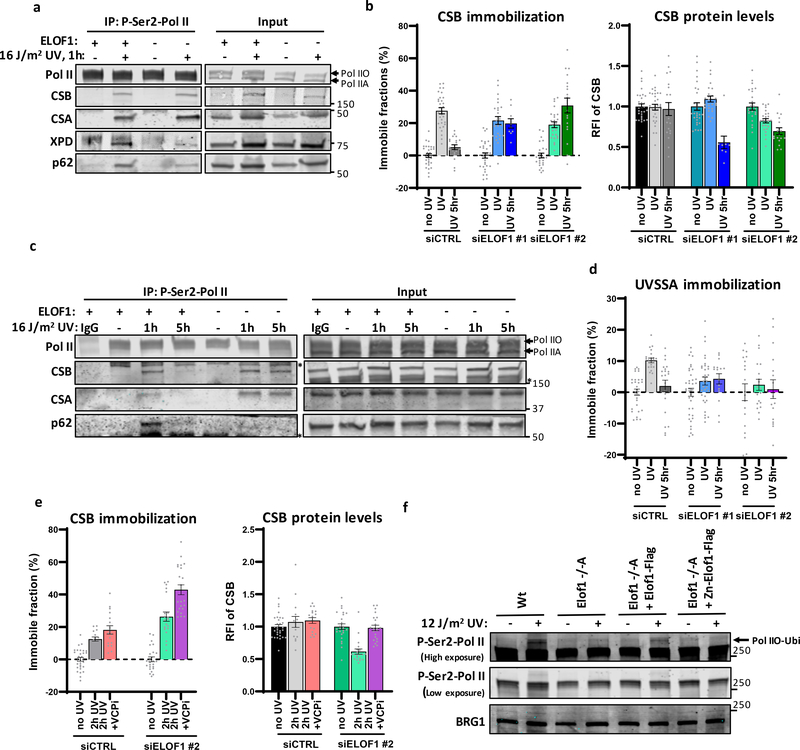
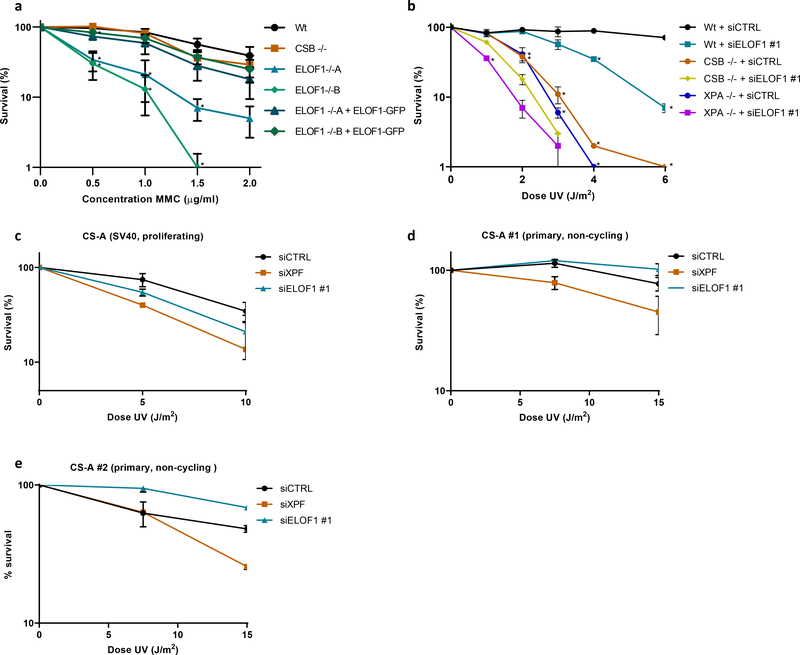
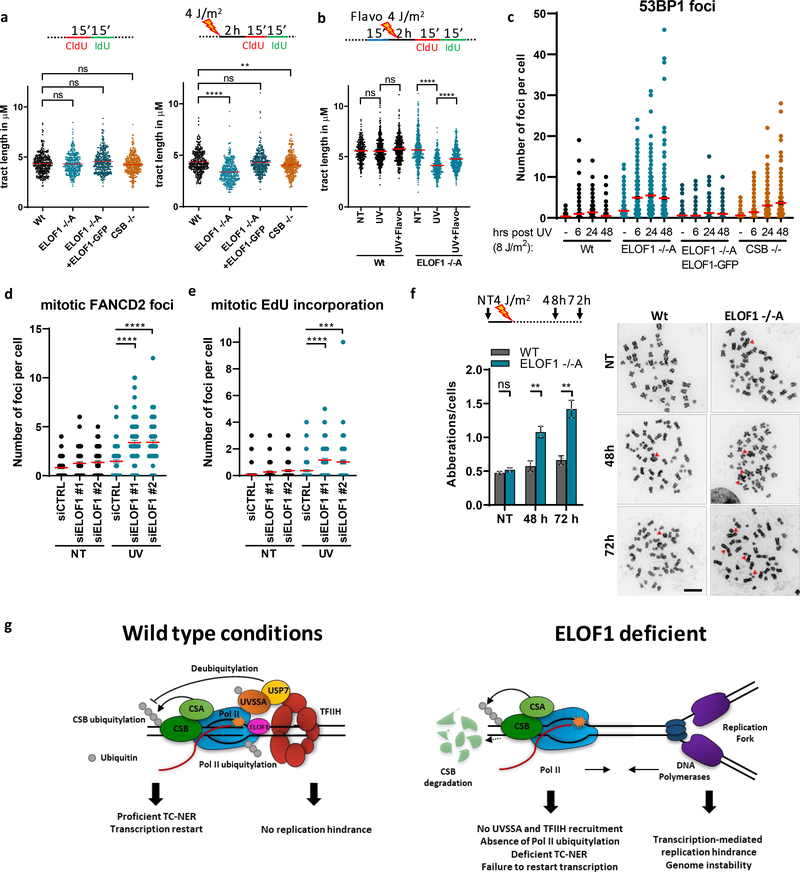
Correct transcription is crucial for life. However, DNA damage severely impedes elongating RNA polymerase II, causing transcription inhibition and transcription-replication conflicts. Cells are equipped with intricate mechanisms to counteract the severe consequence of these transcription-blocking lesions. However, the exact mechanism and factors involved remain largely unknown. Here, using a genome-wide CRISPR-Cas9 screen, we identified the elongation factor ELOF1 as an important factor in the transcription stress response following DNA damage. We show that ELOF1 has an evolutionarily conserved role in transcription-coupled nucleotide excision repair (TC-NER), where it promotes recruitment of the TC-NER factors UVSSA and TFIIH to efficiently repair transcription-blocking lesions and resume transcription. Additionally, ELOF1 modulates transcription to protect cells against transcription-mediated replication stress, thereby preserving genome stability. Thus, ELOF1 protects the transcription machinery from DNA damage via two distinct mechanisms.


Conflict of interest statement

Competing interests:

Authors declare no competing interests.

Figures

Extended data figure 1.
Extended data figure 1.. Generation of ELOF1 knock-in and out cells
(a) Brightfield images of MRC-5 cells irradiated with indicated doses of UV-C for 10 consecutive days. Images were taken every other day. Scale bar: 60 μm. (b) Top 10 enriched GO terms (biological process) identified using g:Profiler of UV-sensitive genes with FDR<0.1 (n=49). (c) Schematic of the genomic ELOF1 locus. Scissors indicate target regions of the sgRNAs used to generated ELOF1 KO (−/−) cells, half arrows indicate primers used for genotyping as shown in (c). Red arrows indicate location of the qPCR primers as shown in (e). (d+e) Genotyping of ELOF1 KO (−/−) cells, both originating from a single cell clone. (d) Genotyping PCR of loss of exon 2 in ELOF1 −/−A cells. (e) Top panel: Sequencing results showing frameshift mutations in the targeted genomic locus of ELOF1 −/−B. Bottom panel: Amino acid sequence of ELOF1 in ELOF1 −/−B cells. (f) Relative ELOF1 levels in indicated HCT116 Wt and ELOF1 KO (−/−) cells, with ELOF1 re-expression where indicated, as determined by RT-qPCR. Relative ELOF1 mRNA expression was normalized to GAPDH signal and levels in Wt cells were set to 1. ND=not detected n=3 ±SEM. (g) Immunoblot of indicated HCT116 cell lines showing CSB or ELOF1-GFP expression. Tubulin was used as loading control. (h) Relative ELOF1 levels in HCT116 cells transfected with indicated siRNAs as determined by RT-qPCR. Relative ELOF1 expression was normalized to GAPDH signal and siCTRL levels were set to 1. n=2 ±SEM. (i) Immunoblot showing endogenous ELOF1 and XPF levels in ELOF1-mScarletI-HA KI cells (Extended data fig. 2a) transfected with indicated siRNAs. Tubulin was used as loading control. (j) Immunoblot showing expression of Flag-tagged Wt or indicated ELOF1 mutants in HCT116 ELOF1 −/−A cells. (k) Relative colony survival of CPD photolyase cells transfected with indicated siRNAs. PR indicates CPD removal by photoreactivation. Plotted curves represent averages of n=2 ±SEM.
Extended data figure 2.
Extended data figure 2.. ELOF1 is part of the Pol II complex.
(a) Left panel: Schematic of the genomic locus of ELOF1 for generating ELOF1-mScarletI-HA KI cell line. Half arrows indicate primer locations. Right panel: Genotyping PCR and immunoblot for ELOF1-KI cell line (top). LaminB1 was used as loading control (bottom). (b) Immunoblot of HCT116 GFP-RPB1 KI. Tubulin was used as loading control. (c) Histograms showing intensities of GFP and mScarletI measured over the indicated dotted line in HCT116 double KI cells. (d) Native immunoprecipitation of P-Ser2-modified Pol II in HCT116 cells followed by immunoblotting for indicated proteins. Cells were harvested 1 hour after mock treated or irradiation with 16 J/m2 UV-C. IgG was used as binding control. (e) Interaction heat map based on the SILAC ratios of MRC-5 GFP-RPB1-interacting proteins as determined by quantitative interaction proteomics. Average SILAC ratios of duplicate experiments are plotted and represent RPB1-interactors relative to empty beads. SILAC ratio >1 indicates increase in interaction. * indicates proteins quantified in one experiment. (f) Top 10 enriched GO terms (biological processes) identified using g:Profiler of 55 proteins identified as ELOF1 interactor with an average SILAC ratio of 2.5 or higher.
Extended data figure 3.
Extended data figure 3.. ELOF1 stimulates transcription elongation.
(a) Browser tracks from DRB/TTchem-seq experiment at ATM, DAP and SCAF4. Results are shown 10, 20, 30 or 40 minutes after DRB release. (b) Metagene profiles of DRB/TTchem-seq in HCT116 Wt or indicated KO (−/−) cells, with ELOF1 re-expression where indicated, 10, 20, 30, or 40 minutes after DRB release for 50–100Kb long genes. (c) Transcription levels as determined by relative EU incorporation in HCT116 cells transfected with indicated siRNAs. Red lines indicate average integrated density ± SEM. siCTRL n=247, siSPT4 n=272, siSPT5 n=288, siCSB n=286, siELOF1 #1 n=285. (d) Representative images of EU incorporation in HCT116 cells transfected with indicated siRNAs. Scale bar: 20 μm. (e) Immunoblot for indicated proteins in HCT116 cells transfected with indicated siRNAs. Tubulin was used as loading control. (f) Images of HCT116 Wt and ELOF1 −/−A cells transfected with indicated siRNAs, stained with coomassie blue 10 days after transfection.
Extended data figure 4.
Extended data figure 4.. Role of ELOF1 during TC-NER and protection against different DNA damaging agents.
(a+b) Representative immunofluorescence images of EU incorporation in (a) indicated HCT116 cells, or (b) HCT116 cells transfected with indicated siRNAs, 2 or 18 hours after 8 J/m2 UV-C or mock treatment (NT). Scale bar: 20 μm. (c) Transcription restart after UV damage as determined by relative EU incorporation in HCT116 cells transfected with indicated siRNAs, 2 or 18 hours after 8 J/m2 UV-C or mock treatment (NT). Relative integrated density of UV-irradiated samples are normalized to mock-treated and set to 100%. Red lines indicate average integrated density ± SEM from three independent experiments of, respectively n=492, 485, 435, 487, 461, 395, 352, 399, 380, 644, 575, 512 cells. (d) Representative immunofluorescence images of amplified EdU signal in XP186LV fibroblasts (XP-C) transfected with indicated siRNAs, 7 hours after exposure to 8 J/m2 UV-C. Scale bar: 20 μm. (e) Relative ELOF1 mRNA levels in XP186LV fibroblasts (XP-C) following transfection with indicated siRNAs determined by RT-qPCR. ELOF1 expression was normalized to GAPDH expression and siCTRL levels were set to 1. n=2±SEM. (f) Representative fluorescence images of EdU incorporation 3 hours after irradiation with 16 J/m2 UV-C in C5RO (hTert) cells transfected with indicated siRNAs. Scale bar: 20 μm. (g) as in (f) in C5RO (hTert) cells n=2±SEM. (h-k) Relative colony survival of indicated HCT116 Wt and KO (−/−) cells, with ELOF1 re-expression where indicated, continuously exposed to indicated concentrations of (h) camptothecin (CPT) or (i) potassium bromate (KBrO3), or irradiated with indicated doses of (j) ionizing radiation (IR), or exposed to indicated concentrations of (k) hydroxyurea (HU) or (l) aphidicolin. Plotted curves represent averages ± SEM. CPT: n=2; KBrO3: n=3; IR: n=5; HU: n=3, others n=4. (m) Relative colony survival of HCT116 cells transfected with indicated siRNAs following exposure to indicated doses of UV-C. Plotted curves represent averages ± SEM. siCTRL, siSPT4 and siSPT5 n=4, siELOF1 #1, siCSB, siXPF n=2. *P≤0.05, ****p≤0.0001 analyzed by two-sided unpaired T-test in (c) and one-sided unpaired T-test in (h-m).
Extended data figure 5.
Extended data figure 5.. Role of yeast elf1 in TC-NER.
(a) Indicated mutant yeast strains were serially 10-fold diluted, spotted, and exposed to indicated UV-C doses. (b) Schematic showing the CPD-seq method. Isolated DNA is sonicated and adaptors are ligated. CPDs are cleaved by T4 endonuclease V and APE1 nuclease to generate 3’ ends. Following denaturing of the DNA, ends are ligated to a second adaptor that allows CPD sequencing. (c) Gene plot analysis of CPD-seq data for ~4500 yeast genes, ordered by transcription frequency. Plots depict unrepaired CPDs following 2-hour repair relative to no repair for both the transcribed strand (TS) and non-transcribed strand (NTS). Each row represents approximately 10 genes. TSS=transcription start site, TTS=transcription termination site. (d) Left panel: Representative gel of bulk repair of UV-induced CPD lesions in Wt and elf1Δ mutant yeast measured by T4 endonuclease V digestion and alkaline gel electrophoresis of genomic DNA isolated from UV-irradiated yeast (100 J/m2 UV-C light) after the indicated time. Right panel: Quantification of CPD repair from n=3 WT and n=4 elf1Δ experiments ±SEM. *P≤0.05 analyzed by unpaired two-sided t-test. (e) Single nucleotide resolution analysis of CPD-seq data downstream of the TSS of ~5200 yeast genes. Plots depict fraction of unrepaired CPDs following 2-hour repair relative to no repair for both TS and NTS. Nucleosome positioning data is shown for reference. (f) Controls for UV spotting assays shown in Fig. 4d. (g) Image showing repair of CPDs in the TS of the RPB2 gene for indicated yeast strains. The image was generated by converting sequencing reads aligned to RPB2 into bands. U: unirradiated cells. Nucleotide positions relative to TSS (+1) are indicated on the left. (h) Left: Relative percentage of CPDs remaining within 54 bp downstream of the TSS of the RPB2 gene. Right: Relative percentage of CPDs remaining in the downstream region (69–353 bp) of the RPB2 gene. Data are presented as mean values ±SD, error bars are shown for most relevant strains. (i) Representation of the C. elegans elof-1 genomic organization, depicting the 180 bp emc203 deletion allele generated with CRISPR/Cas9. Shaded boxes: exons, black: coding sequences.
Extended data figure 6.
Extended data figure 6.. Effects of ELOF1 deficiency on elongating Pol II elongation speed and complex composition.
(a) Relative ELOF1 mRNA levels in GFP-RPB1 KI cells transfected with indicated siRNAs as determined by RT-qPCR. ELOF1 expression was normalized to GAPDH signal and levels of control cells were set to 1. n=2, error bars indicate SEM. (b) FRAP analysis of GFP-RPB1 mobility after depletion of indicated factors. Mock-treated curves corresponding to figure 4A. siCTRL n=28, siELOF1 #1 n=20, siCSB NT n=14. (c) Left panel: Residence time of elongating Pol II or right panel: relative fraction size of promoter-bound or elongating Pol II as determined by Monte-Carlo-based modeling of RPB1 mobility as shown in (a). (d) Native immunoprecipitation of Pol II in Wt and ELOF −/−A cells followed by immunoblotting for indicated proteins. Cells were harvested 1 hour after mock treatment or irradiation with 16 J/m2 UV-C. MG132: treatment with 50 μM proteasome inhibitor MG132, 1 hour before UV irradiation. (e) Native immunoprecipitation of Pol II in Wt and ELOF −/−A cells followed by immunoblotting for indicated proteins. Cells were harvested 1 hour after mock treatment or irradiation with 16 J/m2 UV-C.
Extended data figure 7.
Extended data figure 7.. ELOF1 KO impairs recruitment of UVSSA but not CSB.
(a) Left panel: Schematic of the genomic locus of CSB and used strategy for generating the homozygous CSB-mScarletI-HA KI cell line. Half arrows indicate primer locations. Middle and right panel: Genotyping PCR and immunoblot for CSB-KI cell line. (b) Left panel: Schematic of the genomic locus of UVSSA and used strategy for generating the homozygous UVSSA- mScarletI-HA KI cell line. Half arrows indicate primer locations. Middle and right panel: Genotyping PCR and immunoblot for UVSSA-KI cell line. (c) Left panel: CSB mobility was determined by FRAP analysis of CSB-mScarletI after the indicated treatments. THZ1: 1 hour treatment (2 μM) before UV-C irradiation (4 J/m2) or mock treatment. Right panel: Relative immobile fraction of CSB as determined by FRAP analysis. Plotted values represent mean ± SEM and are normalized to mock treated. NT n=32; UV n=28; THZ1 n=15; THZ1+UV n=18. (d) Same as C but for UVSSA-mScarletI. NT n=10; UV n=16; THZ1 n=16; THZ1+UV n=17. (e+f) FRAP analyses of CSB-mScarletI (e) or UVSSA-mScarletI (f) mobility after transfection with indicated siRNAs in individual graphs. Cells were mock treated (NT) or analyzed directly (UV) or 5 hours (5hr UV) after irradiation with 4 J/m2 UV-C. (g) Relative fluorescence intensity of UVSSA in UVSSA-KI cells transfected with indicated siRNAs as determined by live-cell imaging. Plotted values represent mean ± SEM. siCTRL NT n=30, UV+5h UV n=21; siELOF1 #1 NT n=38, UV n=34, 5h UV n=16; siELOF1 #2 NT+UV n=19, 5h UV n=16. (h) FRAP analysis of CSB in CSB-KI cells transfected with indicated siRNAs 2 hours after UV. VCPi: VCP inhibitor (5 μM) was directly added after UV-C (4 J/m2). (i) Immunoblot of chromatin fraction of indicated cell lines 1 hour after 12 J/m2 UV-C or mock treatment. NAEi = 1 hour treatment with NEDDylation inhibitor (10 μM). SSRP1 is shown as loading control. (j) Immunoblot of chromatin fraction of HCT116 cells transfected with indicated siRNAs 1 hour after 12 J/m2 UV-C or mock treatment. SSRP1 is shown as loading control.
Extended data figure 8.
Extended data figure 8.. The additional role of ELOF1 in preventing transcription-mediated replication hindrance.
(a) Left panel: Representative immunofluorescence images of EU incorporation in indicated HCT116 cells, untreated, or 2 or 22 hours after a 2-hour exposure to 10 μg/ml mitomycin C. Scale bar: 20 μm. Right panel: Transcription restart after mitomycin C as determined by relative EU incorporation in the indicated HCT116 cells. Mitomycin C-treated samples are normalized to mock treated levels and set to 100%. Red lines indicate average integrated density ± SEM from four independent experiments of, respectively, n=1008, 1008, 727, 938, 960, 715, 1133, 1162, 784, 884, 616, 461, 978, 1013, 693, 221, 220, 206 cells. (b) Relative colony survival of indicated cell lines with siRNA transfection following exposure to indicated doses of UV-C. Plotted curves represent averages ± SEM, n=3. (c) Percentage of RNA synthesis in untreated HCT116 cells and cells treated with 0.1 μM flavopiridol for 2 hours as determined by FACS-based quantification of EU pulse labeling. (d) Fork progression measured by tract lengths of CldU (red) in μm is depicted for indicated HCT116 cells, untreated or after 15 minutes 0.1 μM flavopiridol treatment. Tracts from two independent experiments, of, respectively n=300, 300, 304. (e) As (d) but after treatment for 1 hour with 25 nM MMC. Tracts from two independent experiments of, respectively n=406, 422, 408, 406 cells. (f) Representative immunofluorescence images of 53BP1 foci in indicated HCT116 cells, untreated or 6, 24 or 48 hours after exposure to 8 J/m2 UV-C. Scale bar: 20 μm. (g) Number of 53BP1 foci as determined in (f) quantified by Cellprofiler and plotted against normalized integrated intensity of DAPI, respectively, n=10494, 7870, 13916, 16647, 9539, 8313, 8610, 8817, 11253, 10950, 10314, 10494 cells. (h) Number of FANCD2 foci per mitosis in prometaphase (left) or anaphase (right) in indicated HCT116 cells in untreated conditions or 48 hours after 4J/m2 UV-C. n=90 for all conditions, from 3 independent experiments. *p≤0.05, ***p≤0.001, ****p≤0.0001 analyzed by two-sided unpaired T-test (a), one-sided unpaired T-test (b), Kruskal-Wallis test for multiple comparisons (d,e), and two-sided unpaired t-test (Mann-Whitney) (h).
Extended data figure 9.
Extended data figure 9.. Pol II-ELOF1 complex structure together with CSB.
(a) S.cerevisiae Pol II (5vvr.pdb) with Rpb1 in green, Rpb2 in cyan, DNA in orange and Rad26 (CSB) in pink. The P.pastoris Pol II in complex with elongation factors (5xog.pdb) was superimposed onto this structure (Rpb1 subunits aligned onto each other), and all subunits except Elf1 (ELOF1; purple) were omitted for clarity. Conserved lysine K1246 (K1268 in mammalian Pol II) is indicated in dark red. (b) Close up of Elf1 (ELOF1) binding region.
Figure 1.
Figure 1.. Genome-wide CRISPR/cas9 screen identifies ELOF1 as a factor involved in the UV-induced DNA damage response.
(a) Schematic of the CRISPR/cas9 screen. MRC-5 (SV40) cells were transduced with a lentiviral sgRNA library. The resulting pool of gene-edited cells was split into a control and a UV irradiated group. Cells were respectively mock-treated or daily UV-irradiated with 6.8 J/m2 UV-C for 10 consecutive days, thereby maintaining ~50% cell confluency throughout the screen (Extended data Fig.1a). sgRNA abundance was determined by next-generation sequencing of PCR-amplified incorporated sgRNAs from the isolated genomic DNA of surviving cell pools. UV-sensitive genes were identified by comparing the abundance in UV-irradiated cells over mock-treated cells using MAGeCK analysis. The screen was performed in duplicate. (b) UV-sensitive genes were ranked based on the gene-based P-value resulting from MaGecK analysis of the change in abundance of sgRNAs in UV-treated over mock-treated. Dotted line indicates FDR=0.1. Genes involved in NER or TLS are color-coded. (c) Relative colony survival of HCT116 wildtype (Wt) cells, indicated knock-out cells (−/−) or rescued cells exposed to the indicated doses of UV-C. (d) Relative colony survival of MRC-5 cells transfected with indicated siRNAs following exposure to the indicated doses of UV-C. (e) Relative colony survival of HCT116 ELOF1 KO cells with expression of the indicated ELOF1 mutants following exposure to the indicated doses of UV-C. Zn: zinc-finger mutant, ΔN: deletion of N-terminus. Data shown in c-e represent average ± SEM (n = 3 independent experiments) *P≤0.05 relative to Wt/siCTRL analyzed by one-sided unpaired T-test. Numerical data are provided in source data fig. 1.
Figure 2.
Figure 2.. ELOF1 is part of the elongating Pol II complex.
(a) Co-localization of endogenously expressed ELOF1 and Pol II in HCT116 cells with ELOF1-mScarletI-HA and GFP-RPB1 knock-in cells during live-cell imaging. Scale bar: 10 μm. Experiment has been performed 2 times with similar results. (b) Fluorescence recovery after photobleaching (FRAP) analysis of endogenously expressed ELOF1-mScarletI (Left) and GFP-RPB1 (Right). Cells were mock-treated (NT) or inhibited at different steps of the transcription cycle using indicated inhibitors. Pol II initiation was inhibited with the CDK7 inhibitor THZ1, or promoter-pause release was inhibited by the CDK9 inhibitor Flavopiridol. Relative Fluorescence Intensity (RFI) was measured over time, background-corrected, and normalized to pre-bleach fluorescence intensity. ELOF1-KI: NT n=40, THZ1 n=24, Flavopiridol n=24 and RPB1-KI: NT n=21, THZ1 n=16, Flavopiridol n=18 cells across 3 independent experiments. (c) Immunoprecipitation of ELOF1 using RFP beads in ELOF1-KI cells followed by immunoblotting for indicated proteins. Cells were harvested 1 hour after mock treatment or irradiation with 16 J/m2 UV-C. BC: binding control. Experiment has been performed 2 times with similar results. (d) Interaction heat map of the SILAC ratios of ELOF1-interacting proteins as determined by quantitative interaction proteomics following HA-IP of ELOF1. Average SILAC ratios of duplicate experiments are plotted and represent ELOF1-interactors relative to empty beads. SILAC ratio >1 indicate increase in interaction. * indicates proteins quantified in one experiment. (e) Top panel: Schematic of DRB/TTchem-seq to measure Pol II elongation rates. Bottom panel: Metagene profiles of >200 kb genes, of DRB/TTchem-seq in HCT116 Wt or indicated KO (−/−) cells, with ELOF1 re-expression where indicated, 10, 20, 30, or 40 minutes after DRB release. (f) Average elongation rates as determined by DRB/TTchem-seq for >200 kb genes. (g) Interaction heat map based on the SILAC ratios as determined by quantitative interaction proteomics of P-Ser2-modified Pol II-interacting proteins in ELOF1 −/−A cells relative to Wt cells. Average SILAC ratios of duplicate experiments are plotted. * indicates proteins quantified in one experiment. SILAC ratios <1 indicate loss of interaction, >1 indicate increase in interaction. Numerical data and uncropped blots are provided in source data fig. 2.
Figure 3.
Figure 3.. ELOF1 is important for functional TC-NER.
(a) Transcription restart after UV damage as determined by relative EU incorporation in the indicated HCT116 Wt and KO (−/−) cells, with ELOF1 re-expression where indicated, at the indicated time points after UV-C (8 J/m2). Relative integrated density normalized to mock-treated levels and set to 100%. Red lines indicate average integrated density ± SEM from three independent experiments of respectively, n=537, 528, 496, 227, 222, 203, 455, 421, 431, 458, 450, 405, 499, 495, 406, 470, 432, 446 cells. (b) TC-NER-specific UDS as determined by relative EdU incorporation in XP186LV fibroblasts (XP-C) transfected with indicated siRNAs following UV-C-irradiation (7 hours, 8 J/m2). Cells from two independent experiments. NT: siCTRL n=193; UV: siCTRL n=127, siCSB n=132, siELOF1 #1 n=108, siELOF1 #2 n=217. (c) Relative levels of EdU incorporation in C5RO (hTert) cells transfected with indicated siRNAs, following UV-C-irradiation (3 hours, 16 J/m2). Cells from three independent experiments. siCTRL n=356, siXPF n=203, siELOF1 #1 n=363, siELOF1 #2 n=348. (d+e) Relative colony survival of the indicated HCT116 Wt and KO (−/−) cells, with ELOF1 re-expression where indicated, upon a 24-hour exposure to the indicated concentrations of illudinS (d) or Cisplatin (e). IlludinS: average ± SEM (n=3 independent experiments) for all conditions except ELOF1 −/−B: n=2 independent experiments; Cisplatin: n=4 independent experiments. *p≤0.05, ****p≤0.0001, ns non-significant, two-sided unpaired T-test in (a,b,c), and one-sided unpaired T-test in (d,e). Numerical data are provided in source data fig. 3.
Figure 4.
Figure 4.. ELOF1 is an evolutionary-conserved TC-NER factor
(a) Indicated mutant yeast strains were serially 10-fold diluted, spotted, and exposed to the indicated UV-C doses. Spot assay has been performed three times with similar results. (b) CPD-seq analysis of Wt (left) and elf1Δ mutant (right) yeast showing the average fraction of unrepaired CPDs remaining on the transcribed strand (TS) and non-transcribed strand (NTS) for ~5000 yeast genes following 2-hour repair relative to no repair. Each gene was divided in 6 equally-sized bins. Repair in flanking DNA upstream of the transcription start site (TSS) and downstream of the transcription termination site (TTS) is also depicted. (c) Close-up of CPD-seq repair data near the TSS in Wt (left) and elf1Δ mutant (right) cells. Nucleosome positioning data is shown for reference. CPD-seq has been executed once. (d) Indicated mutant yeast strains were serially 10-fold diluted, spotted, and exposed to the indicated UV-C doses. Spot assay has been performed three times with similar results. (e) C. elegans germ cell and embryo UV survival assay, measuring GG-NER activity, of wild type, csb-1, xpc-1, and elof-1 animals. The percentages of hatched eggs (survival) are plotted against the applied UV-B doses. (f) L1 larvae UV survival assay, measuring TC-NER activity, of wildtype, csb-1, xpc-1 and elof-1 animals. The percentages of animals that developed beyond the L2 stage (survival) are plotted against the applied UV-B doses. In e and f, the mean survival ± SEM of n = three independent experiments each performed in quintuple is depicted. *p≤0.05, ****p≤0.0001. Numerical data are provided in source data fig. 4.
Figure 5.
Figure 5.. Prolonged stalling of Pol II at TBLs in absence of ELOF1.
(a) FRAP analysis of Pol II mobility in MRC-5 GFP-RPB1 KI cells after depletion of indicated factors in untreated cells (NT) or directly after UV induction (UV, 12 J/m2). Relative Fluorescence Intensity (RFI) was measured over time, background-corrected, and normalized to pre-bleach fluorescence intensity. siCTRL NT: n=28, siCTRL UV. n=30, siELOF1 #1 UV n=17, siCSB UV n=24 cells analyzed across four independent experiments for siCTRL and three for siELOF1 and siCSB. (b) Left panel: residence time of the elongating Pol II fraction. Right panel: relative fraction sizes of promoter-bound or elongating Pol II as determined by Monte-Carlo-based modeling based on the RPB1 mobility shown in (a). (c) Interaction heat map based on the SILAC ratios as determined by quantitative interaction proteomics of UV-specific Pol II-interacting proteins in ELOF1 −/−A cells relative to Wt cells. Average SILAC ratios of duplicate experiments are plotted. SILAC ratios <1 indicate loss of interaction, >1 indicate increase in interaction. * indicates proteins quantified in one experiment. Numerical data are provided in source data fig. 5.
Figure 6.
Figure 6.. ELOF1 is crucial for proper TC-NER complex assembly.
(a) Immunoprecipitation of P-Ser2-modified Pol II in Wt and ELOF−/−A cells followed by immunoblotting for indicated proteins. Cells were harvested 1 hour after mock treatment or irradiation with 16 J/m2 UV-C. (b) Left panel: Relative immobile fraction of CSB in CSB-mScarletI KI cells transfected with indicated siRNAs directly (UV) or 5 hours after UV-C irradiation (5h UV, 4 J/m2) as determined by FRAP analysis (Extended data fig. 7e). Right panel: Relative fluorescence intensity of CSB-mScarletI in CSB-KI cells transfected with indicated siRNAs as determined by live-cell imaging. Values represent mean ± SEM and are normalized to mock-treated. siCTRL NT+UV n=30, 5h UV n=20; siELOF1#1 NT n=30, UV n=25, 5h UV n=9; siELOF1#2 NT+UV n=25, 5h UV n=18 cells analyzed across 2 independent experiments, siELOF1#1 5hr UV was performed once (c) Immunoprecipitation of P-Ser2-modified Pol II in Wt and ELOF−/−A cells 1 or 5 hours after UV-C (16 J/m2) irradiation followed by immunoblotting for indicated proteins. IgG was used as binding control. *non-specific band. (d) Same as left panel of (b) but for UVSSA-mScarletI KI cells (Extended data fig. 7f,g). siCTRL NT n=30, UV+5h UV n=21; siELOF1#1 NT n=38, UV n=34, 5h UV n=16; siELOF1#2 NT+UV n=19, 5h UV n=16 cells analyzed across 2 independent experiments. (e) Relative immobile fraction (left panel) or relative fluorescence intensity (right panel) of CSB-mScarletI in CSB-KI cells transfected with indicated siRNAs 2 hours after UV-C irradiation (4 J/m2) as determined by FRAP analysis (Extended data fig. 7h). VCPi: treatment with VCP inhibitor. Vvalues represent mean ± SEM and are normalized to mock-treated. siCTRL: NT n=30, 2h UV n=15, 2h UV+VCPi n=17; siELOF1#2: NT n=25, 2h UV n=20, 2h UV+VCPi n=22 cells analyzed across 2 independent experiments. (f) Immunoblot of chromatin fraction of indicated HCT116 Wt or ELOF1 KO cells, with re-expression of Wt of Zinc-finger mutant ELOF1, 1 hour after 12 J/m2 UV-C or mock treatment. Loading control; BRG1. Data shown in a, c, f has been performed 2 times with similar results. Numerical data and uncropped blots are provided in source data fig. 6.
Figure 7.
Figure 7.. ELOF1 has an additional function apart from TC-NER.
(a) Relative colony survival of indicated HCT116 Wt and KO (−/−) cells, with ELOF1 re-expression where indicated, upon a 1-hour exposure to the indicated concentrations of mitomycin C. Plotted curves represent averages of n=3 independent experiments ± SEM. *P≤0.05 relative to Wt analyzed by one-sided unpaired T-test. (b) Relative colony survival of MRC-5 Wt or indicated KO (−/−) cell lines, transfected with indicated siRNAs following exposure to the indicated doses of UV. Plotted curves represent averages ± SEM. *P≤0.05 relative to Wt analyzed by one-sided unpaired T-test. Wt cells n=4 independent experiments, except for 1 and 3 J/m2 n=3 independent experiments; CSB cells n=3 independent experiments, except for 1 and 3 J/m2 n=2 independent experiments; XPA cells n=3 independent experiments. (c) Viability of replicating CS-A (SV40) or non-replicating primary (d) CS216LV (CS-A#1) or (e) CS1SP cells (CS-A#2) following exposure to the indicated UV-C doses as determined by AlamarBlue staining. Plotted curves represent averages ± SEM. SV40: siCSA n=2 independent experiments, all other conditions n=3 independent experiments. hTert, CS216LV: n=2 independent experiments for all conditions. hTert, CS1SP: n=2 for all conditions. Numerical data are provided in source data fig. 7.
Figure 8.
Figure 8.. ELOF1 is important for preventing genome instability
(a) Fork progression measured by tract lengths in μm of CldU (red) in indicated HCT116 cells, in untreated conditions (left) or 2 hours after 4 J/m2 UV-C (right). Tracts of respectively n=347, 343, 348, 341, 347, 335, 336, 339 cells collected from three independent experiments. (b) As (a) 2 hours after 4 J/m2 UV-C with or without 15 min pre-treatment with 0.1 μM flavopiridol (Flavo), of respectively n=355, 510, 506, 506, 508, 535 cells. (c) Number of 53BP1 foci in indicated HCT116 cells, untreated or at the indicated timepoints after UV-C (8 J/m2). Red lines indicate average foci number ± SEM of respectively n=344, 308, 320, 277, 292, 279, 280, 276, 279, 292, 255, 262, 330, 330, 331, 242 cells collected from two independent experiments. (d) Number of FANCD2 or (e) EdU foci per RPE-1 TP53−/− cell transfected with indicated siRNAs in untreated conditions or 48 hours after irradiation with 4 J/m2 UV-C. siCTRL NT n=89, siELOF1#1 NT n=91, others n=90 cells analyzed across 3 independent experiments. (f) Left: Chromosomal aberrations per cell in HCT116 Wt and ELOF1−/−A cells 48 or 72 hours after 4 J/m2 UV-C or mock treatment (NT). Data represent average ± SEM of n = three independent experiments. Right: Representative images of metaphase spreads. Arrows indicate chromosomal aberrations. Scale bar: 10μm (g) Model showing function of ELOF1. Left: Wild type conditions, ELOF1 is an integral part of the elongation complex and binds near the DNA entry tunnel and ubiquitylation site of Pol II to promote TC-NER and subsequent transcription restart, not resulting in replication problems. Right: in absence of ELOF1, CSA and CSB are still recruited to lesion-stalled Pol II, however, UVSSA, TFIIH, and Pol II ubiquitylation are absent, resulting in TC-NER deficiency and prolonged Pol II stalling resulting in increased transcription-mediated replication hindrance leading to genome instability. *p≤0.05, **≤0.01, *** p≤0.001, ****p≤0.0001, ns non-significant, analyzed by Kruskal-Wallis test for multiple comparisons (a,b), two-sided unpaired t-test (Mann-Whitney) (d,e) and by two-sided unpaired t-test with Welch’s correction (f). Numerical data are provided in source data fig. 8.

Comment in

  • The ELOF(1)ant in the room of TCR.
    Carnie CJ, Jackson SP. Carnie CJ, et al. Nat Cell Biol. 2021 Jun;23(6):584-586. doi: 10.1038/s41556-021-00698-7. Nat Cell Biol. 2021. PMID: 34108661 No abstract available.

References

    1. Lans H, Hoeijmakers JHJ, Vermeulen W & Marteijn JA The DNA damage response to transcription stress. Nat Rev Mol Cell Biol 20, 766–784 (2019). - PubMed
    1. Gomez-Gonzalez B & Aguilera A Transcription-mediated replication hindrance: a major driver of genome instability. Genes Dev 33, 1008–1026 (2019). - PMC - PubMed
    1. Gaillard H & Aguilera A Transcription as a Threat to Genome Integrity. Annu Rev Biochem 85, 291–317 (2016). - PubMed
    1. Laugel V Cockayne syndrome: the expanding clinical and mutational spectrum. Mech Ageing Dev 134, 161–170 (2013). - PubMed
    1. Xu J et al. Structural basis for the initiation of eukaryotic transcription-coupled DNA repair. Nature 551, 653–657 (2017). - PMC - PubMed

Online methods References:

    1. Weiner A et al. High-Resolution Chromatin Dynamics during a Yeast Stress Response. Molecular Cell 58, 371–386 (2015). - PMC - PubMed
    1. Campeau E et al. A Versatile Viral System for Expression and Depletion of Proteins in Mammalian Cells. PLOS ONE 4, e6529 (2009). - PMC - PubMed
    1. Yesbolatova A, Natsume T, Hayashi K. i. & Kanemaki MT Generation of conditional auxin-inducible degron (AID) cells and tight control of degron-fused proteins using the degradation inhibitor auxinole. Methods 164–165, 73–80 (2019). - PubMed
    1. Natsume T, Kiyomitsu T, Saga Y & Kanemaki MT Rapid Protein Depletion in Human Cells by Auxin-Inducible Degron Tagging with Short Homology Donors. Cell Rep 15, 210–218 (2016). - PubMed
    1. Brinkman EK, Chen T, Amendola M & van Steensel B Easy quantitative assessment of genome editing by sequence trace decomposition. Nucleic acids research 42, e168–e168 (2014). - PMC - PubMed

Publication types