. 2021 Jun;23(6):595-607.
doi: 10.1038/s41556-021-00688-9. Epub 2021 Jun 9.

ELOF1 is a transcription-coupled DNA repair factor that directs RNA polymerase II ubiquitylation

Affiliations

ELOF1 is a transcription-coupled DNA repair factor that directs RNA polymerase II ubiquitylation

Yana van der Weegen et al. Nat Cell Biol. 2021 Jun.

Abstract

Cells employ transcription-coupled repair (TCR) to eliminate transcription-blocking DNA lesions. DNA damage-induced binding of the TCR-specific repair factor CSB to RNA polymerase II (RNAPII) triggers RNAPII ubiquitylation of a single lysine (K1268) by the CRL4CSA ubiquitin ligase. How CRL4CSA is specifically directed towards K1268 is unknown. Here, we identify ELOF1 as the missing link that facilitates RNAPII ubiquitylation, a key signal for the assembly of downstream repair factors. This function requires its constitutive interaction with RNAPII close to K1268, revealing ELOF1 as a specificity factor that binds and positions CRL4CSA for optimal RNAPII ubiquitylation. Drug-genetic interaction screening also revealed a CSB-independent pathway in which ELOF1 prevents R-loops in active genes and protects cells against DNA replication stress. Our study offers key insights into the molecular mechanisms of TCR and provides a genetic framework of the interplay between transcriptional stress responses and DNA replication.


Conflict of interest statement

Competing interests: Authors declare no competing interests.

Figures

Extended Data Fig. 1.
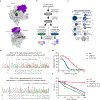
Extended Data Fig. 1.. Human ELOF1 protects cells against transcription stress.
(a) Front-view and side-view of the yeast orthologue of CSB, S. cerevisiae Rad26 (purple), bound to RNAPII (grey) (PDB: 5VVS). (b) Schematic representation of the CRISPR/Cas9 screen in RPE1-iCas9 cells in the presence of Illudin S (IC60; 25 nM). (c) Network analysis of highly significant hits representing genes that promote Illudin S toxicity. Grey lines reflect known protein-protein interactions (Cytoscape, BioGRID). (d) Sanger sequencing of the indicated RPE1-iCas9 single ELOF1-KO clones. (e) 72 h drug sensitivity assay of indicated RPE1-iCas9 KO clones. Each symbol represents the median of an independent experiment (n=2), each containing 6 technical replicates. (f) Clonogenic Illudin S survival of the indicated RPE1-iCas9 cells. Each symbol represents the mean of an independent experiment (n=3 for all except for ELOF1-KO 2–12 which is n=2), each containing 2 technical replicates.
Extended Data Fig. 2.
Extended Data Fig. 2.. Human ELOF1 and yeast ELF1 show similar RNAPII-binding modes.
(a) Sanger sequencing of the indicated U2OS (FRT) ELOF1-KO clone. (b) Clonogenic Illudin S survival of U2OS (FRT) WT, CSB-KO, ELOF1-KO, and ELOF1-KO complemented with ELOF1WT-GFP. Each symbol represents the mean of an independent experiment (n=2), each containing 2 technical replicates. (c) Alignment of human ELOF1, Xenopus leavis ELOF1, and S. cerevisiae ELF1. Conserved residues are indicated in yellow, zinc-finger cysteines in magenta, residues involved in the RPB1 or RPB2 interaction in green. Note that the C-terminus of S. cerevisiae ELF1 (83–145) is absent in human ELOF1 and Xenopus leavis ELOF1. (d) Co-immunoprecipitation (IP) of ELOF1WT-GFP and ELOF1S72K/D73K-GFP on the combined soluble and chromatin fraction (n=4). (e) Volcano plot depicting the statistical differences between 4 replicates of the MS analysis on ELOF1WT-GFP pull-down in mock treated and UV-irradiated samples. The fold change (Log2) is plotted on the x-axis and the significance (t-test -Log10 p-value) is plotted on the y-axis. RNAPII subunits are indicated in red, elongation factors are indicated in blue, GFP is indicated in green, and PAF1 subunits are indicated in purple. (f) Clonogenic Illudin S survival of U2OS (FRT) WT, ELOF1-KO, and TY1-tagged ELOF1 rescue cell lines. Each symbol represents the mean of an independent experiment (n=2), each containing 2 technical replicates.
Extended Data Fig. 3.
Extended Data Fig. 3.. ELOF1 promotes transcription elongation.
(a) Calculated speed of RNAPII, quantified by wave-front analyses, in WT (red) or ELOF1-KO (blue) cells 30 min (n=3) or 60 min (n=2) after DRB release. Data represents the median per condition (black line) and median within individual replicates (black circles). (b) Metaplots of BrU signal (nascent transcription) from 2 kb before the TSS to 2 kb after the TTS in 767 genes between 25–50 kb (upper), 562 genes between 50–100 kb (middle), or 400 genes of >100 kb in WT (red) or ELOF1-KO (blue) cells. Profiles are normalized to 100% at promoter-proximal BrU peaks instead of area under the curve for better comparison of transcription profiles. Profiles are averages of 2 independent replicates. (c) Heatmaps of ATAC-seq data around the TSS (−5 kb until +5 kb) of 3,000 genes of 3–100 kb in unirradiated RPE1-iCas9 cells (WT or ELOF1-KO).
Extended Data Fig. 4.
Extended Data Fig. 4.. ELOF1 promotes genome-wide transcription recovery.
(a) Quantification of 5-EU levels of the indicated RPE1-iCas9 cells normalized to mock-treated levels for each cell line. Cells were either mock-treated or UV-irradiated (3 h or 24 h; 12 J/m2). Each black circle represents the median of an independent experiment (n=2), each containing 2 technical replicates, >80 cells collected per technical replicate. The black line represents the median of all the cells collected. (b) Quantification of 5-EU levels normalized to the baseline level before DRB treatment for each condition. Each black circle represents the median of an independent experiment (n=2), each containing 2 technical replicates, >80 cells collected per technical replicate. The black line represents the median of all the cells collected. (c) Western blot analysis of RPE1-iCas9 ELOF1-KO cells complemented with GFP-tagged versions of ELOF1 (n=3). (d) Metaplots of BrU signal (nascent transcription) in 767 genes between 25–50 kb, or in 561 genes between 50–100 kb in WT (upper) or ELOF1-KO (lower) cells after mock treatment (red), or 3 h (blue), 8 h (black), and 24 h (green) after UV irradiation (9 J/m2). Profiles are averages of 2 independent replicates.
Extended Data Fig. 5.
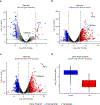
Extended Data Fig. 5.. Global gene-expression changes in response to UV irradiation.
Volcano plots of RNA-seq in the indicated RPE1-iCas9 cell lines depicting the downregulation (blue) or upregulation (red) of gene expression in response to UV irradiation (24 h; 9 J/m2). The fold change (Log2) is plotted on the x-axis and the significance (−Log10 p-value) is plotted on the y-axis. (a) WT, (b) CSB-KO, (c) ELOF1-KO. Only genes indicating at least 2 counts per million (CPM) in at least 33% of samples were included in the analysis. FDR-adjusted p-values < 0.05 were considered significant. Two short UV-response genes (ATF3, CDKN1A) are highlighted. (d) Box plot depicting the gene length of the 650 most significantly downregulated genes (in blue) or the 650 most significantly upregulated genes (in red). The horizontal line represents the median (center); Upper Bound: gene length scores larger than 75% of all data points; Lower Bound: gene lengths scores shorter than 75% of all data points. Points above and below the box represent the outliers.
Extended Data Fig. 6.
Extended Data Fig. 6.. Genome-wide redistribution of RNAPII in response to UV irradiation
(a) Heatmaps of pan-RNAPII ChIP-seq data around the TSS of 3,000 genes of 3–100 kb, ranked according to RNAPII signal in mock-treated WT cells. Heatmaps of the same genes are shown after UV irradiation (9 J/m2) in WT or ELOF1-KO cells. (b) Averaged metaplots of pan-RNAPII ChIP-seq of 3,000 genes of 3–100 kb from the TSS until the TTS in the indicated RPE1-iCas9 cells after mock-treatment (red) or at 8 h (blue) after UV irradiation (9 J/m2). (c) As in b showing the area around the TTS (−2 kb until +2 kb).
Extended Data Fig. 7.
Extended Data Fig. 7.. Metaplots of TCR-seq using a Ser2-RNAPII antibody
(a) Individual metaplots (two replicates for each condition) of ser2-RNAPII TCR-seq of 3,000 genes for 3–100 kb from the TSS until the TTS (−5 kb and +5 kb, respectively) in the indicated RPE1-iCas9 cells after mock-treatment or at 1 h, 4 h, or 8 h after UV irradiation (9 J/m2). The coding (non-transcribed) strand in shown in red, while the template (transcribed) strand is shown in blue.
Extended Data Fig. 8.
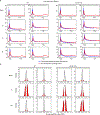
Extended Data Fig. 8.. Histogram plots of TCR-seq using a Ser2-RNAPII antibody.
(a) Frequency distribution plots of the gene-by-gene ser2-RNAPII strand-specificity index (SSI). SSIs below −0.1 or above 0.1 are presented in red. A unimodal distribution indicates no strand-bias (and thus no DNA damage in the template strand), while a trimodal distribution reflects a strand-bias caused by DNA damage in the template strand.
Extended Data Fig. 9.
Extended Data Fig. 9.. Validation of TCR-seq with a pan-RNAPII antibody.
(a) Individual metaplots (two replicates for each condition) of pan-RNAPII TCR-seq of 3,000 genes of 3–100 kb from the TSS until the TTS (−5 kb and +5 kb, respectively) in the indicated RPE1-iCas9 cells after mock-treatment or at 1 h, 4 h, or 8 h after UV irradiation (9 J/m2). The coding (non-transcribed) strand in shown in red, while the template (transcribed) strand is shown in blue. (b) Frequency distribution plots of the gene-by-gene pan-RNAPII strand-specificity index (SSI). SSIs below −0.1 or above 0.1 are presented in red. A unimodal distribution indicates no strand-bias (and thus no DNA damage in the template strand), while a trimodal distribution reflects a strand-bias caused by DNA damage in the template strand.
Extended Data Fig. 10.
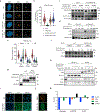
Extended Data Fig. 10.. ELOF1 is not involved in global genome repair.
(a-b) Unscheduled DNA synthesis (UDS) in the indicated RPE1-iCas9 cells following local UV irradiation (30 J/m2; 1 h). DNA damage was identified by CPD staining. (a) Representative images (scale bar = 10 μm) and (b) quantification of EdU levels normalized to WT cells. Each black circle represents the median of an independent experiment (n=2), each containing 2 technical replicates, >80 cells collected per technical replicate. The black line represents the median of all the cells collected. (c) Endogenous RNAPIIo Co-IP on U2OS (FRT) ELOF1-KO cells complemented with ELOF1WT-GFP after knockdown of CSB (siCSB) or as a control luciferase (siLUC) (n=2). (d) Western blot analysis of CSA protein levels in the indicated RPE1-iCas9 cells after mock treatment, or 7 h, 24 h, and 48 h after UV irradiation (9 J/m2; n=2). (e) Quantification of 5-EU levels of the indicated RPE1-iCas9 cells normalized to mock-treated levels for each cell line. Cells were either mock-treated or UV-irradiated (3 h or 24 h; 9 J/m2). 10 μM FT671 (USP7 inhibitor) was added to the indicated cells 24 h prior to UV irradiation. Each black circle represents the median of an independent experiment (n=3), each containing 2 technical replicates, >50 cells collected per technical replicate. The black line represents the median of all the cells collected. (f) Western blot analysis of CSA protein levels from e. (g) GST pull-down of immobilized recombinant Xenopus laevis (xl) ELOF1 incubated with recombinant xlRAD23B (n=2). (h) In vitro ubiquitylation of recombinant xlELOF1 and xlCSB with recombinant xlCRL4CSA, E1, E2, ubiquitin, and ATP. In vitro ubiquitylation reactions were stopped at the indicated times (n=3). (i) Representative images of staining with TY1 antibodies in U2OS (FRT) WT cells and ELOF1-KO cells complemented with TY1-tagged ELOF1 (n=2). (j) Representative image of staining with TY1 and RBX1 antibodies at 1 h after local UV irradiation (50 J/m2) in U2OS (FRT) ELOF1-KO cells complemented with TY1-tagged ELOF1 (n=2). (k) Results of mining a recent CRISPR screen repository. Shown are the Z-scores for the indicated sgRNAs (targeting ELOF1 (blue), CSA (orange), CSB (green), UVSSA (black) after exposure to the indicated genotoxic agents.
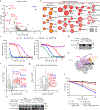
Fig. 1.
Fig. 1.. RNAPII-associated ELOF1 is a putative TCR gene.
(a) Volcano plot depicting gene-knockouts sensitizing (red) or conferring resistance (blue) to Illudin S. Fold changes (Log2) are plotted on the x-axis and significance (−Log10 p-value) is plotted on the y-axis (full analysis results in the Source data). (b) Network analysis of highly significant hits representing genes essential for Illudin S resistance. Grey lines reflect known protein-protein interactions (Cytoscape, BioGRID). (c) 72 h drug sensitivity assays of indicated RPE1-iCas9 cells. The experiment has been performed twice and each symbol represents the median of 6 technical replicates of an independent experiment. (d) Western blot analysis of U2OS (FRT) ELOF1-KO cells complemented with inducible GFP-tagged versions of ELOF1. Data shown represent 3 independent experiments. (e) Side-view of the structure (PDB: 5XOG) of K. pastoris ELF1 (orange) bound to RNAPII (grey) with RPB2 in purple. Residues important for the ELF1-RNAPII interaction are indicated. (f-g) Volcano plots depicting the statistical differences between 4 replicates of the MS analysis after GFP immunoprecipitation of mock treated cells comparing (f) ELOF1WT-GFP with GFP-NLS (g) ELOF1WT-GFP with ELOF1S72K/D73K-GFP. The fold change (Log2) is plotted on the x-axis and the significance (t-test −Log10 p-value) is plotted on the y-axis. RNAPII subunits are indicated in red, elongation factors are indicated in blue, and GFP is indicated in green. (h) Endogenous RNAPIIo Co-IP on U2OS (FRT) ELOF1-KO cells complemented with ELOF1WT-GFP and ELOF1S72K/D73K-GFP. Data shown represent 4 independent experiments. (i) Clonogenic Illudin S survival of U2OS (FRT) WT, ELOF1-KO, and GFP-tagged ELOF1 rescue cell lines. The experiment has been performed twice and each symbol represents the mean of 2 technical replicates of an independent experiment. Uncropped blots and numerical data are provided in Source data fig. 1.
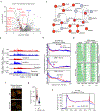
Fig. 2.
Fig. 2.. ELOF1 is required for efficient transcription elongation.
(a) Volcano plot depicting gene-knockouts depleted (red) or enriched (blue) in proliferating ELOF1-KO cells as compared to WT. The fold change (Log2) is plotted on the x-axis and significance (−Log10 p-value) is plotted on the y-axis (full analysis results in the Source data). (b) Network of interacting hit genes (FDR<0.1, red) depleted in ELOF1-KO cells compared to WT cells, and depleted interactors (normalized Z-score<−3, grey). Blue edges reflect RNAPII interactors and elongation factors, grey lines indicate other protein-protein interactions. (c) UCSC genome browser track showing read density of BrU signal across the KANSL1 gene after mock treatment, or after DRB wash-out (30 min or 60 min) showing transcription wavefronts in WT (red) and ELOF1-KO cells (blue). (d) Metaplots of nascent transcription in 400 genes of >100 kb in WT (red) or ELOF1-KO (blue) cells after mock treatment, or after DRB wash-out (30 min or 60 min). Wavefronts are defined as the distance from the TSS where the BrU signal drops below 20% of the positive signal. (e) Heatmaps of Bru-seq data from the TSS into the first 200 kb of 400 genes of >100 kb with the highest Bru-seq signal. Genes are ranked according to gene length (left panel). Heatmaps of the same genes after DRB wash-out (30 min or 60 min) in WT or ELOF1-KO cells. (f-g) Representative images (scale bar = 10 μm) (f) and quantification (g) of 5-EU levels of RPE1-iCas9 ELOF1-KO cells normalized to RPE1-iCas9 WT cells. The experiment has been performed three times and each black circle represents the median of 2 technical replicates of an independent experiment, >80 cells collected per technical replicate. The black line represents the median of all the cells collected. (h) Metaplots of BrU signal (nascent transcription) from 2 kb before the TSS to 2 kb after the TTS in 400 genes of >100 kb in WT (red) or ELOF1-KO (blue) cells. Profiles are normalized to 100% at promoter-proximal BrU peaks instead of area under the curve for better comparison of transcription profiles. Profiles are averages of 2 independent replicates. Numerical data are provided in Source data fig. 2.
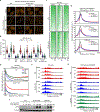
Fig. 3.
Fig. 3.. ELOF1 is essential for transcription recovery after UV.
(a-b) Recovery of RNA synthesis (RRS) in the indicated RPE1-iCas9 cells following UV irradiation (3 h or 24 h; 9 J/m2). (a) Representative images (scale bar = 10 μm) and (b) quantification of 5-EU levels normalized to mock for each cell line. The experiment has been performed twice and each black circle represents the median of 2 technical replicates of an independent experiment, >80 cells collected per technical replicate. The black line represents the median of all cells. (c) Heatmaps of Bru-seq data from the TSS into the first 100 kb of 400 genes of >100 kb ranked according to BrU signal in mock-treated cells (left panel). Heatmaps of the same genes after UV irradiation (9 J/m2). (d) Metaplots of BrU signal in 400 genes of >100 kb in WT (upper) or ELOF1-KO (lower) cells after mock treatment or UV irradiation (9 J/m2). (e) UCSC genome browser track showing BrU read density across the KANSL1 gene after mock treatment or UV irradiation (9 J/m2) in WT (red) or ELOF1-KO cells (blue). (f) Western blot analysis of ATF3 protein levels in the indicated RPE1-iCas9 cell-lines after mock treatment, or UV irradiation (9 J/m2). Data shown represent 4 independent experiments for WT and ELOF1-KO, and 3 independent experiments for CSB-KO. (g) Averaged metaplots of pan-RNAPII ChIP-seq of 3,000 genes of 3–100 kb around the TSS in RPE1-iCas9 WT (upper) or RPE1 ELOF1-KO (middle) after mock-treatment (black) or at 1 h (red) or 8 h (blue) after UV irradiation (9 J/m2). The lower panel shows metaplots in U2OS CSB-KO cells after mock-treatment (black) or 8 h after UV irradiation with either 6 J/m2 (red) or 20 J/m2 (blue). (h) UCSC genome browser track showing the read density of the ser2-RNAPII signal across the KANSL1 gene after mock treatment or UV irradiation (9 J/m2) in WT (red), ELOF1-KO (blue) or CSB-KO cells (green). Uncropped blots and numerical data are provided in Source data fig. 3.
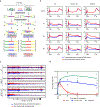
Fig. 4.
Fig. 4.. ELOF1 is essential for repair of transcription-blocking DNA damage.
(a) Schematic representation of TCR-seq. The use of asymmetrical adapters allows the preservation of strand-specific information. Without UV the reads in the transcribed strand are similar to the reads in the non-transcribed strand (unbiased reads). After UV irradiation the DNA that is co-purified with RNAPIIo after ChIP is highly enriched for DNA lesions in the transcribed strand, but not in the non-transcribed strand. These DNA lesions prevent PCR amplification during library preparation, resulting in less reads in the transcribed strand compared to the non-transcribed strand (biased reads). (b) Averaged metaplots of Ser2-RNAPII TCR-seq of 3,000 genes from the TSS until the TTS (−5 kb, +5 kb respectively) in the indicated RPE1-iCas9 cells after mock-treatment or at 1 h, 4 h, or 8 h after UV irradiation (9 J/m2). The coding (non-transcribed) strand is shown in red, while the template (transcribed) strand is shown in blue. The experiment has been performed twice. See Extended Data Fig. 6a for individual replicates and additional timepoints. (c) UCSC genome browser track showing read densities of TCR-seq data based on strand-specific Ser2-RNAPII signal across the KANSL1 gene after mock treatment, or at 8 h after UV irradiation (9 J/m2) in WT, CSB-KO or ELOF1-KO cells. Reads from the coding (non-transcribed) strand are shown in red, while reads from the template (transcribed) strand are shown in blue. (d) Time-course of the indicated RPE1-iCas9 cells showing the recovery index (RI), representing genome-wide TCR repair kinetics. Per sample, a frequency distribution plot was generated of the per-gene strand specificity index (SSI; defined as the relative difference in read density between the transcribed and non-transcribed strands) of 3,000 genes of 3–100 kb. The RI is subsequently obtained by fitting a mixture of 3 Gaussian distributions, corresponding to undamaged gene fractions (SSI=0) and two unrepaired gene fractions (i.e. |SSI|<>0). The RI was calculated from duplicate time-course experiments shown in Extended Data Fig. 8a.
Fig. 5.
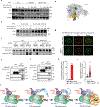
Fig. 5.. ELOF1-RNAPII interaction is required for RNAPII ubiquitylation
(a) Endogenous RNAPIIo Co-IP on RPE1-iCas9 WT, CSB-KO, and ELOF1-KO clones. (b) Endogenous RNAPIIo Co-IP on U2OS (FRT) WT, ELOF1-KO and ELOF1-KO complemented with ELOF1WT-GFP. (c) Endogenous RNAPIIo Co-IP on U2OS (FRT) WT, ELOF1-KO, and CSB-KO clones. The ubiquitylated form of RNAPII and UVSSA, detected as higher migrating bands, are indicated with an asterisk. (d) Endogenous RNAPIIo co-IP on U2OS (FRT) cells (WT and ELOF1-KO) in the presence of deubiquitylase inhibitor N-ethylmaleimide (NEM). The ubiquitylated form of RNAPII is detected using FK2 antibody. (e) Endogenous RNAPIIo Co-IP on U2OS (FRT) ELOF1-KO and ELOF1-KO complemented with ELOF1WT-GFP or ELOF1S72K/D73K-GFP. Data shown represent 3 independent experiments for a and d and 2 experiments for b, c and e. Uncropped blots are provided in Source data fig. 5.
Fig. 6.
Fig. 6.. ELOF1 interacts with the CRL4CSA complex.
(a-b) Western blot analysis of CSA protein levels of the indicated RPE1-iCas9 cell-lines after mock treatment or UV irradiation (9 J/m2). 20 μM MG-132 was added to the indicated cells 1 h prior to UV irradiation. (c) Endogenous RNAPIIo Co-IP on U2OS (FRT) cells (WT and ELOF1-KO) in the presence of NEM. 20 μM MG-132 was added to the indicated cells 1 h prior to UV irradiation. (d) Top-view of the structure (PDB: 5XOG) of K. pastoris ELF1 (orange) bound to RNAPII (grey). The RPB1-K1268 ubiquitylation site (K1264 in K. pastoris) is indicated in blue. (e-f) GST pull-down of immobilized recombinant Xenopus laevis (xl) ELOF1 incubated with (e) purified xlRNAPII or (f) recombinant xlCRL4CSA complex. Data in a-c, e and f represent 2 independent experiments. (g-i) Proximity ligation assay (PLA) between RBX1 and ELOF1-TY1 on sites of local DNA damage (1 h; 100 J/m2). DNA damage was identified by RBX1 staining and RBX1 alone is a single antibody control. (g) Representative images of PLA (scale bar = 5 μm). (h) Quantification of the percentage of cells with increased PLA signals at sites of local DNA damage. The experiment has been performed three times and each symbol represents the mean of an independent experiment (>30 cells collected per experiment). (i) Quantification of the fold change of PLA signal intensities at sites of local DNA damage compared to other nuclear areas. The experiment has been performed three times, each symbol presents the median of an independent experiment and the median of all cells collected is shown as a black line (>30 cells collected per experiment). (j) Model of how ELOF1 serves as a specificity factor for RNAPII ubiquitylation during TCR. Uncropped blots and numerical data are provided in Source data fig. 6.
Fig. 7.
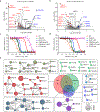
Fig. 7.. CRISPR screens identify determinants of Illudin S sensitivity in the absence of ELOF1 or CSB
(a, b) Volcano plot depicting gene-knockouts sensitizing (red) or conferring resistance (blue) to Illudin S. (a) CSB-KO (IC40; 2 nM Illudin S) or (b) ELOF1-KO (IC40; 5 nM Illudin S) cells. The fold change (Log2) is plotted on the x-axis and the significance (−Log10 p-value) is plotted on the y-axis (full analysis results in the Source data). (c-d) 72 h drug-sensitivity assays in the indicated RPE1-iCas9 single and double KO clones exposed to (c) Illudin S or (d) Irofulven. The experiment has been performed twice and each symbol represents the median of 4 technical replicates of an independent experiment. (e) Venn diagram and network analysis of overlapping and unique hits in the Illudin S screens of RPE1-iCas9 WT, CSB-KO and ELOF1-KO cell lines. Grey lines reflect known protein-protein interactions (Cytoscape, BioGRID). Numerical data are provided in Source data fig. 7.
Fig. 8.
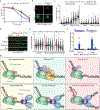
Fig. 8.. ELOF1 protects cells against DNA damage during replication.
(a) Clonogenic survival of the indicated RPE1-iCas9 cells after treatment with CD437. The experiment has been performed 4 times and each symbol represents the mean of 2 technical replicates of an independent experiment. (b-c) Representative images (scale bar = 5 μm) (b) and quantification (c) of γH2AX foci in the indicated RPE1-iCas9 cells after treatment with Illudin S (5 nM). Replicating cells were identified by EdU labelling. The experiment has been performed three times and black circles represent the median of an independent experiment (>26 cells collected per experiment). The black line represents the median of all the cells collected. (d) Top: Schematic representation of the DNA fiber assay. Cells were mock treated or treated with Illudin S (5 nM or 25 nM) for 15 h, followed by sequential incubation with CldU (red) and IdU (green), each for 20 min. Bottom: Representative images of DNA fibers in the indicated RPE1-iCas9 knockout clones after treatment with Illudin S (25 nM; scale bar = 5 μm). (e) Quantification of DNA replication fork speed in the indicated RPE1-iCas9 knockout clones after mock treatment and Illudin S treatment (5 nM or 25 nM). The experiment has been performed twice and black circles represent the median of an independent experiment (>100 forks scored per experiment). The black line represents the median of all the scored forks. (f) Top: A schematic representation of the RPL13A and EGR1 locus depicting relative position of primer pairs used for DRIP-qPCR (red). Bottom: DRIP-qPCR analysis of the RPL13A and EGR1 genes in the indicated RPE1-iCas9 cells with and without RNase H treatment. Each symbol represents the relative level of DNA-RNA hybrids normalized to input and WT without RNaseH per independent experiment. The bars indicate the mean +SEM of all the experiments (n=5 for WT and ELOF1-KO, n=2 for CSB-KO). (g) Model of the role of ELOF1 in non-replicating and replicating cells showing how ELOF1 depletion leads to defective TCR, R-loop accumulation, and replication stress upon encountering transcription-blocking DNA damage. Numerical data are provided in Source data fig. 8.

Comment in

  • The ELOF(1)ant in the room of TCR.
    Carnie CJ, Jackson SP. Carnie CJ, et al. Nat Cell Biol. 2021 Jun;23(6):584-586. doi: 10.1038/s41556-021-00698-7. Nat Cell Biol. 2021. PMID: 34108661 No abstract available.

References

    1. Brueckner F, Hennecke U, Carell T & Cramer P CPD damage recognition by transcribing RNA polymerase II. Science 315, 859–862 (2007). - PubMed
    1. Nakazawa Y et al. Ubiquitination of DNA Damage-Stalled RNAPII Promotes Transcription-Coupled Repair. Cell 180, 1228–1244.e1224 (2020). - PubMed
    1. Tufegdžić Vidaković A et al. Regulation of the RNAPII Pool Is Integral to the DNA Damage Response. Cell 180, 1245–1261.e1221 (2020). - PMC - PubMed
    1. Nakazawa Y et al. Mutations in UVSSA cause UV-sensitive syndrome and impair RNA polymerase IIo processing in transcription-coupled nucleotide-excision repair. Nat Genet 44, 586–592 (2012). - PubMed
    1. Schwertman P et al. UV-sensitive syndrome protein UVSSA recruits USP7 to regulate transcription-coupled repair. Nat Genet 44, 598–602 (2012). - PubMed

Publication types

MeSH terms