. 2021 Jul;595(7865):101-106.
doi: 10.1038/s41586-021-03626-9. Epub 2021 Jun 9.

TIM-3 restrains anti-tumour immunity by regulating inflammasome activation

Affiliations

TIM-3 restrains anti-tumour immunity by regulating inflammasome activation

Karen O Dixon et al. Nature. 2021 Jul.

Abstract

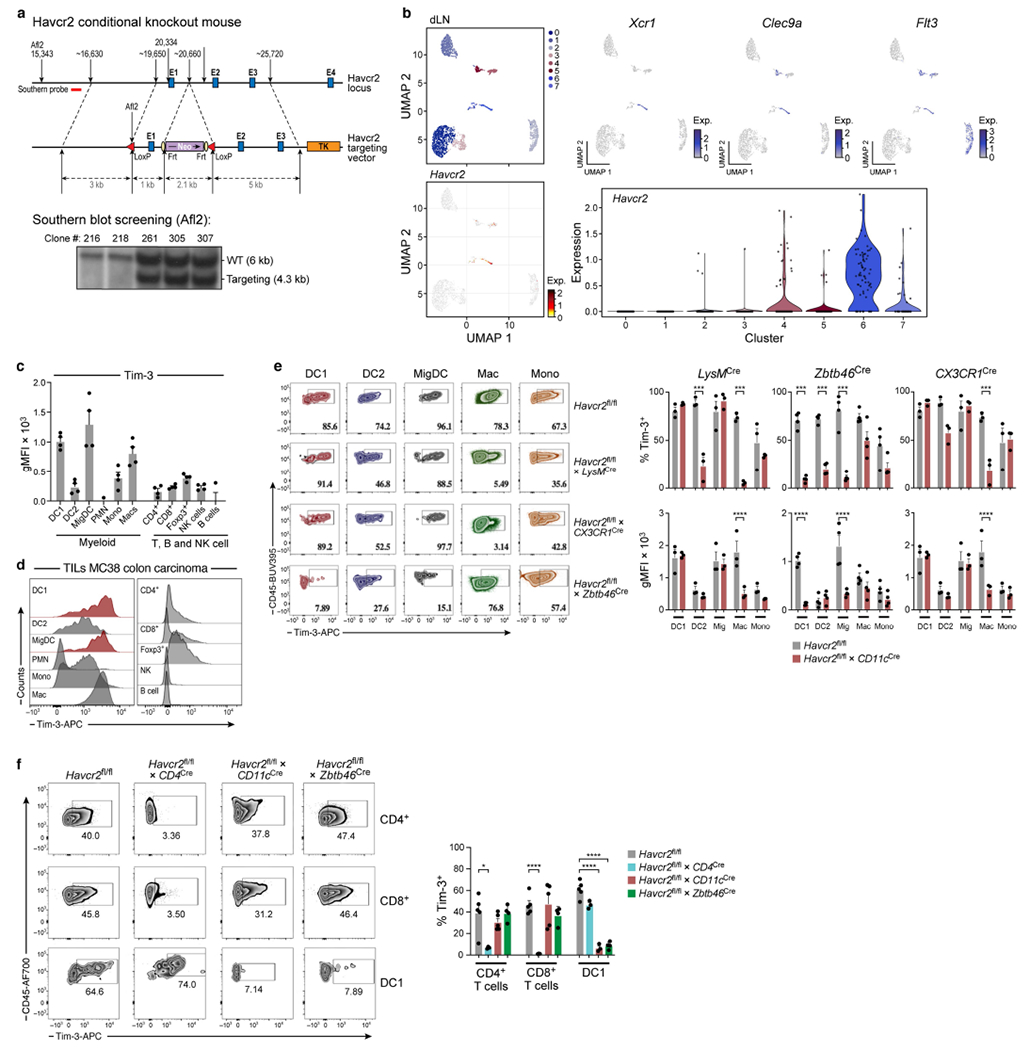
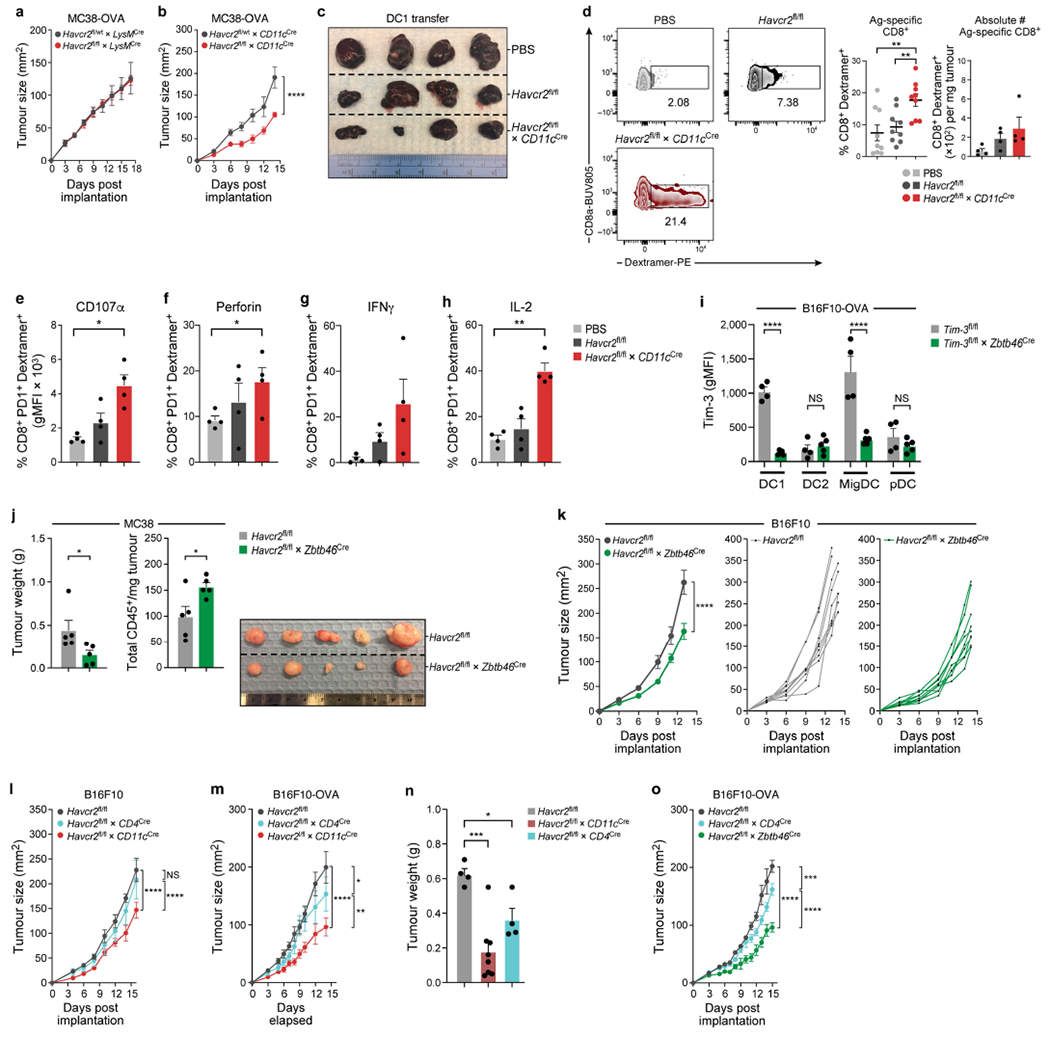
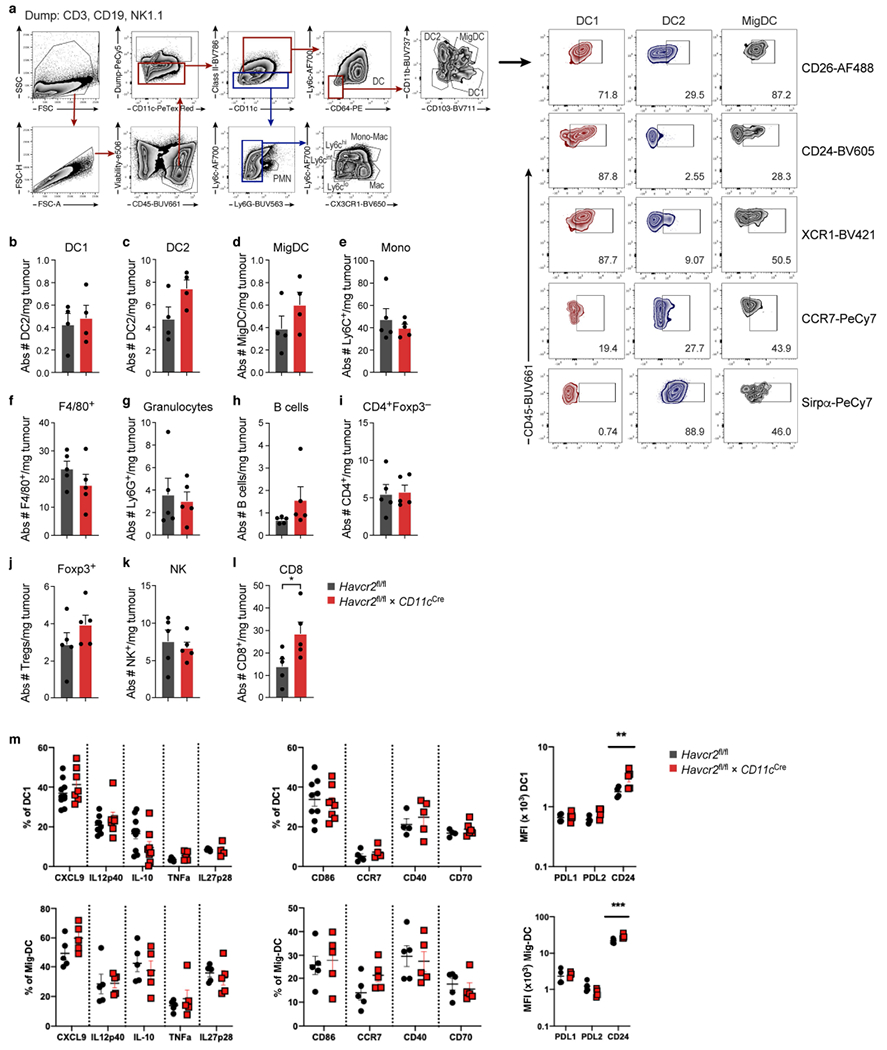
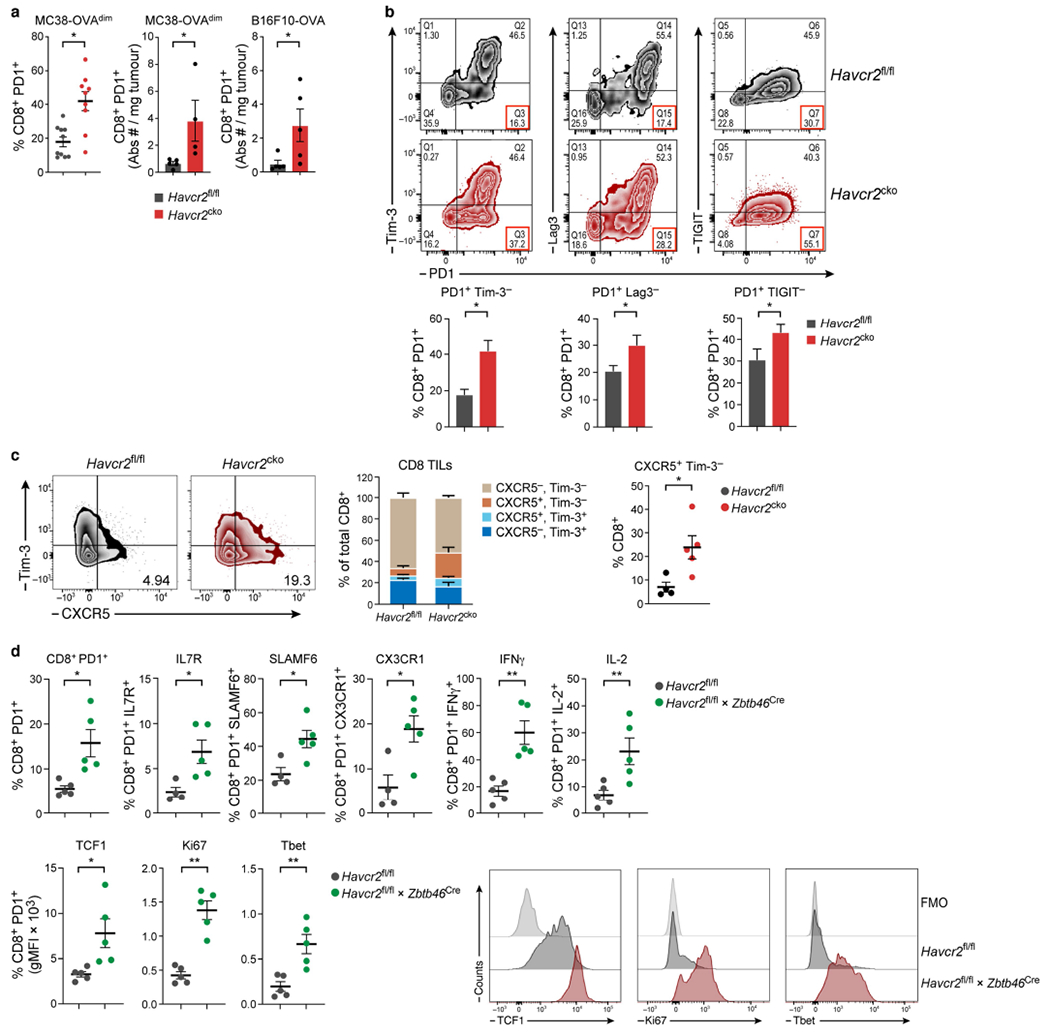
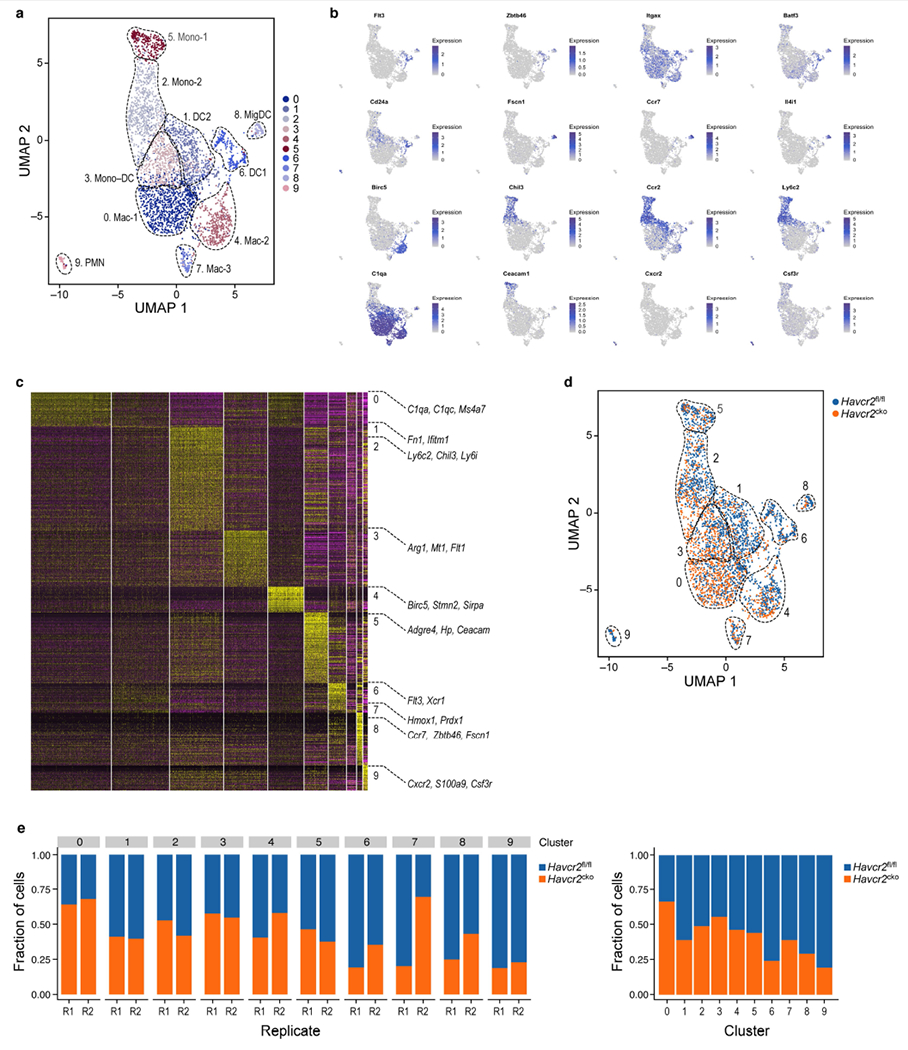
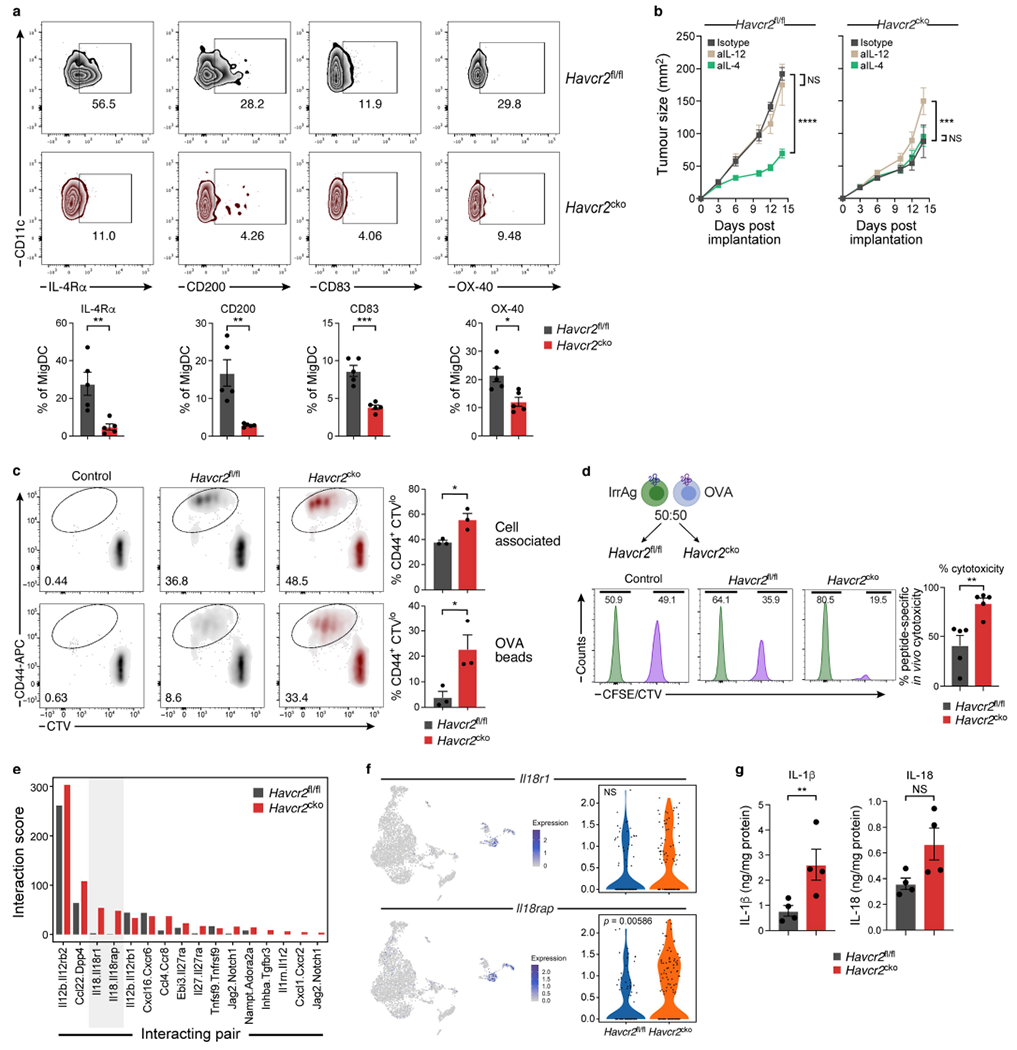
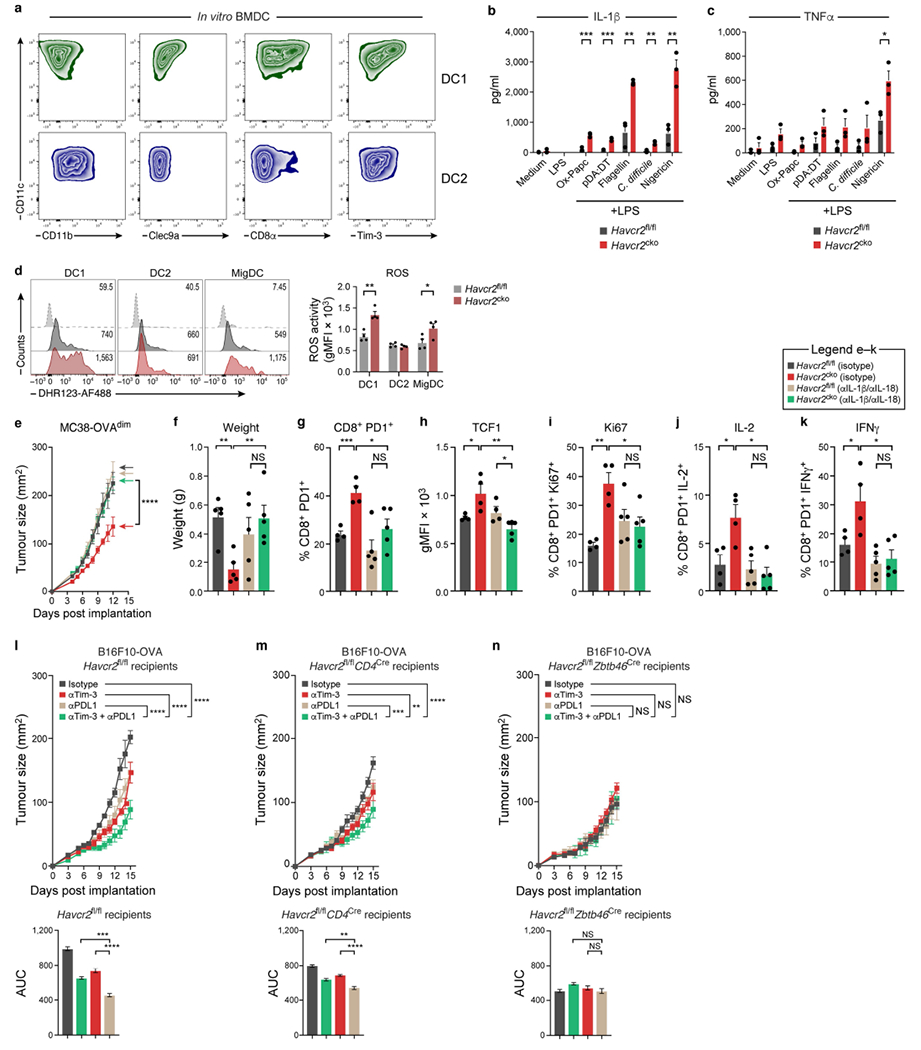
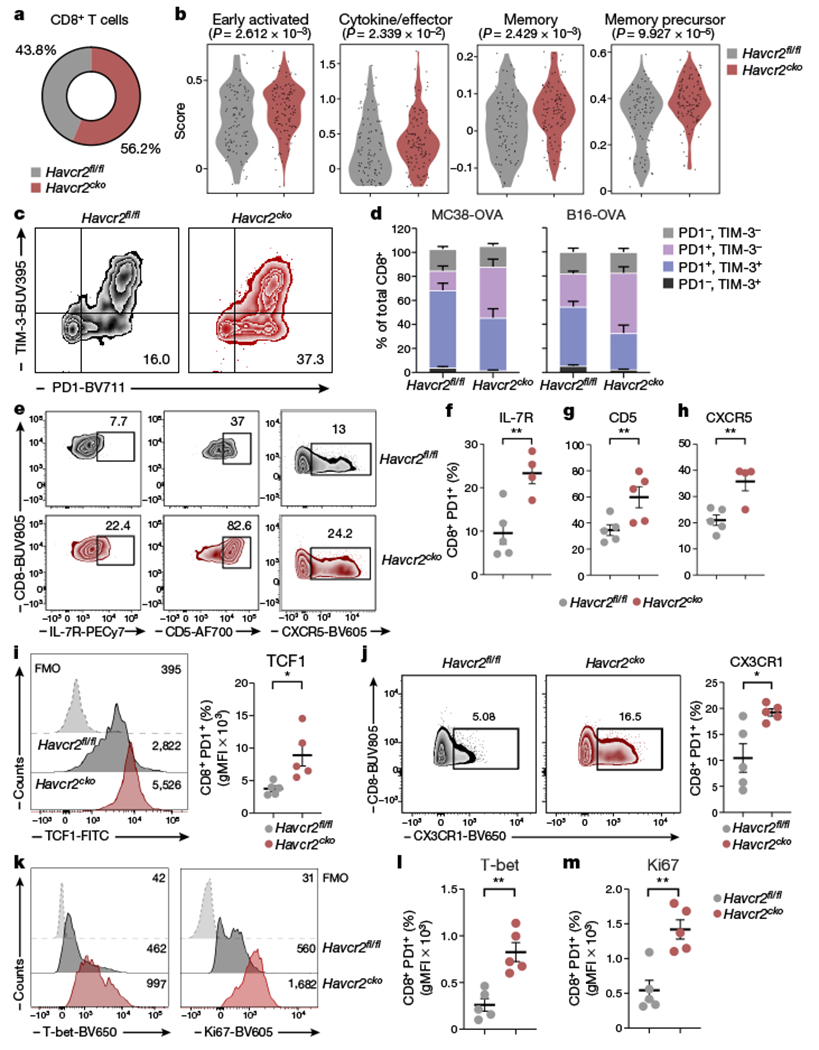
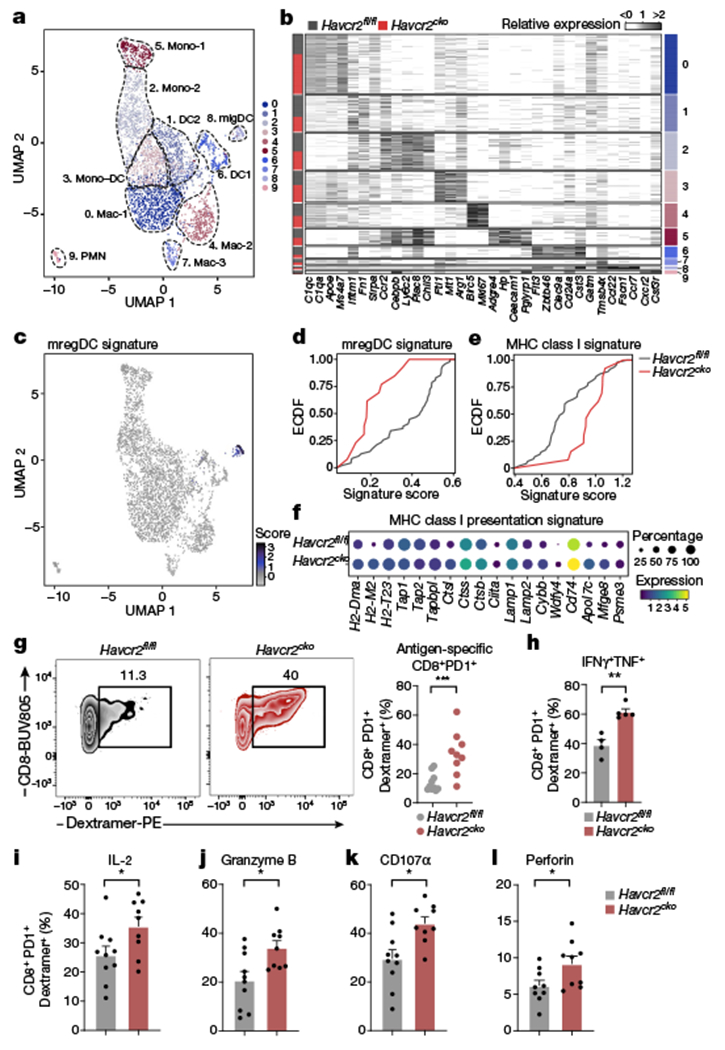
T cell immunoglobulin and mucin-containing molecule 3 (TIM-3), first identified as a molecule expressed on interferon-γ producing T cells1, is emerging as an important immune-checkpoint molecule, with therapeutic blockade of TIM-3 being investigated in multiple human malignancies. Expression of TIM-3 on CD8+ T cells in the tumour microenvironment is considered a cardinal sign of T cell dysfunction; however, TIM-3 is also expressed on several other types of immune cell, confounding interpretation of results following blockade using anti-TIM-3 monoclonal antibodies. Here, using conditional knockouts of TIM-3 together with single-cell RNA sequencing, we demonstrate the singular importance of TIM-3 on dendritic cells (DCs), whereby loss of TIM-3 on DCs-but not on CD4+ or CD8+ T cells-promotes strong anti-tumour immunity. Loss of TIM-3 prevented DCs from expressing a regulatory program and facilitated the maintenance of CD8+ effector and stem-like T cells. Conditional deletion of TIM-3 in DCs led to increased accumulation of reactive oxygen species resulting in NLRP3 inflammasome activation. Inhibition of inflammasome activation, or downstream effector cytokines interleukin-1β (IL-1β) and IL-18, completely abrogated the protective anti-tumour immunity observed with TIM-3 deletion in DCs. Together, our findings reveal an important role for TIM-3 in regulating DC function and underscore the potential of TIM-3 blockade in promoting anti-tumour immunity by regulating inflammasome activation.


Conflict of interest statement

Competing interests V.K.K. has an ownership interest in and is a member of the scientific advisory board for Tizona Therapeutics, Bicara Therapeutics, Compass Therapeutics, Larkspur Biosciences and Trishula Therapeutics. V.K.K. and A.C.A. are named inventors on patents related to TIM-3. K.O.D., V.K.K., M.T. and A.R. are named inventors on a provisional patent that has been filed including work from this study. A.R. and V.K.K. are co-founders of and have an ownership interest in Celsius Therapeutics. Additionally, A.R. is a co-founder and equity holder in Immunitas Therapeutics, and was a scientific advisory board member of Thermo Fisher Scientific, Syros Pharmaceuticals, Asimov, and Neogene Therapeutics until 31 July 2020. A.C.A. is a member of the advisory board for Tizona Therapeutics, Trishula Therapeutics, Compass Therapeutics, Zumutor Biologics and ImmuneOncia and is a paid consultant for Larkspur Biosciences and iTeos Therapeutics. A.R. and O.R.-R. are co-inventors on patent applications filed by the Broad Institute to inventions relating to single-cell genomics. The interests of V.K.K. were reviewed and managed by the Brigham and Women’s Hospital and Partners Healthcare in accordance with their conflict-of-interest policies. The interests of A.R. were reviewed and managed by the Broad Institute and HHMI in accordance with their conflict-of-interest policies. Since 1 August 2020, A.R. has been an employee of Genentech, a member of the Roche group. O.R.-R. is currently an employee of Genentech. The authors declare no other competing interests.

Figures

Extended Data Fig. 1 |
Extended Data Fig. 1 |. Generation of conditional knockout mice for TIM-3.
a, Strategy for generating the Havcr2-targeting vector to target the Havcr2 allele. Blue boxes represent exons (E). The 5′ external probes for Southern Blot are indicated by thick red line. Targeted events were identified by Southern blot analysis of Afl2-digested genomic ES cell DNAs with the 5′ flanking probe as shown in A. b, MC38-OVAdim (0.5 × 10⁶ cells) were subcutaneously implanted into Havcr2fl/fl and Havcr2fl/fl Cd11cCre mice. On D14 dLNs were explanted followed by cell sorting for sc-RNA-seq of CD45+ cells. UMAPs of canonical cDC1 markers Xcr1, Clec9a and Flt3, (bottom) UMAP of Havcr2 expression among clusters found in dLN, violin plot from scRNA-seq displaying normalized expression of Havcr2 in each cluster. c, d, WT mice were implanted with MC38 cells (1.0 × 10⁶). On D21 tumours were explanted followed by flow cytometric analysis of TIM-3 (gMFI) on tumour infiltrating immune cells (n = 3-4). e, MC38-OVAdim (0.5 × 10⁶ cells) tumour cells were subcutaneously implanted into Havcr2fl/fl, Havcr2fl/fl LysMCre (n = 3), Havcr2fl/flCx3cr1Cre (n = 3) and Havcr2fl/flZbtb46Cre (n = 4) animals. Representative Flow cytometric analysis of TIM-3 expression on DC1, DC2, migDCs, macrophages and monocytes. DCs were gated as in Ext Fig. 2: CD45+, CD3CD19NK1.1, ClassII+CD11c+, Ly6cCD64 and DC1: CD103+CD11b, DC2: CD11b+ CD103 migDCs CD11b+CD103+. Macrophages: CD45+, CD3CD19NK1.1, ClassIIlo Ly6cloCD64+F480+CX3CR1+, monocytes ClassIIlo Ly6chiCD64loLy6g. (right) Percentage expression and gMFI of TIM-3. f, MC38-OVAdim (0.5 × 10⁶ cells) were subcutaneously implanted into Havcr2fl/fl (n = 5), Havcr2fl/flCd4Cre (n = 3), Havcr2fl/flCd11cCre (n = 5) and Havcr2fl/fl Zbtb46Cre (n = 4) mice. On D14 tumours were explanted followed by flow cytometric analysis of TIM-3 expression on CD4 TILs, CD8 TILs and tumour infiltrating DC1 from Havcr2fl/fl, Havcr2fl/fl × CD4Cre, Havcr2fl/fl × CD11cCre and Havcr2fl/fl × Zbtb46Cre. The results shown are from one experiment, representative of at least 3 independent experiments. ***P < 0.001; ****P < 0.0001 (One-Way ANOVA). Data shown (f) as mean ± s.e.m. *P < 0.05; ****P < 0.0001 (Student Two-Tailed t-test).
Extended Data Fig. 2 |
Extended Data Fig. 2 |. Deletion of TIM-3 in cDC using Zbtb46 recapitulates findings using CD11c cre.
a, Tumour growth curve of MC38-OVAdim subcutaneously implanted into Havcr2fl/fl and Havcr2fl/flLysMCre (n = 6). b, Tumour growth curve MC38-OVAdim OVA subcutaneously implanted Havcr2fl/+ × CD11cCre and Havcr2fl/fl × CD11cCre (n = 5). c, Tumour of Havcr2fl/fl mice implanted with B16-OVA. On D3 XCR1+ BMDC1 were sorted, pulsed with OVA and injected into tumour bearing mice. d, Flow-cytometric analysis of frequency (n = 9), and absolute number (n = 4) of OVA specific CD8+ T cells from tumours injected with Havcr2fl/fl or Havcr2cko DC1. e-h, Flow-cytometric analysis of OVA specific CD8+ T cells from tumours injected with Havcr2fl/fl or Havcr2cko DC1 (n = 4). i, MC38-OVAdim (0.5 × 10⁶ cells) tumour cells were subcutaneously implanted into Havcr2fl/fl and Havcr2fl/fl × Zbtb46Cre animals (n = 4-5). Flow cytometric analysis (d14) of TIM-3 expression on tumour infiltrating DC1, DC2, migDCs and pDC from Havcr2fl/fl and Havcr2fl/fl × Zbtb46Cre. j, Tumour weight and total CD45+ cells of MC38 subcutaneously implanted Havcr2fl/fl and Havcr2fl/fl × Zbtb46Cre (n = 5). k, Tumour growth curve of B16 subcutaneously implanted Havcr2fl/fl and Havcr2fl/fl × Zbtb46Cre (n = 9). l, m, Tumour growth curve of B16F10 melanoma (l) and B16-OVA (m) subcutaneously implanted Havcr2fl/fl, Havcr2fl/fl × CD4Cre and Havcr2fl/fl × CD11cCre cre in parallel (n = 4-5). n, Weights of tumours from (Fig. 1l). o, B16-OVA subcutaneously implanted Havcr2fl/fl, Havcr2fl/fl × CD4Cre and Havcr2fl/fl × Zbtb46Cre in parallel (n = 4). The results shown are from one experiment, representative of at least three independent experiments. *P < 0.05; **P < 0.01; ***P < 0.001; ****P < 0.0001 (Two-Way ANOVA). Data shown (d-h) as mean ± s.e.m. *P < 0.05; **P < 0.01 (Student Two-Tailed t-test).
Extended Data Fig. 3 |
Extended Data Fig. 3 |. Deficiency of TIM-3 on DC leads to increased numbers of tumour infiltrating CD8+ T cells.
MC38-OVAdim (0.5 × 10⁶ cells) tumour cells were subcutaneously implanted into Havcr2fl/fl and isolated at D14. a, Gating strategy and phenotype of intratumoral myeloid cells. b-l, Flow cytometric quantification of immune cells in tumours from Havcr2fl/fl and Havcr2fl/fl × CD11cCre mice at d14 harvest. m, Flow cytometric analysis of DC1 and Mig DC from Havcr2fl/fl and Havcr2cko tumours at d14 harvest following in vitro stimulation for 4 h in the presence of Brefeldin A and Monensin. Data shown (l) as mean ± s.e.m. *P < 0.05 (Student Two-Tailed t-test) n = 5-9/group.
Extended Data Fig. 4 |
Extended Data Fig. 4 |. scRNA-seq of Havcr2fl/fl and Havcr2cko total CD45+ cells.
a, UMAP scRNA-seq plot of annotated total cells from Havcr2fl/fl and Havcr2fl/fl × CD11cCre (Havcr2cko) tumours. b, UMAP scRNA-seq plots showing select marker gene expression. c, Heat map from scRNA-seq displaying normalized expression of select genes in each cluster. d, UMAP scRNA-seq plot showing distribution of Havcr2fl/fl (blue) and Havcr2cko (orange) cells. e, Bar graph showing frequency of Havcr2fl/fl (blue) and Havcr2cko (orange) cells in each cluster.
Extended Data Fig. 5 |
Extended Data Fig. 5 |. Expansion of CD8+ PD1+ cells in Havcr2cko tumours.
MC38-OVAdim (0.5 × 10⁶ cells) were subcutaneously implanted into Havcr2fl/fl and Havcr2fl/fl × CD11cCre (Havcr2cko) mice and harvested on D14. a, Frequency (n = 9-10) and absolute numbers (n = 4-5) of CD8+ PD1+ TILs from Havcr2fl/fl and Havcr2cko tumours. b, Analysis of expression of PD1 versus TIM-3, Lag3 and TIGIT in CD8+ TILs (n = 4-5). c, Flow cytometry (d14 harvest) of CD8 TILs from Havcr2fl/fl and Havcr2cko for expression of TIM-3 and CXCR5 (n = 4-5). d, Flow cytometry of CD8+ PD1+ TILs from Havcr2fl/fl and Havcr2fl/fl × Zbtb46Cre for expression of IL-7R, SLAMF6 CX3CR1, IFNγ, IL-2, TCF1, Ki67 and T-bet (bottom right) Representative histograms of data in d. The results shown are from one experiment, representative of at least three independent experiments, n = 4-5 group. *P < 0.05; **P < 0.01; (Student Two-Tailed t-test).
Extended Data Fig. 6 |
Extended Data Fig. 6 |. Identification of tumour infiltrating myeloid cells in Havcr2fl/fl and Havcr2cko tumours.
a, UMAP scRNA-seq plot of annotated total myeloid cells from Havcr2fl/fl and Havcr2fl/fl × CD11cCre (Havcr2cko) tumours. b, UMAP scRNA-seq plots showing select marker gene expression. c, Heat map from scRNA-seq displaying normalized expression of select genes in each cluster. d, UMAP scRNA-seq plot showing distribution of Havcr2fl/fl (blue) and Havcr2cko (orange) cells. e, Bar graph showing frequency of Havcr2fl/fl (blue) and Havcr2cko (orange) cells in each cluster.
Extended Data Fig. 7 |
Extended Data Fig. 7 |. Decreased expression of mregDC markers in TIM-3-deficient migDCs.
a, MC38-OVAdim (0.5 × 10⁶ cells) tumour cells were subcutaneously implanted into Havcr2fl/fl and Havcr2fl/fl × CD11cCre (Havcr2cko) animals and Flow cytometric analysis of DC populations was performed on D14 to assess expression of described mregDC markers including CD200, CD83, 1L4R and OX40. The results shown are from one experiment, n = 5 per group. *P < 0.05; **P < 0.01; ***P < 0.001; (One-Way ANOVA). b, Tumour growth curves of MC38-OVAdim (0.5 × 10⁶ cells) subcutaneously implanted into Havcr2fl/fl and Havcr2cko mice treated with either Isotype control, anti-IL-12 (500μg/mouse) or anti-IL-4 (25μg/mouse). Treatment was initiated on D3 and antibodies were delivered i.p. every 3 days until experiment cessation. The results shown are from one experiment, n = 4-5 per group. ***P < 0.001; ****P < 0.0001 (Two-Way ANOVA). c, Splenic DC were sorted from Havcr2fl/fl and Havcr2cko animals and cultured with dead HLA mismatched splenocytes osmotically loaded with 10mg/ml Ova together with CTV labelled naïve OTI cells. Representative plots of CD44+ CTVlo T cells after 72-h co-culture. Mean ± s.e.m. of 3 individual mice. Alternatively, DC from Havcr2fl/fl and Havcr2cko animals, were cultured with beads passively adsorbed with Ova together with CTV labelled naïve OTI cells. Representative plots of CD44+CTVlo T cells after 72-h co-culture. Mean ± s.e.m. of 3 individual mice, *P < 0.0001 (Student Two-Tailed t-test). d, CFSE or CTV labelled splenocytes were pulsed with OVA257-264 or MOG37-46 (Irrelevant Antigen) and injected at 50:50 ratio into MC38-OVAdim bearing Havcr2fl/fl or Havcr2cko mice. Percentage cytotoxicity calculated as 100-(CTV/CTV+CFSE) (n = 5). e, Bar plot of data from Fig. 4a, demonstrating unidirectional analysis of the fraction of DCs expressing ligand X and the fraction of T cells expressing the cognate Receptor; Ligand (migDCs): Receptor (CD8) interaction from Havcr2fl/fl (grey) and Havcr2cko (red) tumours. f, UMAP showing expression of Il18r1 and Il18rap on cluster 7 (CD8+ T cells), with violin plots showing the differential expression of both receptor in of Havcr2fl/fl (blue) and Havcr2cko (orange) CD8+ T cells, Havcr2fl/fl and Havcr2cko (e) tumours were harvested and mechanically dissociated. Tissue supernatant was collected, and levels of cytokines were determined relative to mg protein per sample, n = 4/group, **P < 0.01; (Student Two-Tailed t-test).
Extended Data Fig. 8 |
Extended Data Fig. 8 |. Enhanced inflammasome activation in TIM-3-deficientcko DC.
BMDC were differentiated in the presence of FLT3L for 10 days. a, Flow cytometric analysis assessing typical DC1 and DC2 markers. XCR1+ cells were sorted after 10 days of differentiation and seeded at a density of 0.25 × 10⁶. Sorted cells were either unstimulated or primed with LPS (1μg/ml) for 3 h followed by the addition of oxidised phospholipids (ox-PAPC) (100μg/ml), pdA: dT (1μg/ml), Flagellin (1μg/ml), C. difficile (1μg/ml), or Nigericin (10mM). b, c, Following overnight cultures supernatants were harvested and ELISA was performed to detect IL-1β (b) and TNF (c) (non-inflammasome regulated control). The results shown are from one experiment (n = 3 per group), representative of at least 3 individual experiments, *P < 0.05 **P < 0.01; ***P < 0.001 (Student Two Tailed t-test). d, MC38-OVAdim was subcutaneously implanted into Havcr2fl/fl and Havcr2cko mice and on D14 mononuclear cells were isolated and incubated with DHR123 as a measure of ROS activity (n = 4). e, Tumour growth curve of MC38-OVAdim subcutaneously implanted Havcr2fl/fl and Havcr2cko treated with control or anti-IL-1β and anti-IL-18 (n = 4). f, Weights of B16-OVA (0.25 × 10⁶ cells) subcutaneously implanted into Havcr2fl/fl and Havcr2fl/fl × Zbtb46Cre and treated with either Isotype control (Hamster IgG and Rat IgG2a) or anti-IL-1β and anti-IL-18 (Hamster IgG and Rat IgG2a respectively), all at a dose of 8mg/kg. g-k, Flow cytometric analysis of CD8+ TILs harvested from MC38-OVAdim tumours subcutaneously implanted into Havcr2fl/fl and Havcr2fl/fl × Zbtb46Cre and treated with either Isotype control upon termination of experiment (d15). The results shown are from one experiment, representative of at least two independent experiments n = 4-5/group. ***P < 0.001; ****P < 0.0001 (Two-Way ANOVA). l-n, Havcr2fl/fl (l), Havcr2fl/fl × CD4Cre (m) and and Havcr2fl/fl × Zbtb46Cre (n) mice were implanted with B16-OVA and monitored for development of a palpable tumour. On D6 when tumours reached ~30-50mm mice were randomized and treated with either (i) Isotype controls (IgG2a and IgG2b), (ii) anti-TIM-3, (iii) anti PD-L1 and (iv) anti-TIM-3 + PD-L1. Anti-TIM-3 was administered at a dose of 200μg/mouse and anti-PDL1 at a dose of 50μg/mouse. All tumours were measured daily for the duration of the experiment. Antibody treatment was initiated on D6 and administered again on D9 and D12. Area under the curve (AUC) was calculated from graphs in (k-m). The results shown are from one experiment, n = 4 per group. **P < 0.01; ***P < 0.001; ****P < 0.0001 (Two-Way ANOVA). Area under curve data-**P < 0.01; ***P < 0.001; ****P < 0.0001 (One-Way ANOVA).
Fig. 1 |
Fig. 1 |. Deletion of TIM-3 on DCs leads to reduced tumour burden.
a-d, MC38-OVAdim cells were implanted subcutaneously into Havcr2fl/fl and Havcr2fl/flCd4cre (n = 4) (a), Havcr2fl/flE8icre (n = 5) (b), Havcr2fl/flFoxp3-ERT2cre (n = 5) (c) and Havcr2fl/flNcr1cre (n = 4) (d) mice and tumour growth was measured over time. e, Day 14 MC38-OVAdim tumours were explanted. CD45+ cells from tumour, draining lymph nodes (dLN) and non-draining lymph nodes (ndLN) were analysed by scRNA-seq. Top, uniform manifold approximation and projection (UMAP) clustering and Havcr2 expression (exp.) in each cluster. Middle, clustering of CD45+ cells from wild-type tumours with cell annotation and Havcr2 expression. Bottom, violin plot showing normalized expression of Havcr2 in each CD45+ tumour cluster. CMP, common myeloid progenitors; LN, lymph node; mac, macrophages; mono, monocytes; mono-mac, monocyte-derived macrophages; PMN, polymorphonuclear cells. f, g, Growth curve of MC38-OVAdim cells subcutaneously implanted into Havcr2fl/fl and Havcr2fl/flCx3cr1cre (n = 3) (f) and Havcr2fl/flCd11ccre (n = 13) (g) mice. h, KP1.9 cells were injected intravenously into Havcr2fl/fl and Havcr2fl/fl Cd11ccre mice (n = 5). Tumour burden was assessed by histological analyses of explanted lung tissue collected 4 weeks after implantation. i, Wild-type mice were subcutaneously implanted with B16-OVA cells (n = 4). In vitro-derived DC1 cells were generated from Havcr2fl/fl and Havcr2fl/flCd11ccre mice, cultured with soluble OVA and injected subcutaneously after three days of culture. PBS was injected into non-transfer controls. j, k, Tumour growth in Havcr2fl/fl and Havcr2fl/flZbtb46cre mice subcutaneously implanted with MC38-OVAdim (n = 4) (j) or MC38 (n = 5) (k) cells. l, Growth curve of MC38-OVAdim cells subcutaneously implanted in Havcr2fl/fl, Havcr2fl/flCd4cre (n = 4) and Havcr2fl/flCd11ccre (n = 8) mice. Results are shown from one experiment, representative of at least three independent experiments. Data are mean ± s.e.m. *P < 0.05, **P < 0.01, ***P < 0.001 and ****P < 0.0001; two-way ANOVA.
Fig. 2 |
Fig. 2 |. Expansion of stem-like memory-precursor CD8+ T cells in Havcr2cko tumours.
MC38-OVAdim cells were implanted subcutaneously into Havcr2fl/fl and Havcr2fl/fl Cd11ccre (Havcr2cko) mice and explanted on day 14. CD45+ cells were Isolated from tumour for analysis by scRNA-seq. a, Proportions of CD8+ T cells in scRNA-seq data. b, Transcripts from CD8+ T cells in tumours from Havcr2fl/fl and Havcr2cko mice were assessed for enrichment of signatures of early-activated, effector, memory and memory-precursor T cells. c, d, Flow cytometry analysis of TIM-3 and PD1 expression on CD8+ TILs from MC38-OVAdim (n = 10) and B16-OVA tumours (n = 4 or 5) on day 14 after implantation (c) and quantification of CD8+ cells expressing TIM-3 and PD1 (d). e-h, Flow cytometry analysis of IL-7R, CD5 and CXCR5 expression in CD8+PD1+ TILs (e) and proportions of cells expressing IL-7R (f), CD5 (g) and CXCR5 (h). i, TCF1 expression among CD8+PD1+ TILs. FMO, fluorescence minus one; gMFI, geometric mean fluorescence intensity. j, Representative CX3CR1 expression among CD8+PD1+ TILs. k, Representative histograms (k) showing expression of T-bet (summarized in l) and Ki67 (summarized in m) among CD8+PD1+ TILs. Results shown are from one experiment, representative of at least three independent experiments. n = 4 or 5. Student’s two-tailed t-test.
Fig. 3 |
Fig. 3 |. TIM-3 deficiency promotes DC functionality and enhances antigen-specific anti-tumour immunity.
a, Annotated UMAP plot showing scRNA-seq analysis of myeloid cells from tumours in Havcr2fl/fl and Havcr2fl/fl Cd11ccre (Havcr2cko) mice. b, Heat map showing expression of selected genes, cluster as identified in a is indicated on the right, the bar on the left indicates Havcr2fl/fl (grey) or Havcr2cko (red). c, UMAP showing enrichment of mreg DC signature in cluster 8 (migDCs). d, Empirical cumulative distribution function (ECDF) plot of enrichment score for mregDC signature in Havcr2fl/fl (grey) or Havcr2cko (red) migDCs, (P = 9.4 × 10⁻⁴). e, ECDF plot of MHC class I presentation signature (P = 1.01 × 10⁻³). f, Dot plot of selected genes from MHC class I presentation signature. g, Frequency of OVA-specific CD8+ T cells from tumours in Havcr2fl/fl and Havcr2cko mice at day 14. h-l, MC38-OVAdim cells were implanted subcutaneously into Havcr2fl/fl and Havcr2cko mice. Tumours were collected on day 14 and CD8+ TILs were analysed by flow cytometry for expression of IFN-γ and TNF (h), IL-2 (i), granzyme B (j), CD107α (k) and perforin (l). Results shown are representative of at least three independent experiments; n = 4 (h), n = 9 per group (other panels). Student’s two-tailed t-test.
Fig. 4 |
Fig. 4 |. Loss of TIM-3 on DCs promotes inflammasome activation.
a, Unidirectional analysis of the fraction of DCs expressing a ligand and the fraction of T cells expressing the cognate receptor; ligand (migDCs)-receptor (CD8) interaction from tumours in Havcr2fl/fl (left) and Havcr2cko (right) mice. b, c, ECDF plots showing enrichment of IL-18 (b) and IL-1 (c) signatures in Havcr2fl/fl (grey) and Havcr2cko (red) CD8+ TILs. d, e, ECDF plot of enrichment score for inflammasome signature (d; P = 1.5 × 10⁻³) and dot plot for selected genes from inflammasome signature (e) in Havcr2fl/fl (grey) and Havcr2cko (red) migratory DCs. f, g, ECDF plot of enrichment score for oxidative stress signature (f) and dot plot of selected genes from oxidative stress signature (g) in Havcr2fl/fl (grey) and Havcr2cko (red) migratory DCs. h, i, MC38-OVAdim cells implanted subcutaneously in Havcr2fl/fl and Havcr2cko mice treated with N-acetylcysteine (NAC) (n = 4 or 5). h, Tumour size. i, Tumour supernatant was collected, and levels of IL-1β were determined by ELISA. Data are mean ± s.e.m. Student’s two-tailed t-test. j-l, Tumour growth curve of MC38-OVAdim cells implanted subcutaneously in Havcr2fl/fl and Havcr2cko mice treated with vehicle control or caspase 1 inhibitor (Casp1) (j; n = 4), MCC950 (k; n = 5) or anti-IL-1β and anti-IL-18 (l; n = 4 or 5). m-q, B16-OVA cells were implanted subcutaneously in Havcr2fl/fl and Havcr2cko mice treated with anti-IL-1β and anti-IL-18 (n = 5). Flow cytometry analysis of CD8+ TILs (m) from Havcr2fl/fl and Havcr2cko mice bearing B16-OVA tumours and treated with isotype control or anti-IL-1β and anti-IL-18. Expression of TCF1+ (n), Ki67 (o), T-bet (p) and IFN-γ (q). Results shown are from one experiment, representative of at least two independent experiments; n = 4 or 5 per group; h, j-l, two-way ANOVA; i, m-q, one-way ANOVA.

References

    1. Monney L et al. Th1-specific cell surface protein Tim-3 regulates macrophage activation and severity of an autoimmune disease. Nature 415, 536–541 (2002). - PubMed
    1. Sakuishi K et al. Targeting Tim-3 and PD-1 pathways to reverse T cell exhaustion and restore anti-tumor immunity. J. Exp. Med. 207, 2187–2194 (2010). - PMC - PubMed
    1. Jin HT et al. Cooperation of Tim-3 and PD-1 in CD8 T-cell exhaustion during chronic viral infection. Proc. Natl Acad. Sci. USA 107, 14733–14738 (2010). - PMC - PubMed
    1. Rangachari M et al. Bat3 promotes T cell responses and autoimmunity by repressing Tim-3-mediated cell death and exhaustion. Nat. Med. 18, 1394–1400 (2012). - PMC - PubMed
    1. da Silva IP et al. Reversal of NK-cell exhaustion in advanced melanoma by Tim-3 blockade. Cancer Immunol. Res. 2, 410–422 (2014). - PMC - PubMed

Publication types